
13.00% p.a. Multi Barrier Reverse Convertible on Avolta, Richemont & Flughafen Zürich
Headline Simulation Results
| Metric | Result |
|---|---|
| Expected annualized return | 2.73% |
| Probability of negative return | 27.80% |
| 99% confidence VaR (1 year) | −45.08% |
| Expected holding period | 10.03 months |
| Expected total return (over realized holding period) | 0.59% |
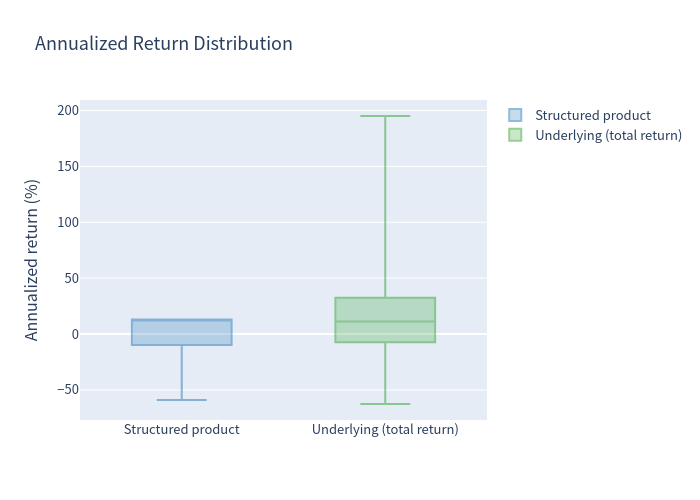
The product behaves as a classic yield-enhancement structure: the typical (median) outcome is strong — an annualized return of 13.00%, i.e. the full coupon — but the distribution is left-skewed. Around 72% of scenarios deliver a double-digit annualized return, while roughly 30% of paths breach the protection barrier and about 28% end with negative returns — deep principal losses that pull the average return down to 2.73%.
Basic Product Information
- Type: Worst-of Barrier Reverse Convertible (SSPA 1230, Yield Enhancement), issuer-callable, CHF-denominated.
- Underlyings (worst-of): Avolta AG, Compagnie Financière Richemont (A), Flughafen Zürich AG — all listed on SIX Swiss Exchange.
- Coupon: 13.00% p.a., paid quarterly in four instalments of CHF 32.50 per CHF 1,000 (3.25 index points per 100). Coupons are paid in any case while the product is outstanding.
- Barrier: 69% of each underlying's initial level, observed continuously on a worst-of basis (approx. 31% protection buffer).
- Strike: 100% (initial level).
- Issuer call: Callable at months 6 and 9 at the issuer's discretion; redemption = par + coupon. The call mainly shortens the holding period (average 10.0 months); across call assumptions the risk profile stays broadly stable (expected annualized return 2.4%–3.7%, 99% VaR ≈ −45%).
- Upside: Capped at par — all upside comes from the fixed coupon (max total = 113 points).
How it works (plain language)
You lend the CHF 1,000 notional and, in return, receive a high 13% annual coupon paid quarterly (3.25% each quarter).
- If none of the three shares ever trades below 69% of its starting price during the year, you get your full CHF 1,000 back at maturity — plus all coupons.
- If any share dips below its 69% barrier and the weakest share finishes below its starting level, you do not get par back. Instead you receive that weakest share (or its cash equivalent), worth whatever it has fallen to. Your coupons are still paid, but the principal can be substantially impaired.
- If the barrier is breached but the weakest share still finishes at or above its starting level, you receive par back (plus coupons).
- The issuer may repay early after 6 or 9 months, returning par plus the coupon due.
Key Statistics — Structured Product vs Underlying (Equal-Weight Basket)
| Metric | Structured Product | Underlying Basket (price) | Underlying Basket (total return, +dividends) |
|---|---|---|---|
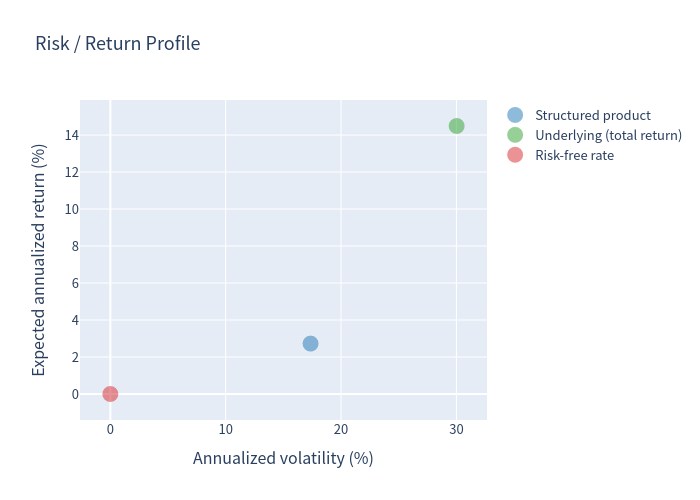
| Expected annualized return | 2.73% | 11.54% | 14.49% |
| Expected annualized volatility | 17.36% | 30.02% | 30.02% |
| Probability of loss | 27.80% | 39.25% | 35.32% |
| 99% VaR (1 year) | −45.08% | −43.64% | −40.69% |
| Median annualized return | 13.00% | 8.32% | 11.15% |
Scenario Probabilities
| Scenario | Probability |
|---|---|
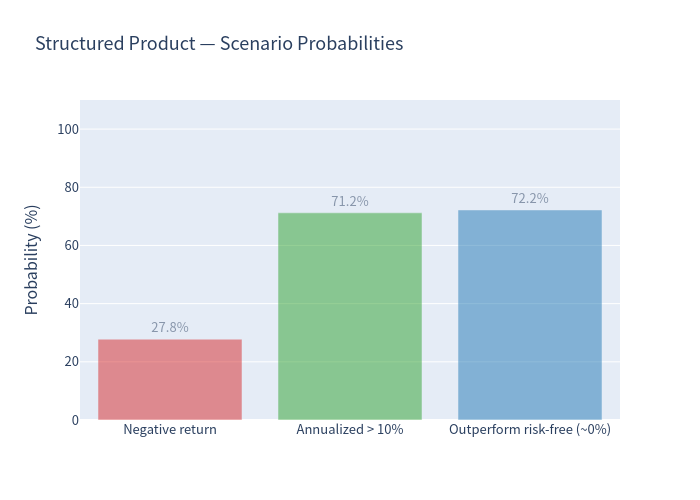
| Negative return (worst case) | 27.80% |
| Annualized return > 10% (best case) | 71.21% |
| Outperform the risk-free rate (~0%) | 72.20% |
Outcome Distribution
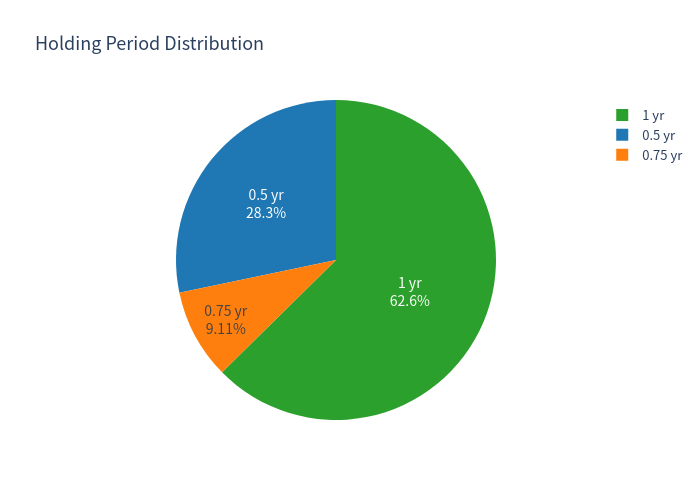
- Held for 6 months: 28.28% · 9 months: 9.11% · 12 months: 62.61%
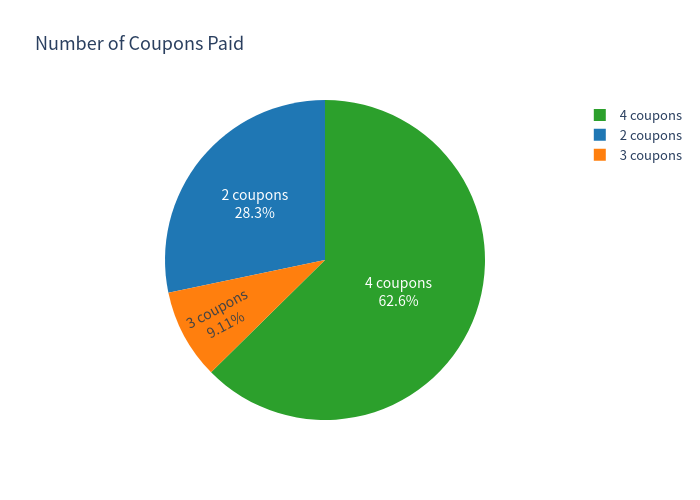
- Coupons received — 2 coupons: 28.28% · 3 coupons: 9.11% · 4 coupons: 62.61%
Charts
Simulated outcomes — structured product vs underlying basket (colored by years held)
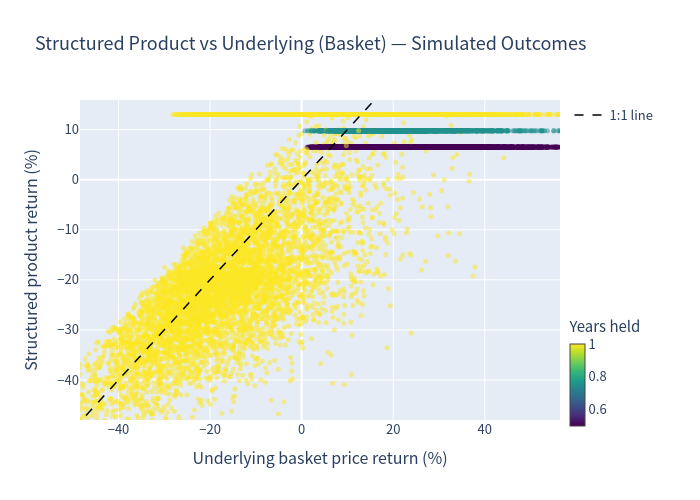
Most points cluster on the upper plateau (product ~13%, near the coupon cap) while a downward tail shows scenarios where the barrier was breached.
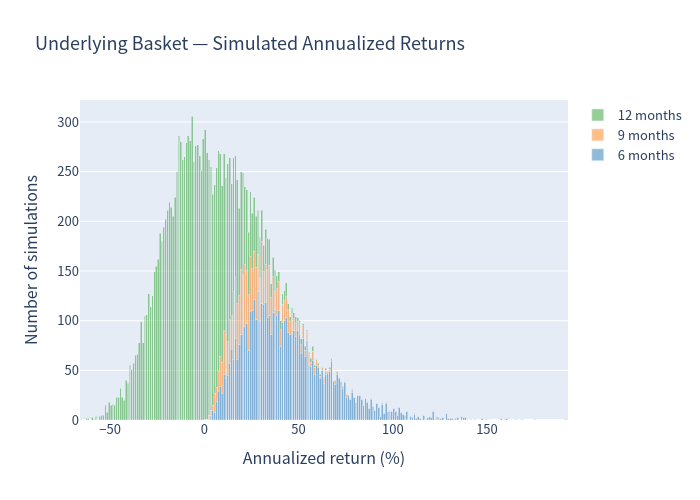
Underlying basket — simulated annualized returns
Structured product — simulated annualized returns
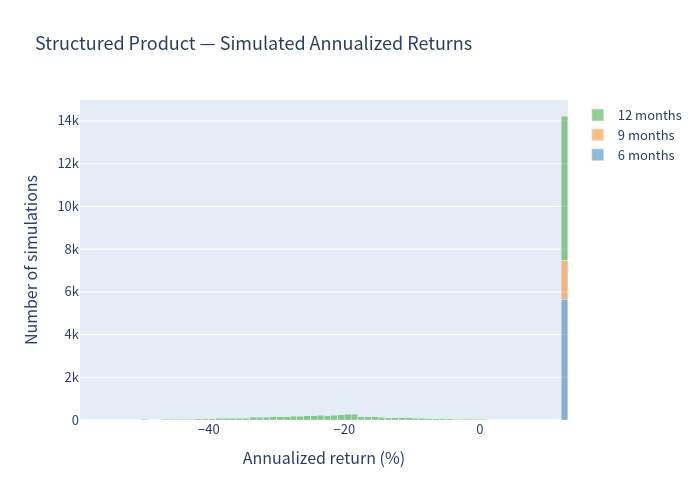
The product's distribution is clearly bimodal: a large mass at +13% (coupons + par) and a loss tail down to roughly −59% annualized.
Scenario probabilities
Risk / return profile
Annualized return box plot
Holding-period distribution
Number of coupons paid
Investment Commentary
Strengths
- A high 13.00% p.a. coupon — far above the prevailing CHF risk-free rate (~0%) — paid quarterly and contractually due while the product is live.
- Conditional capital protection: the 69% worst-of barrier leaves a ~31% downside buffer, and roughly 70% of simulated paths never trigger it.
- A favourable typical outcome: the median annualized return is 13.00% vs 8.32% for the underlying basket, and ~72% of paths beat the risk-free rate.
- Lower volatility than the underlying (17.4% vs 30.0% annualized) because of the coupon floor and the barrier structure.
Considerations
- Worst-of exposure: the payoff depends on the weakest of three shares, so dispersed or correlated downturns increase the chance of a barrier breach and a poor redemption.
- Capped upside: returns are limited to the coupon; the product captures none of a strong rally. Over the simulation the average annualized return (2.73%) trails the basket's total return (14.49%).
- Deep left tail: when the barrier is breached and the weakest share finishes below its strike, principal is delivered in the fallen share. The 99% 1-year VaR of −45.08% reflects this — losses, though less frequent than the basket's, are severe when they occur.
- Issuer/credit risk applies (Leonteq Securities AG, rated BBB−).
Bottom line
This note trades the underlying's upside for a high, fixed income stream and a meaningful (but not absolute) downside buffer. It rewards investors who expect the three shares to stay above 69% of their starting levels; it penalises those who are wrong on the weakest name.