
11.00% p.a. Multi Barrier Reverse Convertible (Callable)
Headline simulation results
Monte-Carlo of 20,000 paths, month-by-month, continuous 55% barrier.
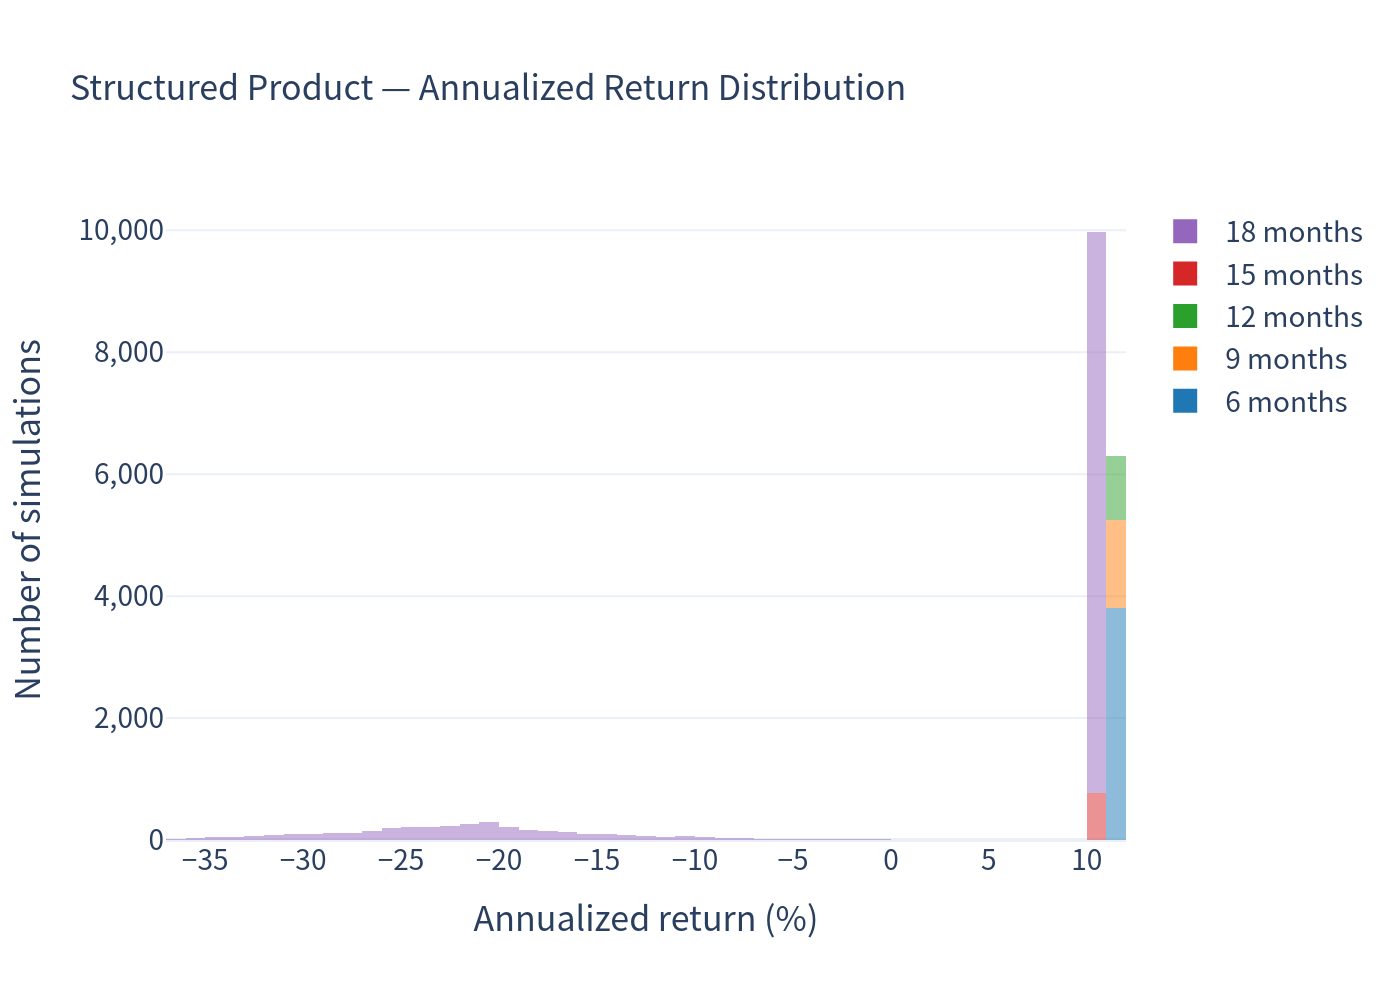
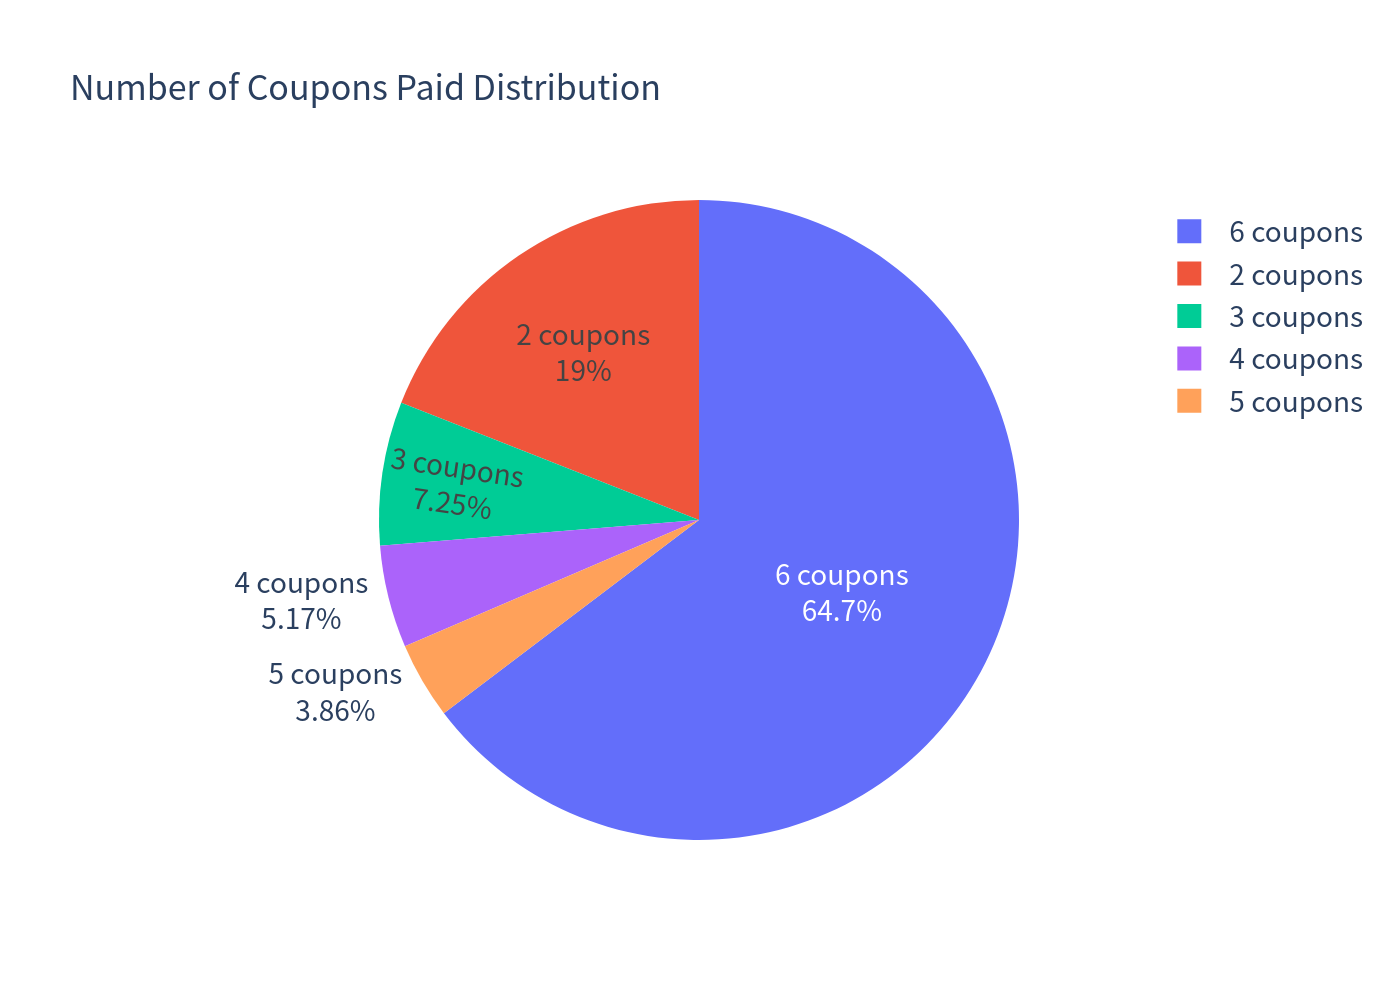
The single most common outcome is the "designed" one: the note survives to maturity, pays all six coupons and repays par — an annualized return of ≈ 10.7%. Roughly one path in five (18.5%) ends in a capital loss, and when it does the average loss is about −30.8%. The distribution is therefore close to bimodal: a steady ≈ 11% coupon, punctuated by a sharp capital loss if the 55% barrier is breached and the worst share recovers only partially.
How it works — in plain language
- You buy the note at 100 (CHF 1,000 per unit). It pays a fixed coupon of 11.00% p.a., i.e. 2.75 points (CHF 27.50) each quarter, for up to six quarters.
- That coupon is paid regardless of how the three shares behave — even if they fall. Only your capital is at risk.
- Downside protection (55% barrier): if none of the three shares ever trades at or below 55% of its starting level (monitored continuously over the whole 18 months), you get your 100 back at maturity plus the coupons. The barrier is forgiving in depth — each share may fall up to about 45% — but because the structure is worst-of, a breach by any single share is enough to remove the protection.
-
If the barrier is breached, protection is gone. At maturity you then take the
worst-performing of the three shares:
- if that worst share finishes below its start, you receive its shares (worth less than par → a loss);
- if even the worst share finishes at or above its start, you still get par back.
- Upside is capped. You never get more than par plus the coupons, no matter how far the shares rise.
- The issuer can call the note on any quarterly observation date. If called, you receive par plus that quarter's coupon and the note ends — so the coupon stream can be cut short just when the shares are doing well.
Key statistics
| Metric | Structured product | Underlying basket (total return) |
|---|---|---|
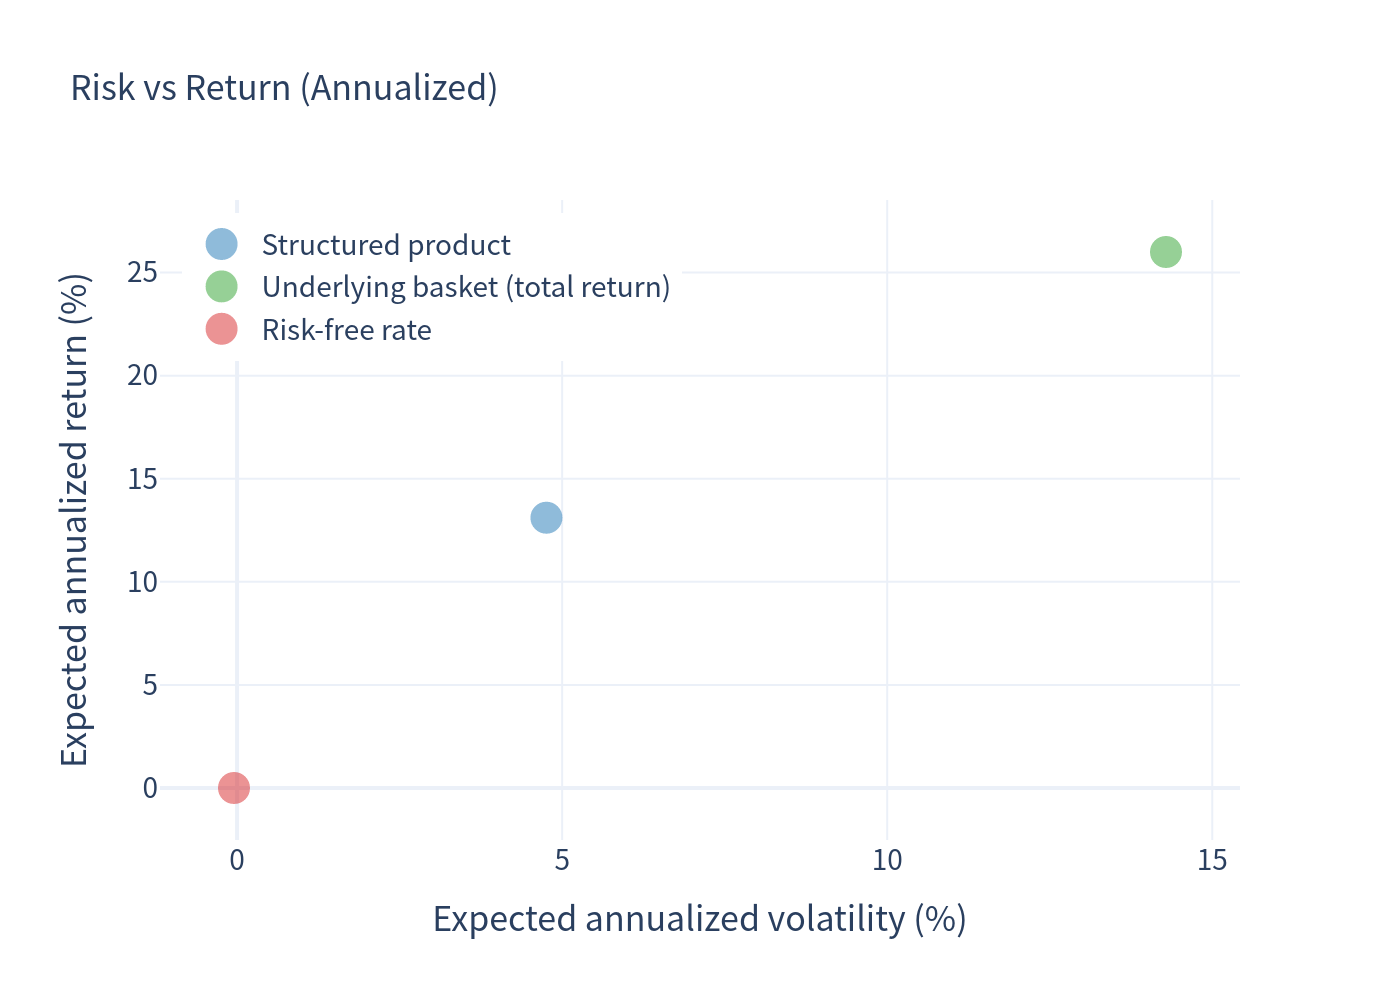
| Expected annualized return | 4.76% | 14.29% |
| Expected annualized volatility | 13.11% | 26.00% |
| Probability of loss | 18.52% | 33.46% |
| 99% confidence VaR (1 year) | −33.97% | −27.49% |
| Risk-free rate (CHF, 1-yr avg) | — | ≈ 0.00% (−0.05%) |
Note on horizon. The note is callable, so its holding period varies (6, 9, 12, 15 or 18 months). The underlying figures above are measured over the same realized holding period as the note, as required. This flatters the basket: the note is redeemed early precisely when the basket has rallied hard, so short, strongly-positive holding periods are over-represented. Measured instead as a plain 18-month buy-and-hold, the equal-weight basket returns 5.62% annualized (7.67% with dividends) — a more balanced reference point. Because the note's coupons are paid unconditionally, its own annualized return is stable (~11% when it does not lose money) and does not suffer the same distortion.
Charts
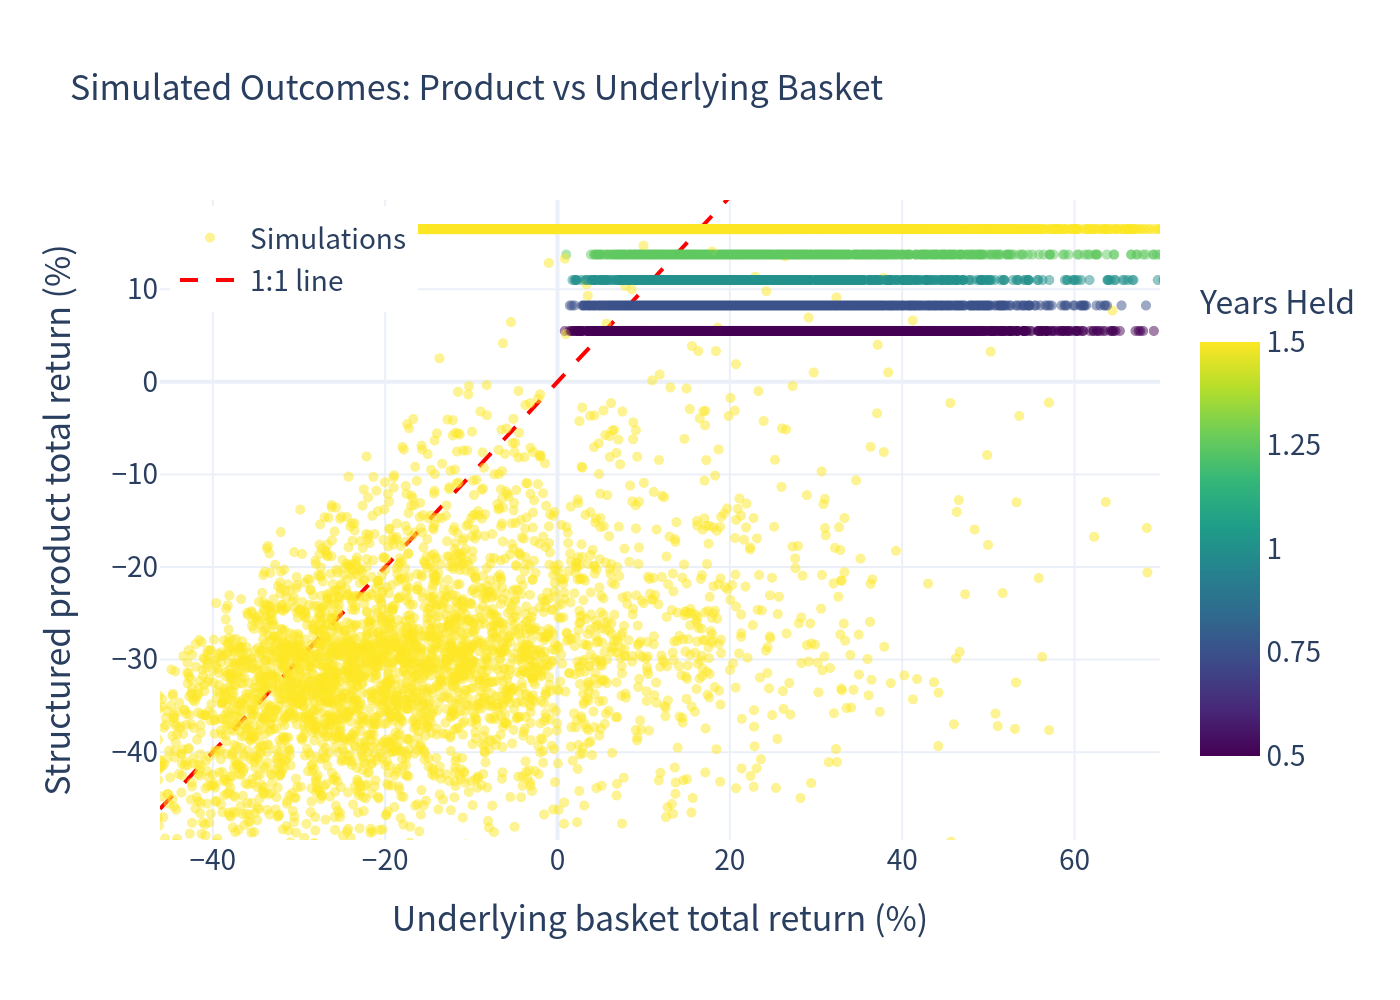
Simulation outcomes (product vs underlying)
Each point is one simulation. The note hugs a band of fixed coupon outcomes and drops into losses once the barrier is breached.
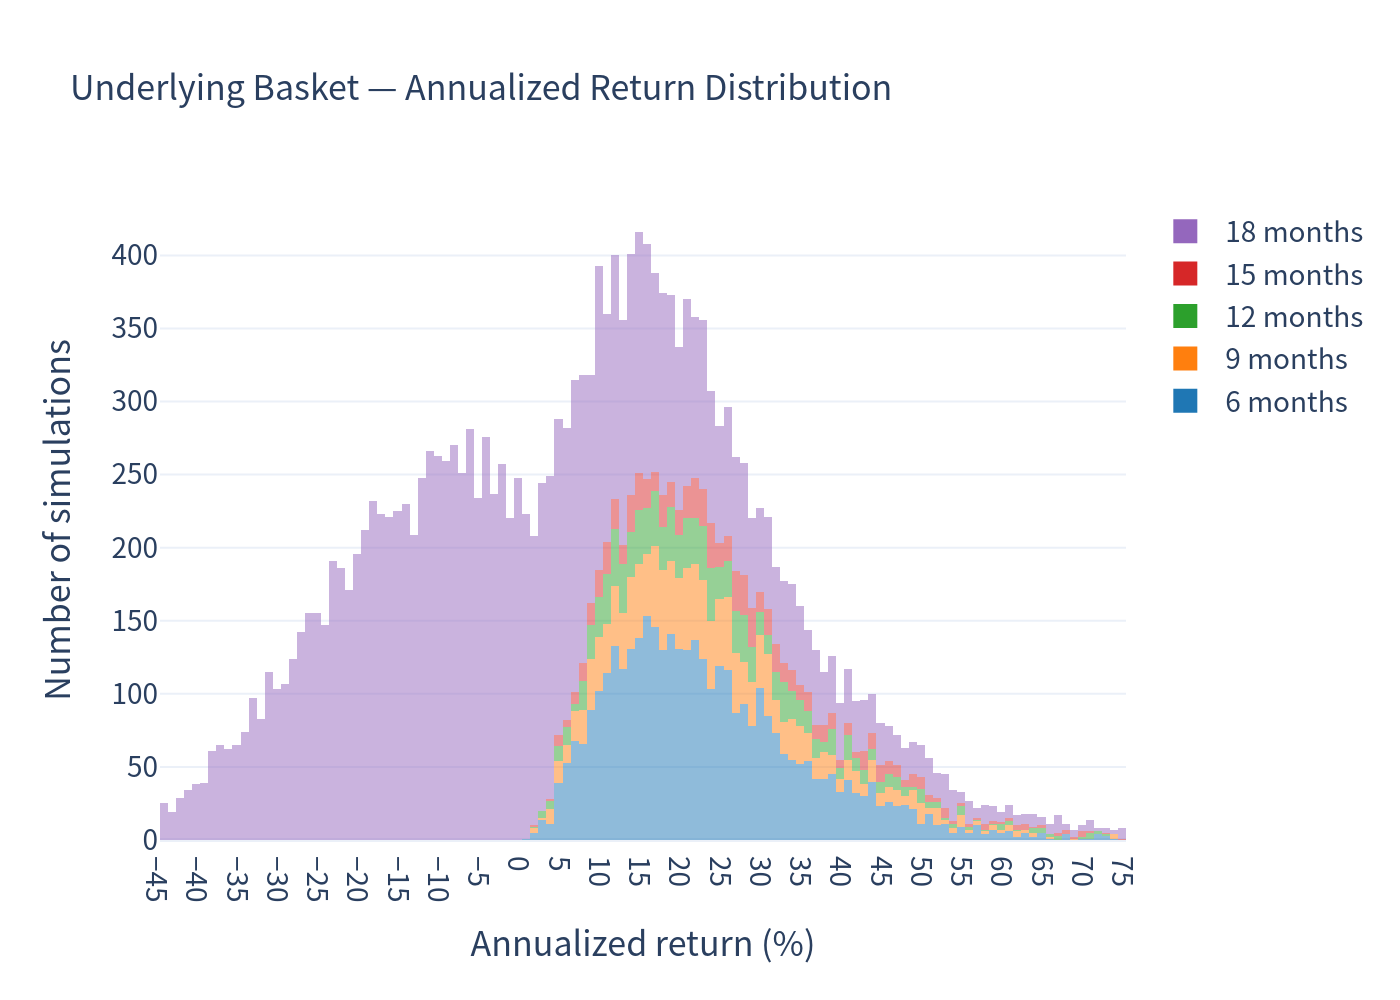
Annualized return distributions
Distribution of simulated annualized returns for the underlying equal-weight basket.
Distribution of simulated annualized returns for the structured product.
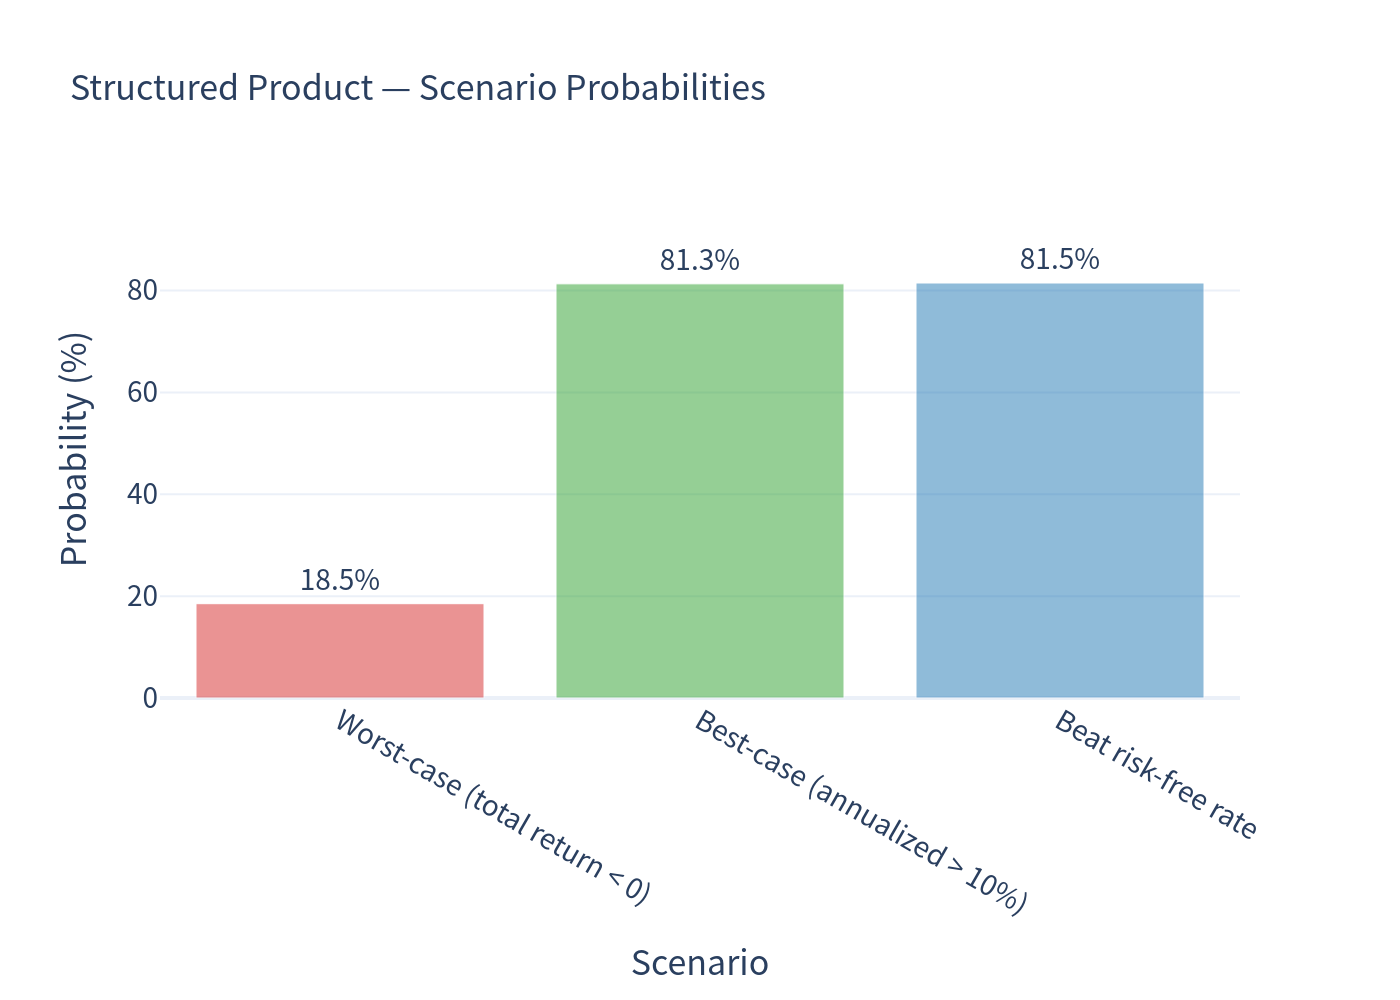
Scenario probabilities
Probability of each terminal scenario, from full coupon-and-par redemption to capital impairment.
Risk vs return
Expected annualized return plotted against expected annualized volatility.
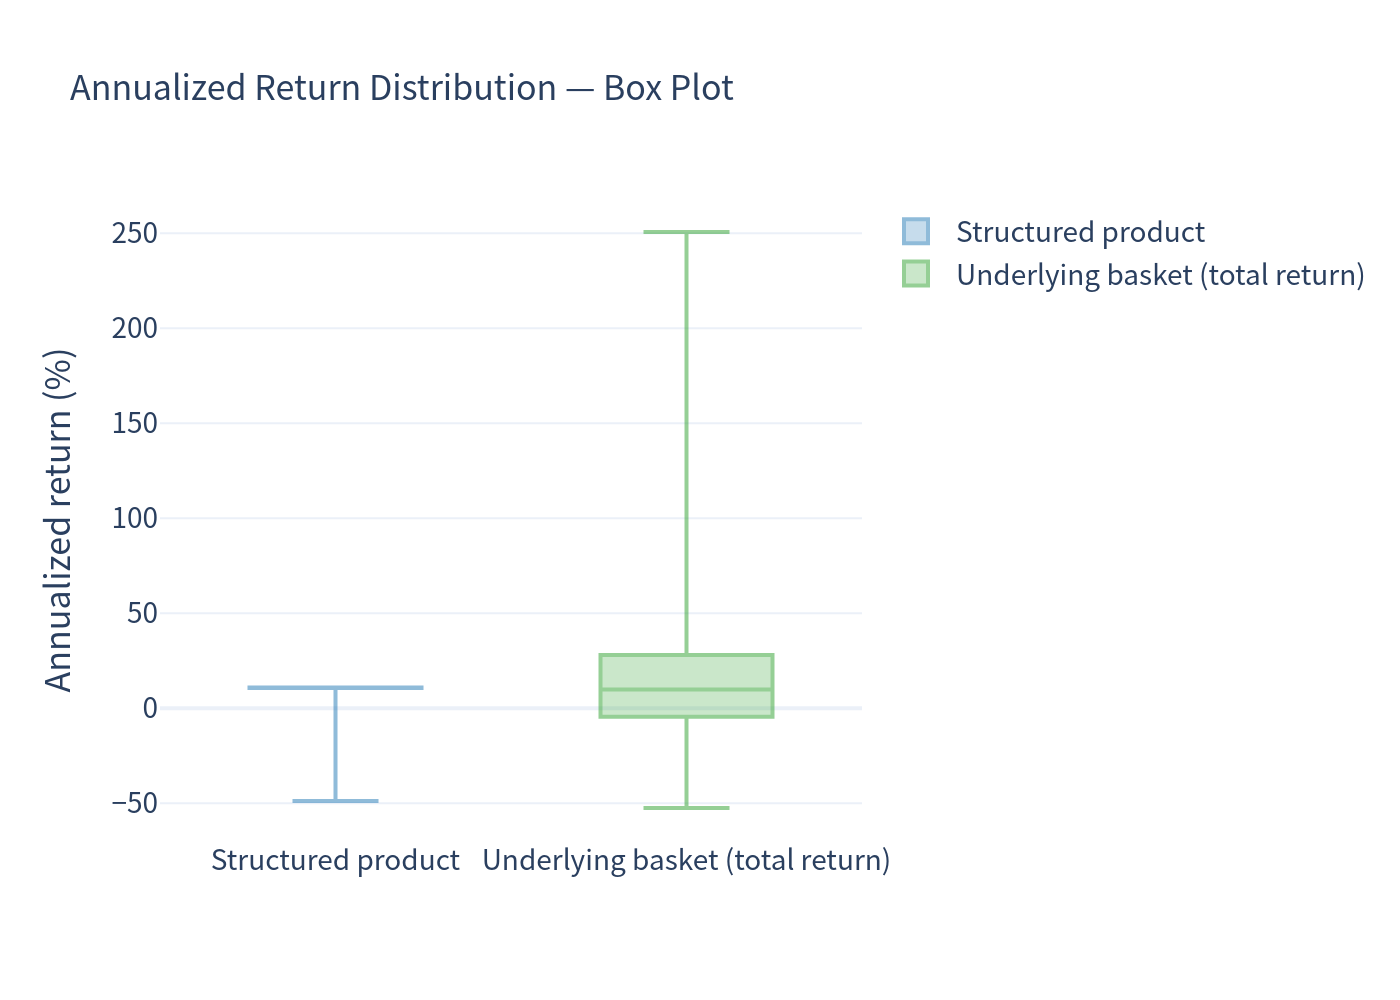
Return distribution — box plot
Quartiles and tails of the simulated annualized return distribution.
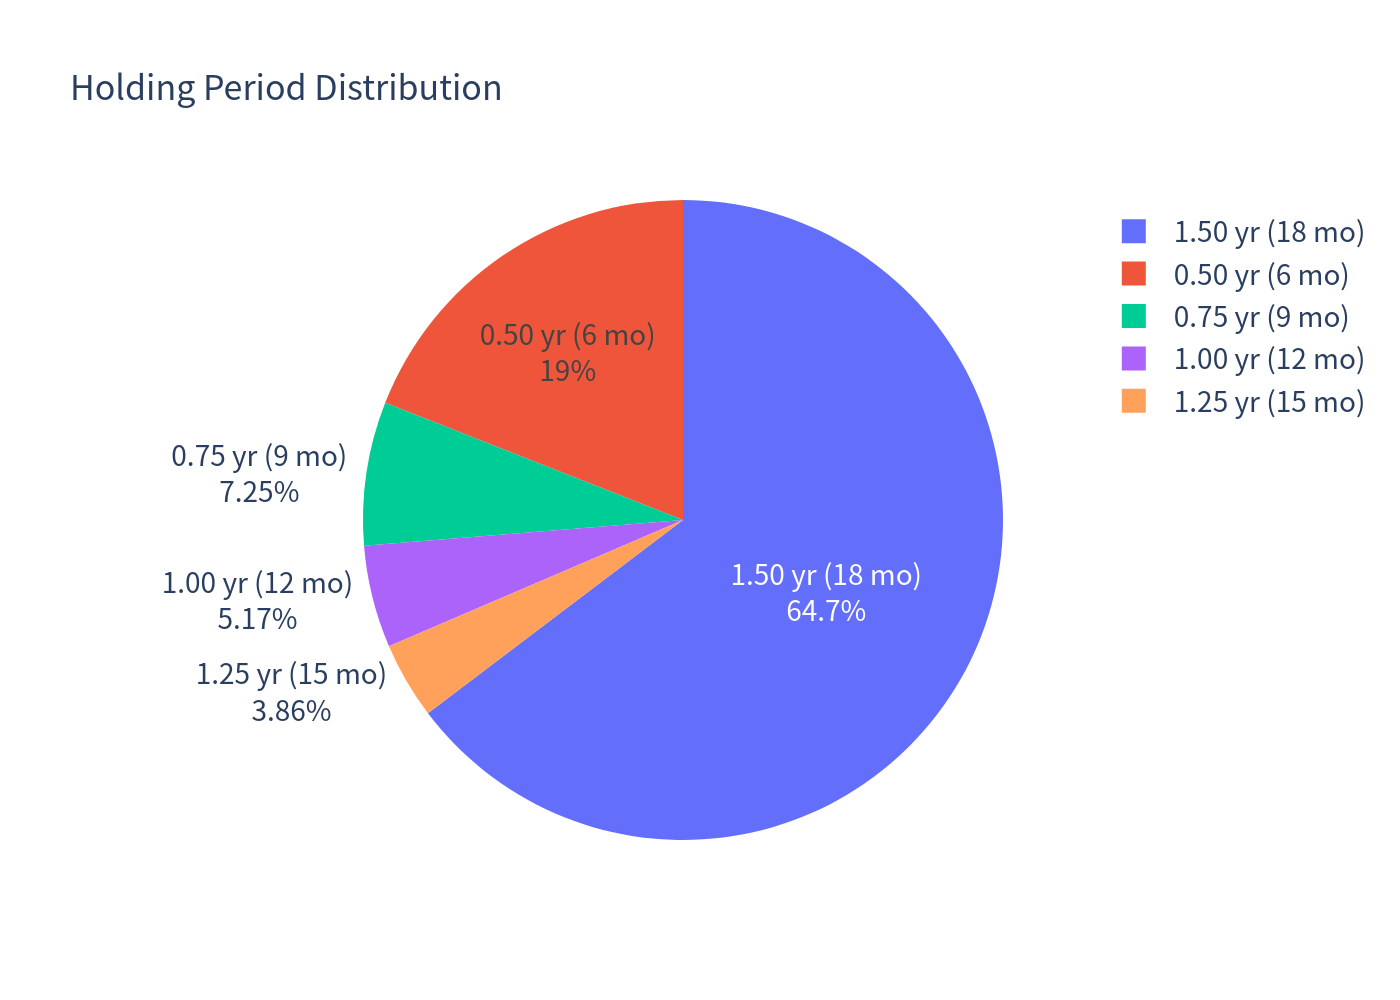
Holding period and coupon counts
Distribution of realized holding periods (left) and number of coupons received (right).
Number of quarterly coupons paid over the life of the note.
Investment commentary
Points to be aware of
- Upside is fully capped. The best possible outcome is par plus the coupon stream; you give up any participation in the strong rally that the underlying shares can produce.
- Worst-of barrier and worst-of tail. The barrier is breached by any single share dropping to 55%, and once breached the payout is driven by the worst of three shares and is unprotected — the 1-year VaR (−33.97%) is deeper than that of a diversified equal-weight basket (−27.49%).
- Low expected return versus the underlying. The note's expected annualized return (4.76%) sits well below the basket's, because the coupon income is offset by the occasional deep capital loss and by the issuer cutting the coupon stream short when the shares rally.
- Callability. In about 35% of paths the issuer calls the note early (most often after 6 months, 19% of paths), truncating the coupon payments exactly when continuation would have been most favourable.
Figures are simulation outputs and are shown in percentage terms to two decimal places. This document is an analysis of the described terms and is not financial advice or a suitability assessment.
Points in favour