
SX5E Market-Linked Notes due April 3, 2031 — Simulation Report
Headline Simulation Results
Using 10,000 Monte Carlo simulations of the EURO STOXX 50 Index (SX5E) over the full 5-year term (March 31, 2026 → April 3, 2031):
| Metric | Value |
|---|---|
| Expected annualized return | 10.27% |
| Probability of negative return | 0.00% |
| 99% confidence VaR (1 year) | 0.00% |
| Expected total return over the (always 5-year) holding period | 71.39% |
| Probability of outperforming the risk-free rate (3.72%) | 74.50% |
The value-at-risk figure is the 1st percentile of the per-simulation annualized return to maturity. Because every path is held to the maturity date and the notes are fully principal-protected, no path ever realizes a negative return — the worst case is return of principal (a 0.00% total return). Hence the probability of a negative return and the 1-year 99% VaR are both 0.00% at maturity.
Note that the expected total return (71.39%) and the expected annualized return (10.27%) are separate statistics: the former is the mean of per-simulation cumulative returns, the latter is the mean of per-simulation annualized (compound) returns, so the two are not related by a simple 5-year compounding of one another.
Product Overview
- Issuer: Morgan Stanley Finance LLC (guaranteed by Morgan Stanley)
- Underlier: EURO STOXX 50® Index (SX5E) — a single index, not a basket
- Structure: Principal-Protected Note (PPN), no coupon
- Term: 5 years (issue March 31, 2026; maturity April 3, 2031)
- Participation rate: 115% (term sheet range 115%–125%; the illustrative table and this analysis use 115%)
- Principal protection: 100% (payment at maturity is never below par)
- Upside cap: None (uncapped participation)
- Coupon / early redemption / barrier: none
- CUSIP: 61781EBW5
How it works (plain language)
At maturity the note pays back at least the amount invested ($1,000 per note). If the index finishes above its starting level, the investor receives the principal plus 115% of the index's percentage gain — with no cap. If the index finishes at or below its starting level, the investor simply receives the principal back and protects against the downside entirely. The trade-off for that protection is that the note pays no dividends, which shows up as a slightly lower expected return than owning the index outright (about 10.27% vs 11.00% annualized in total-return terms).
Key Statistics
| Metric | Structured Product | Underlying (SX5E total return) |
|---|---|---|
| Expected annualized return | 10.27% | 11.00% |
| Expected annualized volatility | 7.76% | 8.28% |
| Probability of loss (over the term) | 0.00% | 9.52% |
| 99% confidence VaR (1 year) | 0.00% | -9.31% |
“Annualized volatility” here is the standard deviation of the per-simulation annualized returns (i.e., the dispersion of compound annual returns), not the index's instantaneous annual price volatility (~21.7%). The loss probability is measured over the full (5-year) holding period for both columns, so the comparison is like-for-like.
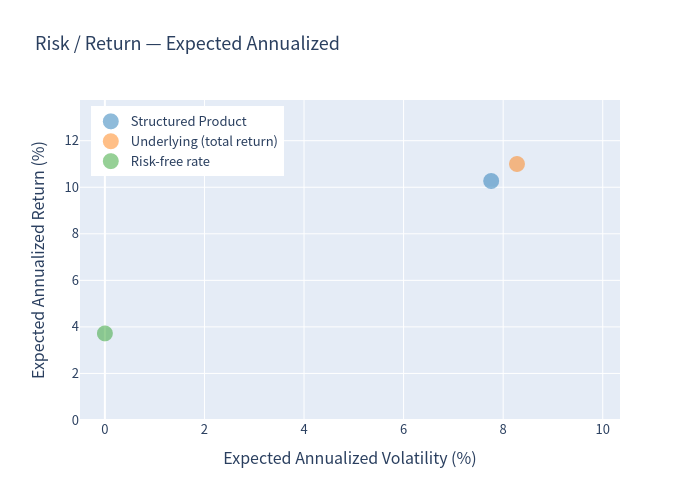
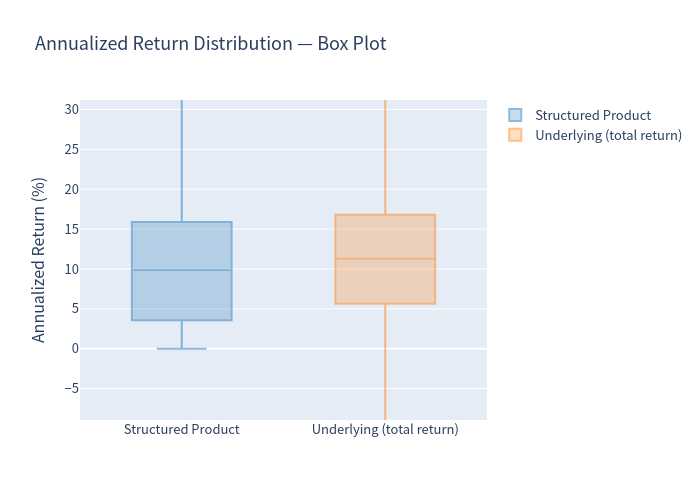
The structured product cut the annualized volatility from 8.28% to 7.76% and removed the term downside entirely (loss probability 0.00% vs 9.52%), at the cost of roughly 0.73 percentage points of expected annualized return relative to holding the index with dividends.
Charts
Simulated outcomes — product vs underlying
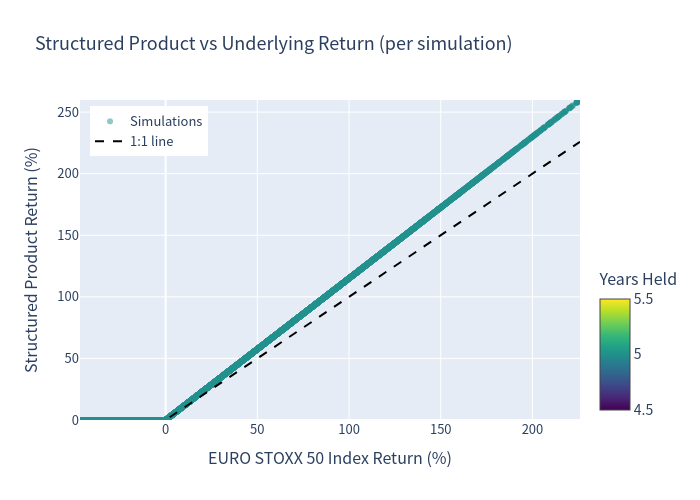
Each point is one simulation; the dashed line is the 1:1 line. All points sit on or above the 1:1 line (every down scenario maps to par), and the product's upside is amplified by the 115% participation.
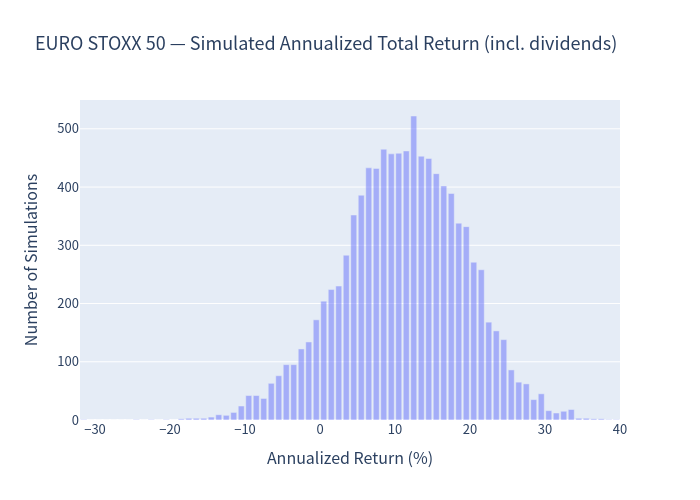
Annualized return distribution — underlying
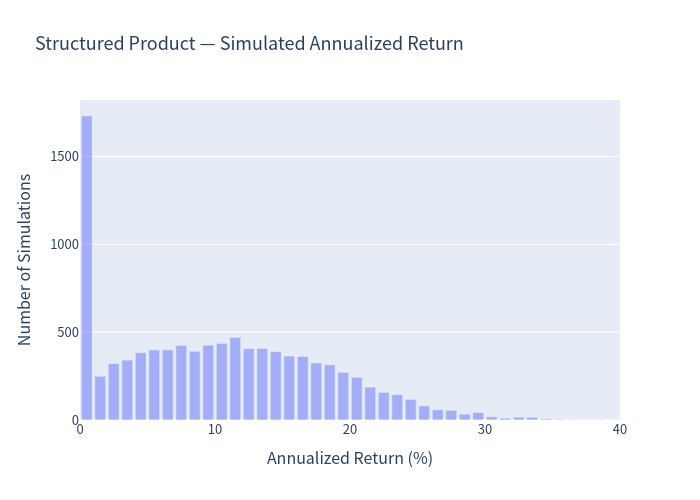
Annualized return distribution — structured product
The distribution is truncated at 0% (protection floor) with a mass point at par (about 15% of simulations).
Risk / return
Box plot comparison
Scenario probabilities
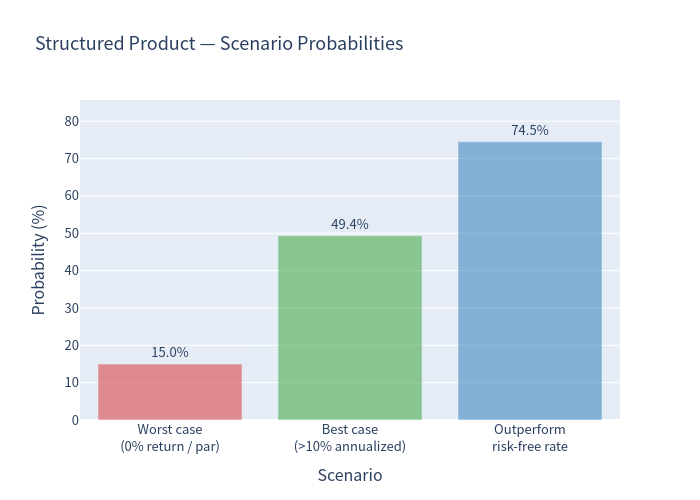
- Worst case (return of principal, 0% return): 14.97% of simulations
- Best case (>10% annualized): 49.36% of simulations
- Outperform the risk-free rate (3.72%): 74.50% of simulations
Investment Commentary
Points in favor
- Hard downside protection. Principal is returned in every simulated path; the loss probability and 1-year VaR are both 0.00%.
- Leveraged, uncapped upside. The 115% participation rate means the note captures more than the index's gain (e.g., a +20% index move returns +23%).
- Frequent outperformance of cash. In 74.50% of simulations the note beat the 3.72% risk-free rate, and it reached double-digit annualized returns in 49.36% of paths.
- Lower realized dispersion of annualized returns than the underlying (7.76% vs 8.28%).
Points to note
- Expected return sits just below the index total return (10.27% vs 11.00%) because the note forgoes dividends and the participation applies to price return only.
- Return depends on a single observation date (March 31, 2031); interim levels do not matter.
- Credit exposure to the issuer/guarantor (Morgan Stanley), and the notes are not exchange-listed.