
info@tokenengine.ai
Structured Product Evaluation
1. Headline Simulation Results
| Metric | Value |
|---|---|
| Expected annualized return | 12.57% |
| Expected total return over the realized holding period | 9.44% |
| Expected holding period | ~9.2 months (0.77 years) |
| Probability of a negative return | 0.33% |
| 99% confidence VaR (1-year, 1st percentile of annualized return) | +10.37% |
| Probability of outperforming the risk-free rate (3.73%) | 99.59% |
| Probability of automatic early redemption before maturity | 98.05% |
Because the securities are called early in the overwhelming majority of simulated paths, the holding period is short (median ≈ 6 months). Annualized figures therefore look elevated relative to realized total returns and must be read together with the short holding period. In total-return terms the product is expected to pay ~9.4% over a typical ~9-month holding period, corresponding to roughly the stated coupon rate on an annualized basis.
2. Product Overview
| Item | Detail |
|---|---|
| Issuer / Guarantor | Morgan Stanley Finance LLC / Morgan Stanley |
| Underlier | S&P 500 Futures 40% Intraday 4% Decrement VT Index (single index; modelled via the S&P 500 as observable proxy) |
| Term | ~5 years (May 2026 → May 2031) |
| Contingent coupon (memory) | 12.25%–13.25% p.a. (12.75% midpoint modelled); paid monthly only if the index closes ≥ 60% of its initial level |
| Coupon barrier | 60% of initial level |
| Downside threshold | 60% of initial level |
| Automatic early redemption ("autocall") | Monthly from month 6; if the index ≥ 100% of its initial level → par + coupon |
| Principal protection | None below the 60% threshold — 1% loss per 1% decline |
How it works (plain English)
- You are paid a 12.75%-a-year coupon each month, but only for months in which the underlying index finishes at or above 60% of its starting level.
- If a coupon is missed (index below 60%), the memory feature lets you recover it later — but only once the index climbs back to 60% (missed coupons that are never recovered are lost).
- Once the index is back at or above 100% of its start, the note is automatically redeemed: you get your $1,000 back plus all coupons owed.
- If the note is never called and the index ends below 60%, you take the full downside — a 1% loss for every 1% the index fell, with no coupons. This is the source of the tail risk.
3. Key Statistics (annualized)
| Metric | Structured product | Underlying (S&P 500 total return) | Risk-free |
|---|---|---|---|
| Expected annualized return | 12.57% | 15.09% | 3.73% |
| Expected annualized volatility | 1.19% | 12.72% | 0.00% |
| Probability of loss | 0.33% | 1.81% | — |
| 99% confidence VaR (1 year) | +10.37% | −4.21% | — |
The product displays a much lower expected volatility than the underlying (1.19% vs 12.72%) because the payoff is capped at the coupon and is called early — but this understates the tail risk: in the ~2% of paths that reach maturity, outcomes can be strongly negative (the worst 0.1% of scenarios lost ~30% of capital; the single worst path lost ~78%).
4. Simulation Charts
4.1 Simulation outcomes — product vs underlying (1:1 line)
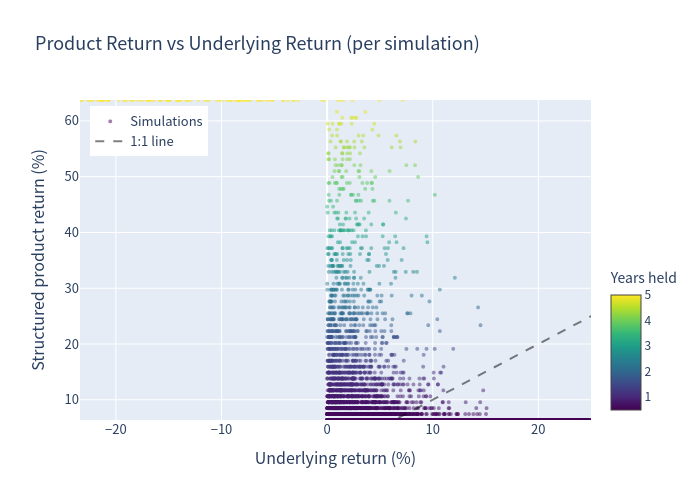
Most points sit in a tight band (product return ≈ a few % up to the coupon), while the underlying spreads widely. The product gives up the right tail (upside is capped) — its returns sit below the 1:1 line when the index rallies strongly, and above it when the index falls modestly (coupon + par cushion).
4.2 Annualized-return histograms (stacked by holding period)
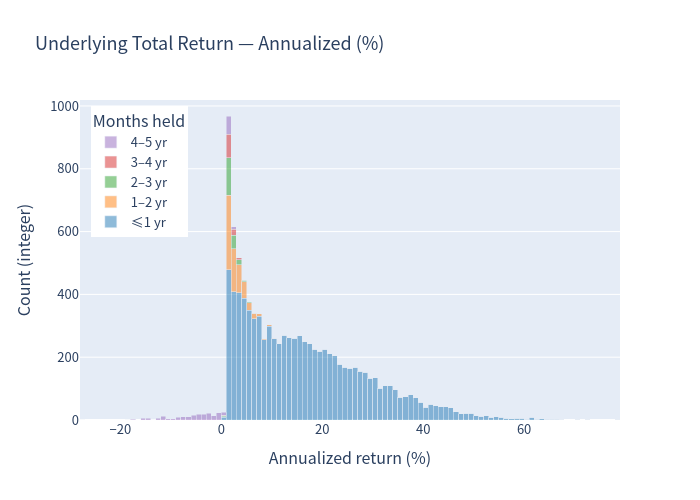
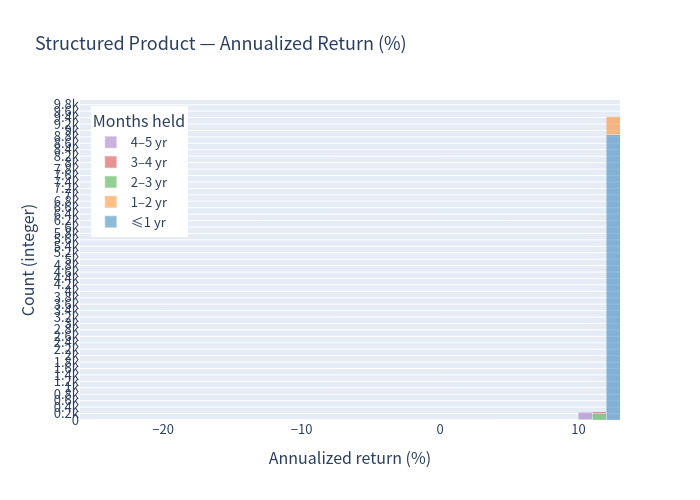
The underlying has a wide, fat-tailed distribution peaked near its drift. The product is instead sharply peaked at ~12.75% — the coupon rate — with a small left tail of loss scenarios (the paths that run to maturity and breach the 60% barrier).
4.3 Risk / return
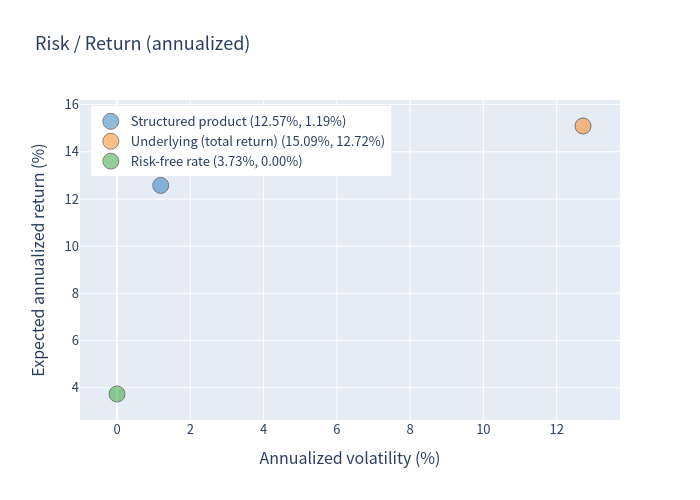
The product sits far to the left of the underlying (much lower volatility) at a slightly lower expected return. It offers an expected return well above the risk-free rate.
4.4 Annualized-return box plot
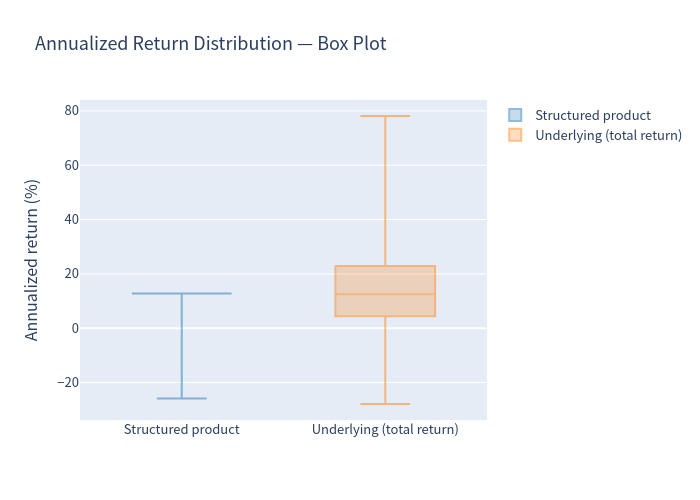
The product's box is compressed near the coupon with a long downside whisker; the underlying shows a much wider dispersion.
4.5 Scenario probabilities
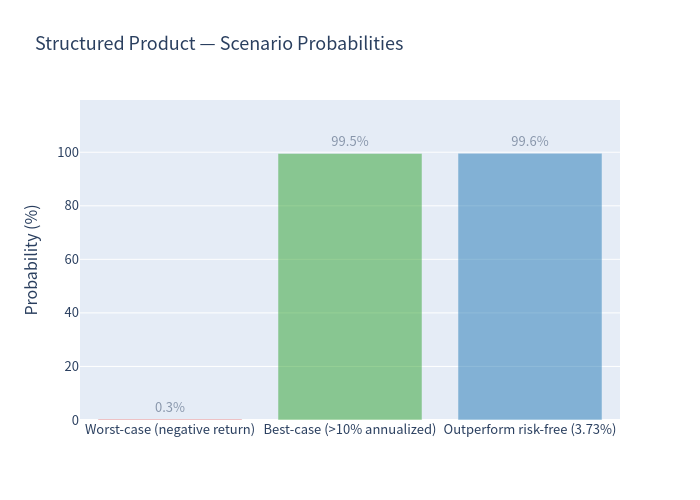
| Scenario | Probability |
|---|---|
| Worst-case — negative annualized return | 0.33% |
| Best-case — > 10% annualized return | 99.54% |
| Outperforms the risk-free rate (3.73%) | 99.59% |
4.6 Holding period and coupon-count distributions
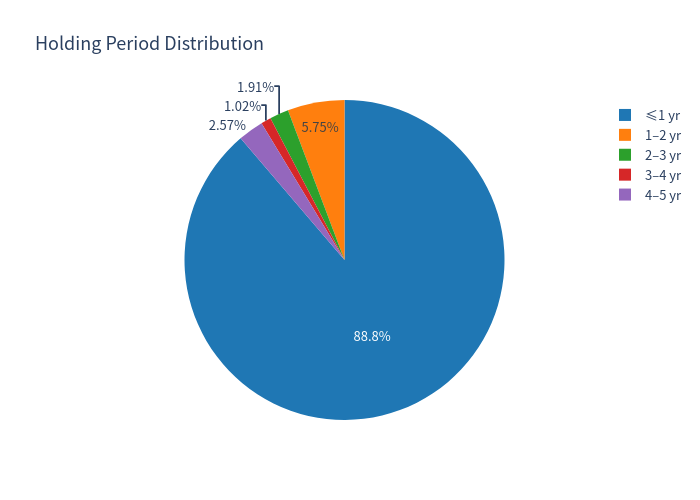
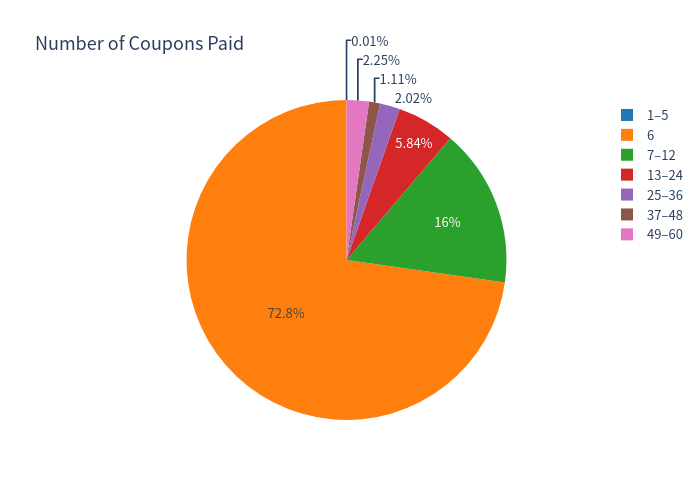
Roughly 89% of paths are called within the first year (the first call opportunity is month 6), so most investors would receive about 6 monthly coupons before the note is redeemed. Only ~1.95% of paths run all the way to the 5-year maturity (a further ~0.6% are held beyond 4 years).
5. Investment Commentary
Advantages
- High headline coupon (12.25%–13.25%). For the typical scenario the product pays ~9% over ~9 months — well above money-market / risk-free returns.
- Memory feature recovers skipped coupons if the index later returns to 60%, improving robustness to temporary dips.
- Frequent, low-stress autocall. With the call set at-the-money, the note is redeemed early in ~98% of paths, returning capital quickly.
- Par protection as long as the final level is ≥ 60% of the initial level — the index can fall up to 40% by maturity without principal loss.
Considerations / drawbacks
- Capped upside. Investors never participate in index appreciation above the coupon; in rising markets the product materially lags a direct index investment (expected ~12.6% vs ~15.1% for the underlying).
- Reinvestment risk. Because the note is called early in ~98% of scenarios, the coupon stream is short-lived and the proceeds must be reinvested at whatever rates then prevail.
- Fat left tail. Although the loss probability is small (0.33%), when the index breaches 60% at maturity the principal loss is 1:1 on the downside (only partly offset by coupons already collected), so tail losses can be substantial relative to the product's low "expected" volatility — the worst simulated outcome was ≈ −78%, and the worst 0.1% of paths averaged ≈ −30%.
- Issuer credit risk. All payments depend on Morgan Stanley / MSFL.
- Structural drag (caveat). The actual underlier is a decrement/futures index that carries a fixed ~4%/year decrement (plus futures carry). This structural drag, which is not captured by the S&P 500 proxy used here, would reduce expected growth, raise the probability of coupon misses and of breaching the 60% barrier, and lower all return figures reported above.
6. Key Assumptions
- Underlier modelled with the S&P 500 as the observable price-index proxy (decrement drag not modelled — see caveat).
- Coupon rate = 12.75% (midpoint of the 12.25%–13.25% range).
- Downside threshold = 60% (assumed equal to the stated coupon barrier).
- Coupons/observations monthly from issue; autocall determinations monthly from month 6 (inferred from the term sheet's redemption-determination schedule).
- Annualized returns use geometric compounding for holding periods ≥ 12 months and proportional scaling for periods < 12 months.
- Dividend yield (0.98%) added to the underlying (without compounding) for total-return comparison.
- Fees, commissions and issuer credit effects are excluded from the payoff.