
7.20% p.a. Multi Barrier Reverse Convertible — Simulation Analysis
| Metric | Structured Product | Underlying Basket (incl. dividends) |
|---|---|---|
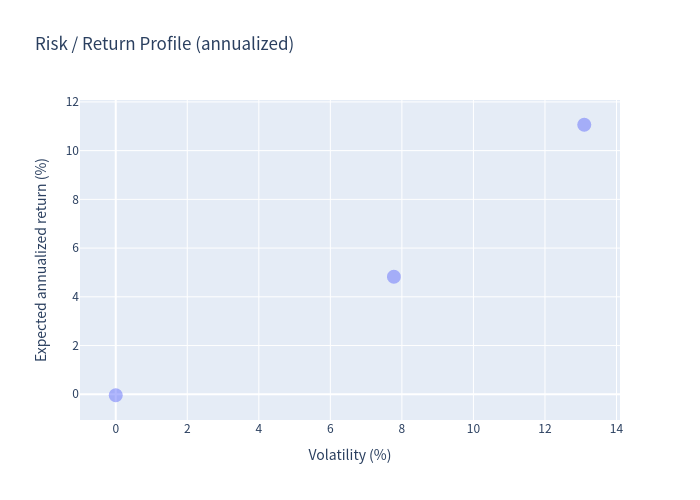
| Expected annualized return | 4.82% | 11.06% |
| Expected total return (realized holding period) | 7.96% | 10.08% (price only) |
| Expected annualized volatility | 7.78% | 13.10% |
| Probability of negative return | 7.99% | 28.39% |
| 99% confidence VaR (1 year) | −28.64% | −14.41% |
| Expected holding period | 20.1 months | — |
- The product returned a positive outcome in ~92% of simulations and outperformed the risk-free rate in ~92% of scenarios.
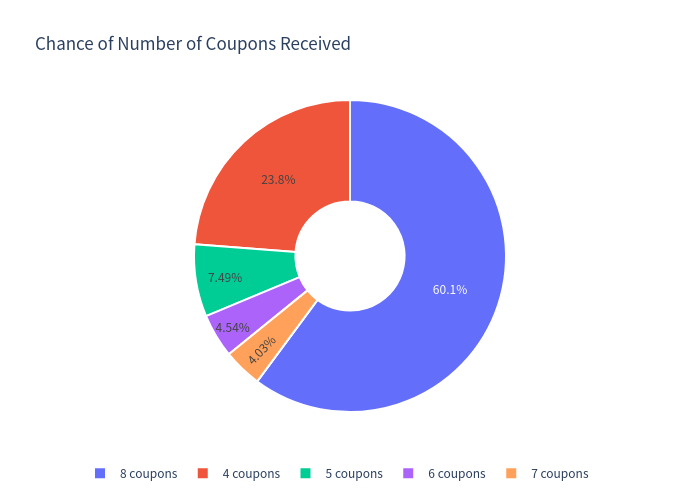
- Median total return was 14.40% (the full coupon stream of 8 × 1.8% + par is the most common outcome, achieved in ~52% of simulations).
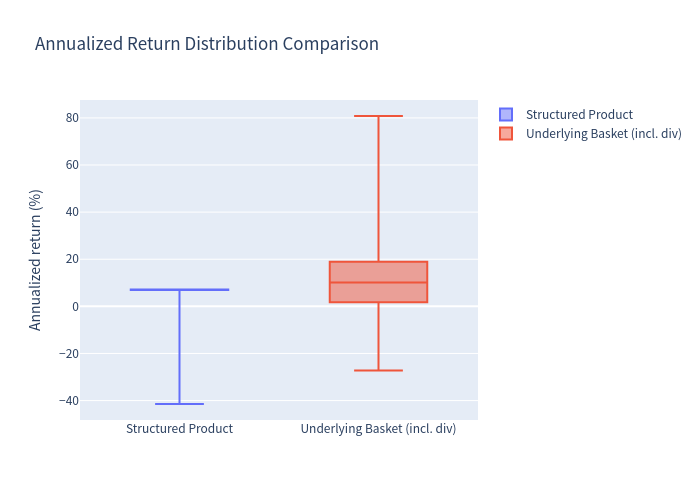
- The benchmark (equal-weight basket of the four underlyings) delivered a higher expected return but with materially higher volatility and a much higher probability of loss. The structured product, by contrast, has a more extreme left tail once the barrier is breached, because its downside is concentrated in the single worst-performing stock (99% VaR −28.64% vs −14.41% for the basket).
How it works
This is a reverse convertible bond on four Swiss blue-chip stocks. The investor pays 100% upfront (CHF 1,000 per product) and receives a fixed coupon of 7.20% p.a., paid quarterly (1.8% every 3 months, 8 payments over the 2-year life), regardless of how the stocks perform.
At maturity (if not called earlier) there are two main branches:
- No barrier event — as long as none of the four stocks ever trades at or below 49% of its initial level during the observation period, the investor gets back 100% of the capital (par). Total return = coupons + par = up to 14.4%.
-
Barrier event occurred — if at any time at least one of the stocks trades at/below 49% of its initial level:
- If the worst-performing stock at maturity is below 100% of its initial level, the investor receives that (worst) stock instead of cash — i.e. capital loss equal to the drop in that stock.
- If the worst-performing stock is at or above 100%, the investor still receives par (100%).
Additionally, the issuer may call (redeem) the product early at quarterly dates after the first year (Aug 2027, Nov 2027, Feb 2028, May 2028). If called, the investor receives par + the coupon due on that date and no further payments.
In short: the investor sells a deep out-of-the-money worst-of put option (strike 100%, barrier 49%) on the four stocks in exchange for a high fixed coupon. Upside is capped at the coupon stream; the main risk is a severe fall in any one of the four names below the barrier, which converts the product into the worst-performing stock.
Structured Product (per simulation, holding period 12–24 months)
| Statistic | Value |
|---|---|
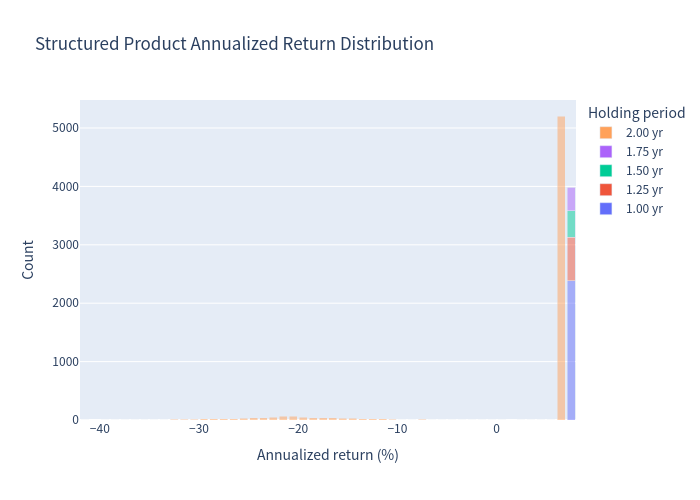
| Expected annualized return | 4.82% |
| Expected annualized volatility | 7.78% |
| Expected total return over realized holding period | 7.96% |
| Median total return | 14.40% |
| Probability of negative return | 7.99% |
| 99% VaR (1-year, annualized) | −28.64% |
| Expected number of coupons received | 6.7 (of 8) |
| Expected coupon income | 12.05 index points |
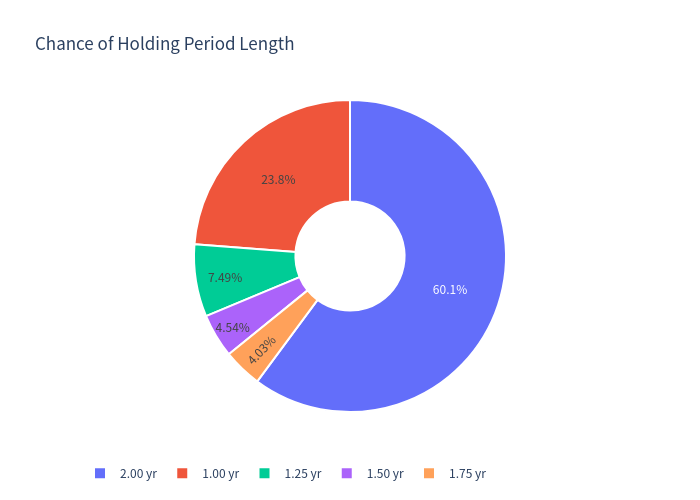
Holding period distribution
| Holding period | Share of simulations |
|---|---|
| 12 months (called) | 23.8% |
| 15 months (called) | 7.5% |
| 18 months (called) | 4.5% |
| 21 months (called) | 4.0% |
| 24 months (maturity) | 60.1% |
Underlying basket (equal weight, incl. ~2.86% average dividend yield)
| Statistic | Value |
|---|---|
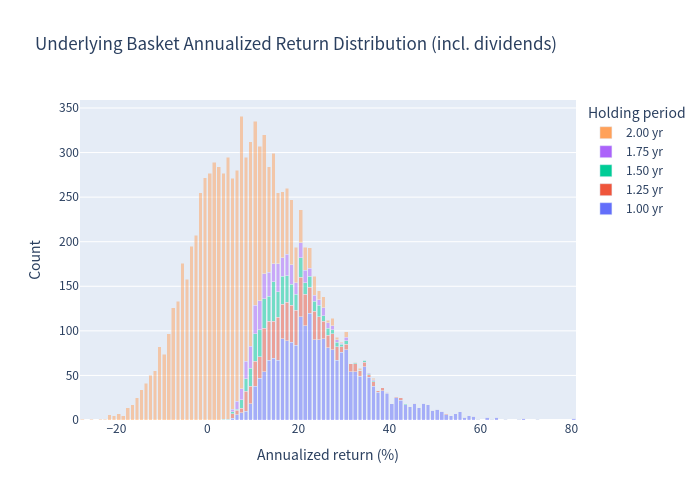
| Expected annualized return | 11.06% |
| Expected annualized volatility | 13.10% |
| Probability of negative return | 28.39% |
| 99% VaR (1-year, annualized) | −14.41% |
Simulation outcomes: product vs underlying basket
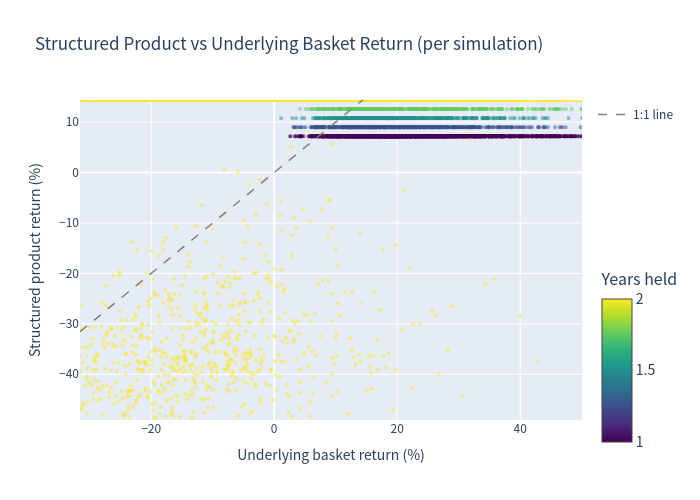
Each point is one simulation (10,000 total); colour shows how long the product was held. The dashed 1:1 line is shown for reference. Returns cluster at the coupon-driven levels; losses occur only when the barrier is breached and the worst stock finishes below its strike.
Annualized return distributions (1% bins, stacked by holding period)
Underlying basket (incl. dividends):
Structured product:
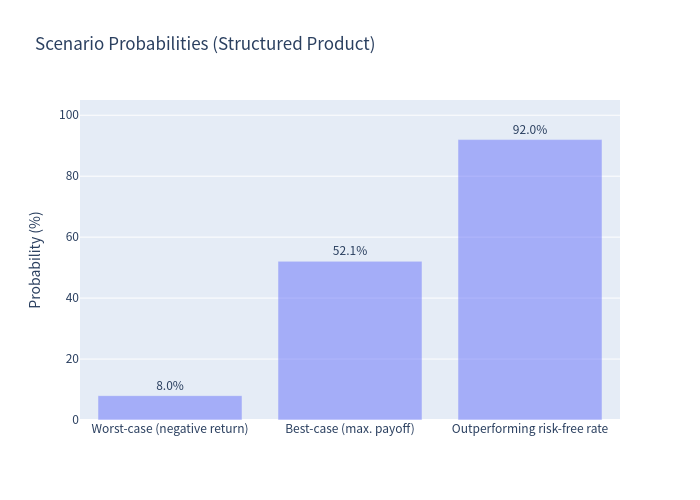
Scenario probabilities
- Worst case (negative return): 7.99%
- Best case (maximum payoff — full coupon stream + par, 14.4% total): 52.06%
- Outperforming the risk-free rate: 92.01%
Risk / return profile
The product sits at a lower return / lower risk point than the underlying basket, consistent with its capped-coupon, partially-protected profile.
Annualized return comparison (box plot)
Holding period and coupon outcomes
Key observations
- High probability of positive outcome: coupons are paid in all scenarios while the product is alive, and the principal is returned in full (par) in ~92% of simulations — whenever no barrier breach occurs, or the worst stock still finishes at/above its strike, or the issuer calls the product early. Overall, ~92% of simulations end with a positive return.
- Capped upside: the maximum total return is 14.4% (≈7% p.a.), which compares favourably with the ~0% Swiss risk-free rate but is well below the upside of holding the stocks directly.
- Tail risk is concentrated in the worst stock: the 49% barrier means downside protection is only "triggered", not cushioned — a single stock trading at or below 49% of its initial level is enough to trigger the barrier. Once breached, the investor is exposed to the full fall of the worst-performing underlying at maturity. This shows up in the product's 99% VaR (−28.64%) being more extreme than the diversified basket's (−14.41%), despite the product's far lower loss frequency.
- Issuer call feature: ~40% of simulations are called early by the issuer (modelled as the issuer calling when the worst-of performance is at/above the strike). Early calls still deliver par + coupon, so they are not adverse for the investor in this model, but they cap how long the coupon is earned and shorten the average holding period.
- Diversification within the basket: although a single stock falling through the 49% barrier is sufficient to trigger the barrier, conversion at maturity depends on the worst-performing stock; the product's loss scenarios are therefore driven by severe single-name (or joint) collapses rather than broad market declines.