
Contingent Income Auto-Callable Securities — Simulation Analysis
Worst-of autocallable note linked to NDXT, RTY and SPX — Monte Carlo evaluation over a 10,000-path simulation
1. Headline simulation results
| Headline metric | Value |
|---|---|
| Expected annualized return (product) | 4.94% |
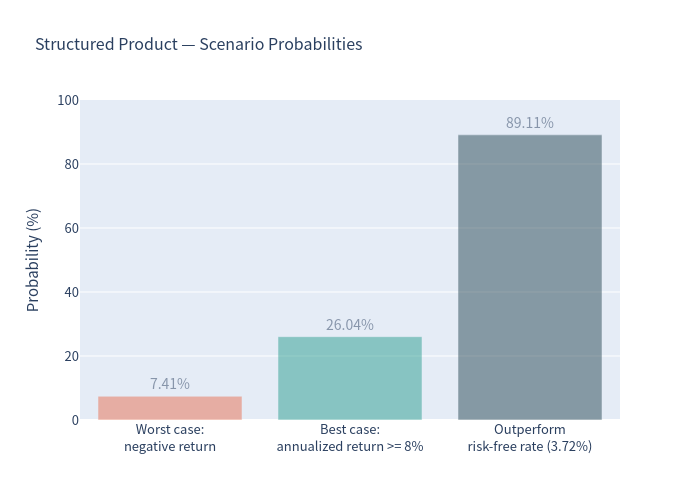
| Probability of a negative return | 7.41% |
| 99% confidence VaR (1-year) | −36.44% |
| Expected holding period | 10.17 months (0.85 yr) |
| Expected total return over the realized holding period | 2.76% |
| Probability of beating the risk-free rate (3.72%) | 89.11% |
| Probability of automatic early redemption ("autocall") | 73.90% |
The securities are designed to pay an above-market coupon while markets are stable-to-rising, but they cap the upside and pass the full downside of the worst-performing index to the investor if it finishes below 70% of its starting level.
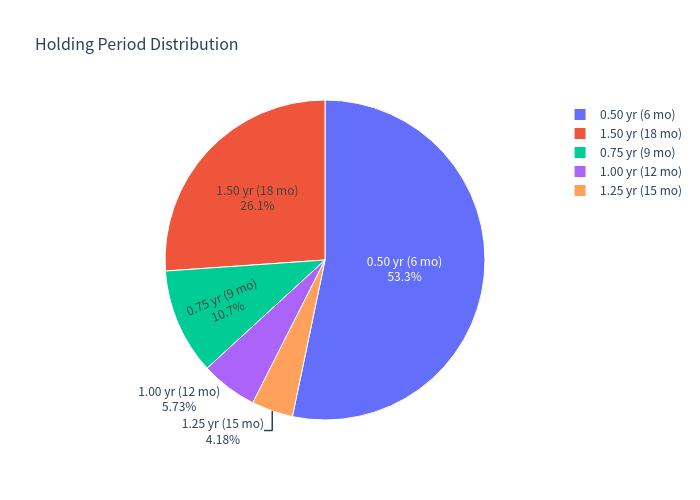
Because the note is frequently called early (74% of paths, most of them at the first call date), the average path lasts only about 10 months. Annualizing very short holding periods can look extreme, so the annualized figures should be read alongside the expected total return (2.76%) and the expected holding period (~10 months).
2. Basic product information — how it works
The note is a worst-of, contingent-coupon autocallable linked to three equity indices. In plain terms:
- Monthly income (conditional). On each monthly observation date you receive a coupon of 0.9167 points (11.00% p.a.) only if all three indices are at or above 80% of their starting level. If any index is below 80%, no coupon is paid for that period (and it is not made up later).
- Early redemption (automatic). Starting October 2026, on each quarterly call date the note is automatically redeemed if all three indices are at or above 100% of their starting level. You then receive your principal plus the current-period coupon, and the note ends.
- Maturity. If the note is never called and, at maturity, all three indices are at or above 70% of starting level, you get your principal back. The final coupon is paid only if all three indices are also at or above the 80% coupon barrier on the final observation date (principal protection at 70% and coupon entitlement at 80% are separate conditions).
- Downside. If any index finishes below 70%, you lose 1% for every 1% decline in the worst-performing index — the loss can be substantial.
Because the payoff depends on the worst of the three indices, gains in the stronger indices offer no protection: a single laggard drives the outcome.
3. Key statistics — product vs. underlying
The underlying benchmark is an equally weighted basket of the three indices. For a like-for-like comparison the basket return is shown on a total-return basis (dividends added to the price return); the three reference indices are price indices, so the dividend component is a modelling assumption (approximately +0.79% p.a.).
| Metric | Structured Product | Underlying Basket (Total Return) |
|---|---|---|
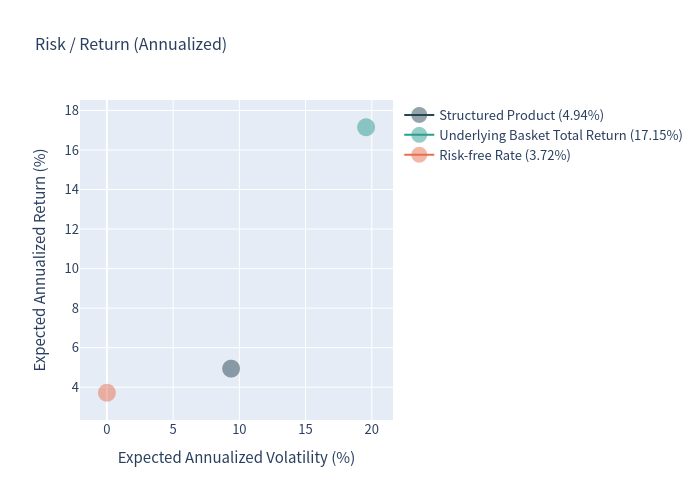
| Expected annualized return | 4.94% | 17.15% |
| Expected annualized volatility | 9.38% | 19.57% |
| Probability of loss | 7.41% | 17.63% |
| 99% VaR (1 year) | −36.44% | −27.08% |
Summary table
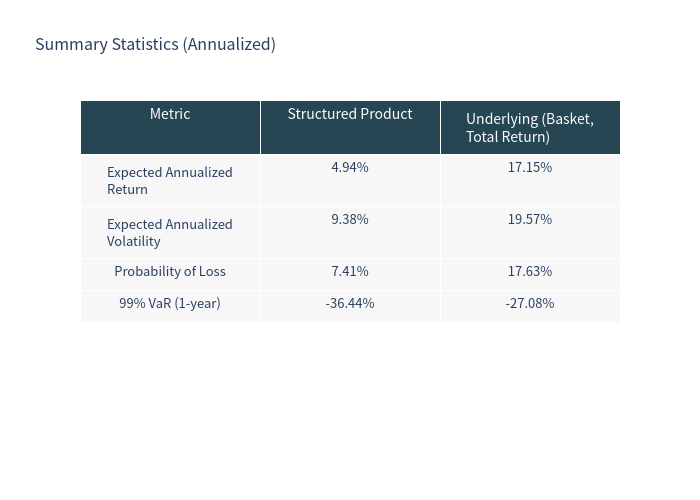
The product delivers roughly one-third of the benchmark's expected return with about half its volatility, and a materially lower probability of loss. However, it gives up the large majority of the benchmark's upside because the payoff is capped (principal + coupons only).
4. Simulation charts
Outcome scatter — product return vs. worst-of underlying return
Colour = years held.
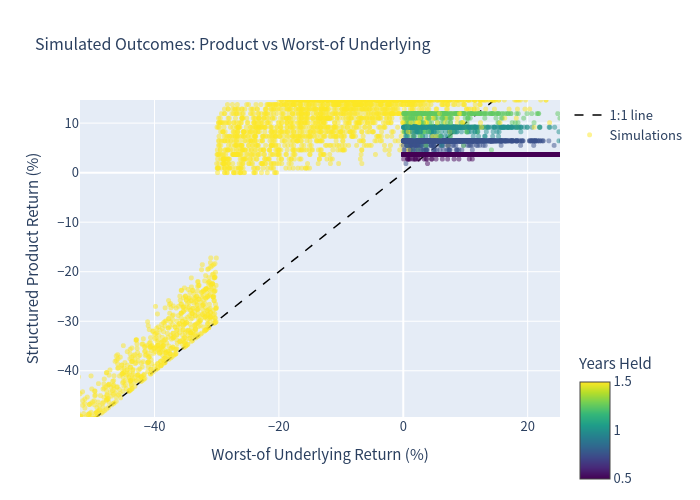
Most paths cluster in the upper-left region: the underlying has risen (positive x) while the product return is capped between about +3.7% (first call, 4 coupons) and +14.7% (full coupon run), depending on the call date. The lower-left cluster contains the 7% of paths that fall through the 70% barrier and take the worst-of downside.
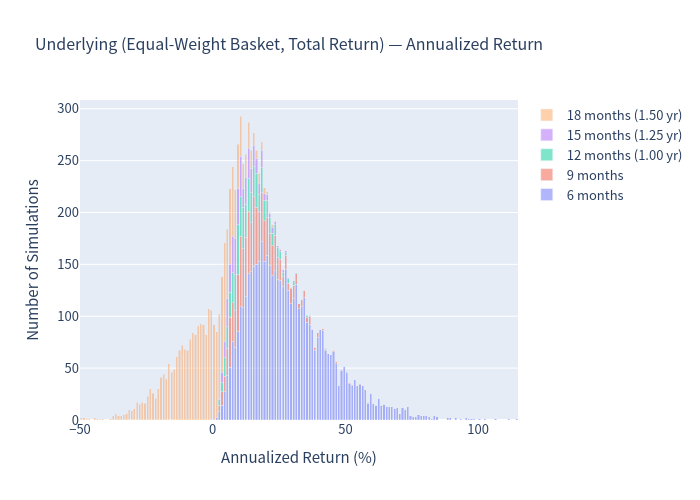
Annualized-return histogram — underlying basket (total return)
Annualized-return histogram — structured product
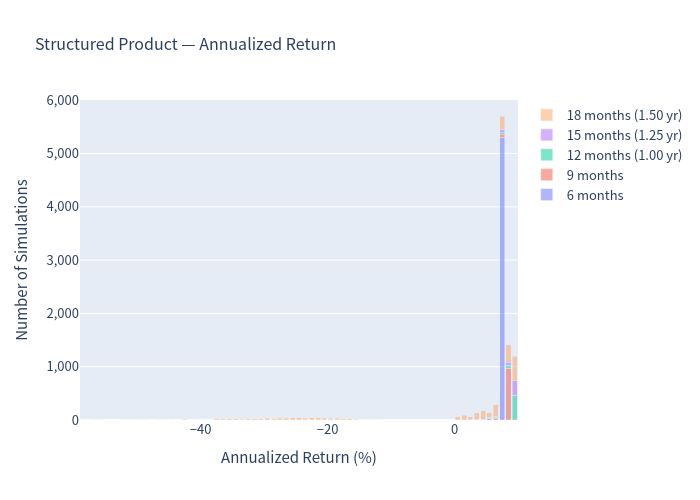
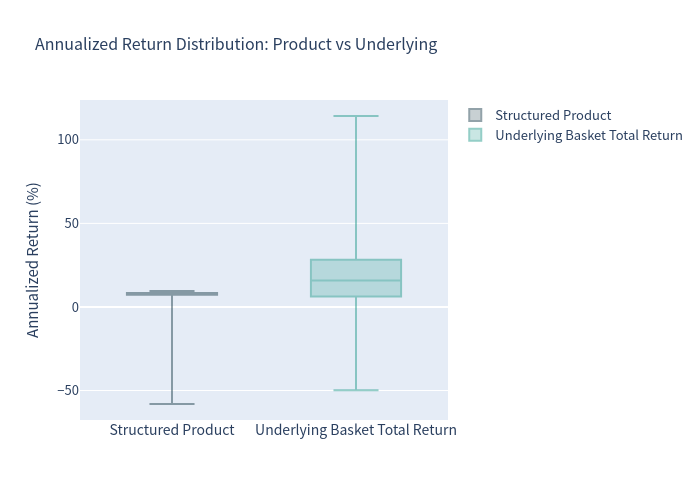
The product's distribution is tightly grouped around +4% to +9% annualized, with a distinct left tail of loss scenarios extending to about −58% annualized. The underlying histogram is far more dispersed, with a much heavier right tail that the capped product does not capture.
Scenario probabilities
Risk / return map (annualized)
Annualized-return box plot
Holding-period distribution
Number of coupons paid
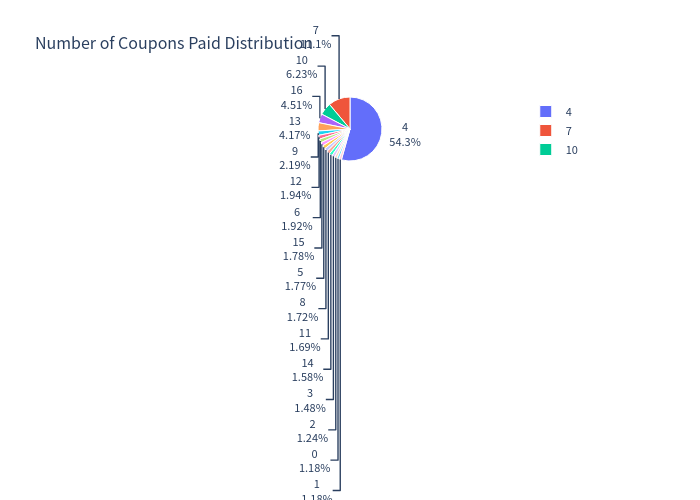
About 53% of paths are called at the first call date (roughly 4 coupons), while ~26% run to maturity; the coupon-count distribution is therefore concentrated at 4 and at 7–16 coupons.
5. Investment commentary
Potential positives
- Attractive headline coupon (11.00% p.a.) versus a ~3.72% risk-free rate — the note beats cash in about 89% of simulated scenarios.
- Real volatility reduction: expected annualized volatility of 9.38% versus 19.57% for the underlying basket, and a lower loss probability (7.41% vs 17.63%).
- Frequent early redemption (74% of paths) returns capital quickly, which shortens exposure to market risk.
- Soft protection: the 70% downside threshold means the note still returns par in all scenarios where the worst index stays above 70%, even if two of the three indices fall.
Potential negatives / risks
- Severe principal risk. If the worst index ends below 70%, losses track the worst index one-for-one; the 99% VaR is −36.44% and the deepest simulated loss is near −74% of principal.
- Capped upside. Even in strongly rising markets the note cannot earn more than principal plus accumulated coupons (maximum total return ≈ 14.67%); the same-horizon benchmark materially outperforms in up markets.
- Worst-of linkage. Tying the payoff to the weakest of three indices concentrates risk — a single weak index (e.g., a small-cap or tech-led sell-off) can trigger coupon losses and a maturity loss even if the others are flat or up.