NVDA Autocallable Certificate
Monte Carlo Simulation Analysis Report

Executive Summary
This report presents a comprehensive Monte Carlo simulation analysis of the SG Issuer NVDA Autocallable Certificates, a structured product linked to NVIDIA Corporation (NVDA) common stock. The simulation evaluates the risk-return characteristics of this autocallable certificate over its approximately 12-month term.
(Structured Product)
(Structured Product)
(Structured Product)
(Structured Product)
Key Findings Summary
| Metric | Structured Product | Underlying (NVDA) |
|---|---|---|
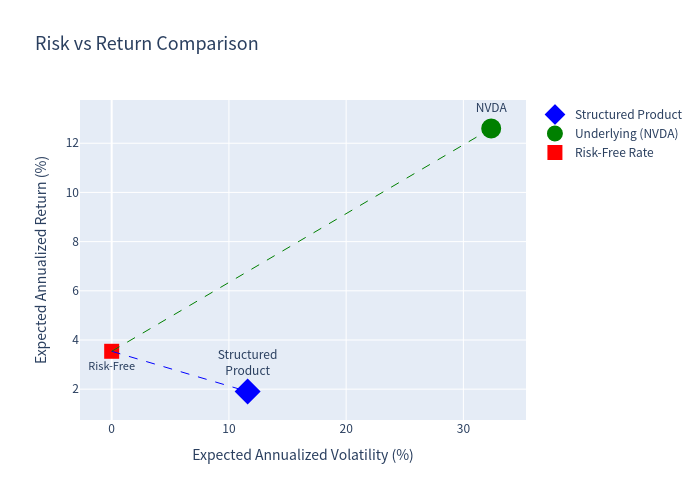
| Expected Annualized Return | 1.90% | 12.60% |
| Expected Annualized Volatility | 11.59% | 32.37% |
| Probability of Loss | 13.08% | 25.03% |
| 99% VaR (1-year) | -47.23% | -57.30% |
The structured product demonstrates lower volatility and lower probability of loss compared to holding the underlying NVDA stock directly. However, this comes at the cost of capped upside potential.
Product Overview
How It Works
The NVDA Autocallable Certificate is a structured product with the following key features:
- Quarterly Observations: The product has observation dates at Months 4, 7, 10, and 13 (May 2025, August 2025, November 2025, and February 2026).
- Autocall (Early Redemption): If NVDA's closing price is at or above 100% of the initial price on any observation date, the product automatically redeems early at par (SGD 1.00) plus the accrued coupon.
- Coupon Payment: A distribution of SGD 0.025 (2.5%) is paid on each observation date if the underlying price is above 50% of the initial price.
- Knock-in Protection: If the underlying price ever falls below 67% of the initial price before maturity, a "knock-in" event occurs.
Maturity Payoff
| Condition | Payoff |
|---|---|
| No knock-in | Full return of capital (100% of notional) |
| Knock-in occurred - If final price ≥ 90% of initial | SGD 1.00 |
| Knock-in occurred - If final price < 90% of initial | SGD × (Price/Strike) |
Payoff Scenarios
| Scenario | Trigger Condition | Payoff |
|---|---|---|
| Early Redemption | Price ≥ 100% barrier | SGD 1.00 + Coupon |
| Maturity (No Knock-in) | Price never < 67% | SGD 1.00 |
| Maturity (Knock-in) | Price fell below 67% but ≥ 90% | SGD 1.00 |
| Maturity (Loss) | Price fell below 67% and < 90% | SGD × (Price/Strike) |
Simulation Methodology
- Model: GJR-GARCH(1,1) with Student's t distribution
- Number of Simulations: 10,000
- Simulation Period: 13 months (product term)
- Risk-free Rate: 3.54% (1-year US Treasury)
- Risk Premium: 6.00% (equity risk premium applied)
- Drift: 9.54% annually
Simulation Results
Scenario Probabilities
The Monte Carlo simulation reveals the following outcome distribution:
Early Redemption Timing:
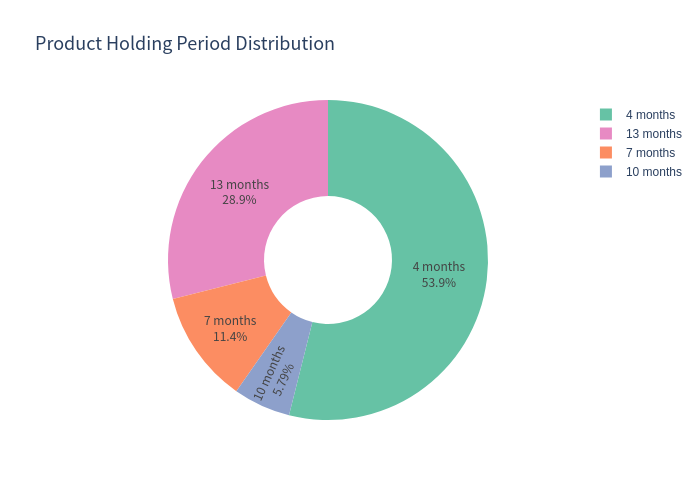
- Month 4: 53.92%
- Month 7: 11.37%
- Month 10: 5.79%
- Month 13: 3.89%
Maturity Breakdown:
- With Knock-in: 14.61%
- Without Knock-in: 10.42%
Return Distribution
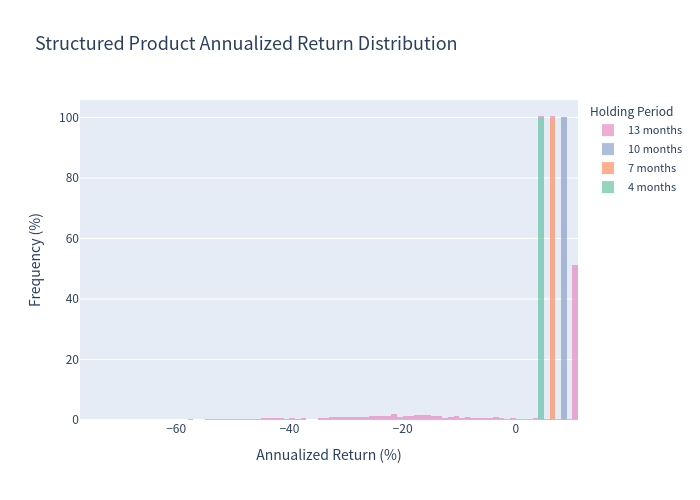
Structured Product Annualized Returns:
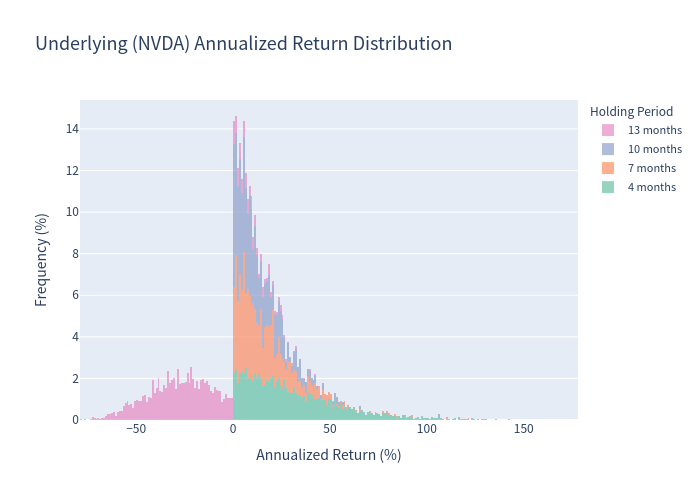
Underlying (NVDA) Annualized Returns:
Risk Analysis
Value at Risk (VaR)
At the 99% confidence level:
The structured product shows 17.6% better VaR compared to direct stock investment.
Probability of Loss
The product approximately halves the probability of loss compared to the underlying.
Outperformance vs Risk-Free Rate
Charts
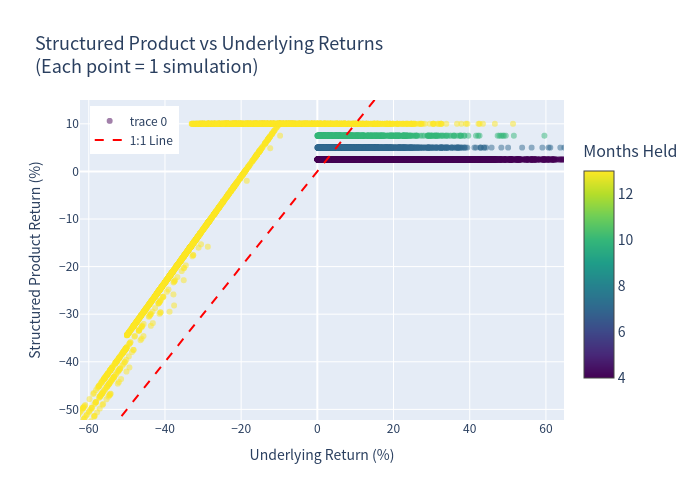
1. Simulation Outcomes Scatter Plot
This scatter plot shows each simulation outcome, with the X-axis representing the underlying NVDA return and the Y-axis representing the structured product return. Color indicates the holding period in months. The red dashed line represents the 1:1 line (where product and underlying returns would be equal).
2. Underlying Return Distribution
Histogram showing the distribution of annualized returns for the underlying NVDA stock, stacked by holding period.
3. Structured Product Return Distribution
Histogram showing the distribution of annualized returns for the structured product, stacked by holding period.
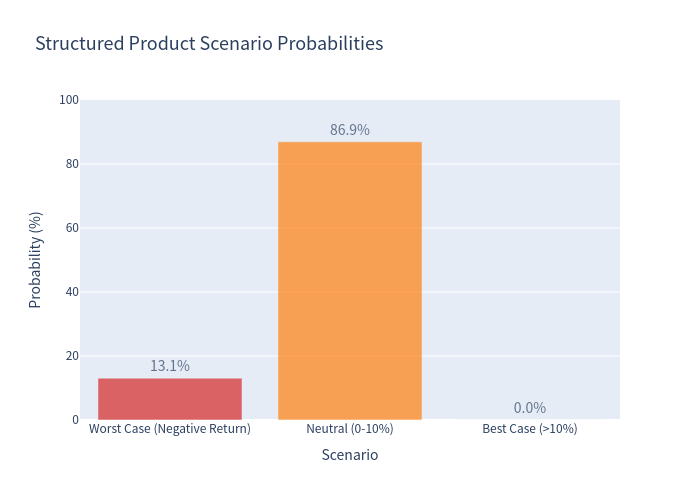
4. Scenario Probabilities
Bar chart showing the probability of different return scenarios for the structured product.
5. Risk vs Return Comparison
Scatter plot comparing risk (volatility) vs return for the structured product, underlying NVDA, and the risk-free rate.
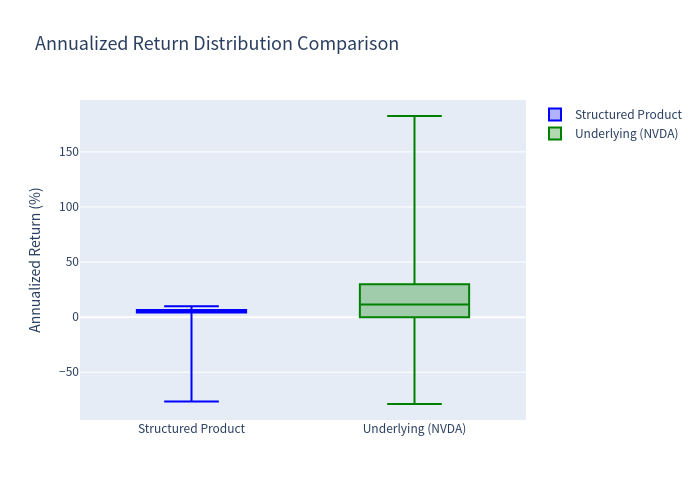
6. Return Distribution Comparison
Box plot comparing the distribution of annualized returns between the structured product and the underlying NVDA.
7. Holding Period Distribution
Pie chart showing the distribution of how long the product was held before expiry or early redemption.
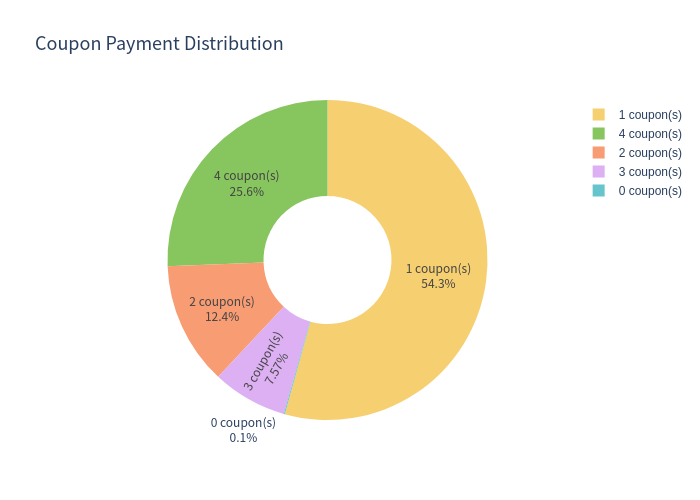
8. Coupon Distribution
Pie chart showing the distribution of the number of coupons paid.
Key Statistics Comparison
| Metric | Structured Product | Underlying (NVDA) | Advantage |
|---|---|---|---|
| Expected Annualized Return | 1.90% | 12.60% | Underlying |
| Expected Volatility | 11.59% | 32.37% | Product |
| Probability of Loss | 13.08% | 25.03% | Product |
| 99% VaR | -47.23% | -57.30% | Product |
| Max Return Potential | 10.00% | 182.54% | Underlying |
Investment Commentary
Pros
- Capital Protection Features: The knock-in barrier at 67% provides a significant buffer against moderate market declines.
- Quarterly Income: Regular coupon payments of 2.5% (10% annualized maximum) provide income even if the product is not autocalled.
- Early Redemption Opportunity: High probability (75%) of early redemption with positive returns.
- Reduced Volatility: The structured product exhibits approximately 64% lower volatility than the underlying stock.
- Lower Probability of Loss: Probability of loss is roughly half that of holding NVDA directly.
Considerations
- Capped Upside: Maximum return is capped at 10% annualized, while NVDA has shown significantly higher returns in historical scenarios.
- Knock-in Risk: If NVDA falls more than 33% below initial levels, investors may receive less than full principal at maturity.
- Market Dependency: Performance is directly tied to NVDA stock performance; diversification benefits are limited.
Conclusion
The NVDA Autocallable Certificate offers a balanced risk-return profile for investors seeking:
- Income Generation: With an average of 2.04 coupons paid per scenario and a 10% maximum annualized coupon rate.
- Downside Protection: The 67% knock-in barrier and capped downside provide meaningful protection against severe market declines.
- Early Exit Flexibility: With 75% of scenarios resulting in early redemption, investors have a good chance of locking in returns before maturity.
The product is most suitable for investors who:
- Have a moderately bullish to neutral view on NVDA
- Seek regular income from their investments
- Want downside protection while accepting capped upside
- Are comfortable with the credit risk of the issuer (SG Issuer/Societe Generale)
Note: This analysis is based on Monte Carlo simulations and should not be considered financial advice. Past performance of the underlying asset does not guarantee future results.