
Headline Simulation Results
1. Basic Product Information
How it works (layman's explanation): This is a 7-year, USD Jump Note linked to the Morgan Stanley Amplitude Index™ (MSAMP5) — a rules-based, multi-asset index designed to capture price momentum across global equities, bonds, gold and other assets while targeting a low ~5% volatility (max leverage 125%).
- No periodic coupons are paid; the investor pays $1,000 per note at issue.
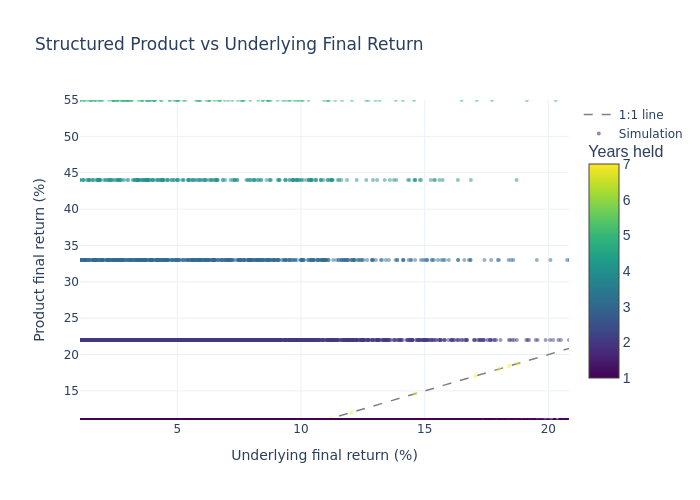
- Early redemption (autocall): on each annual determination date (years 1–6), if the index closes at or above 101% of its initial level, the note is auto-redeemed for par + ≈11.00% per annum per year held ($1,110 in year 1 up to $1,660 in year 6). No further payments.
- Maturity (year 7, if never called): if the index closes above its initial level, investor receives par plus 100% of the index gain, uncapped; if at/below initial, investor receives only par. No barrier/knock-in — principal protected at maturity.
Underlier note (ASSUMPTION): MSAMP5 is proprietary (established Jan 5, 2026) with no public price history. Simulations use a documented proxy reproducing its design: ~5%-volatility-targeted multi-asset basket (50% US equities / 30% US 10-yr Treasuries / 20% gold, monthly rebalanced), net of ~1.4% p.a. embedded index fees.
2. Key Statistics (annualized, 10,000 simulations)
| Metric | Structured Product | Underlier / Benchmark (total return) |
|---|---|---|
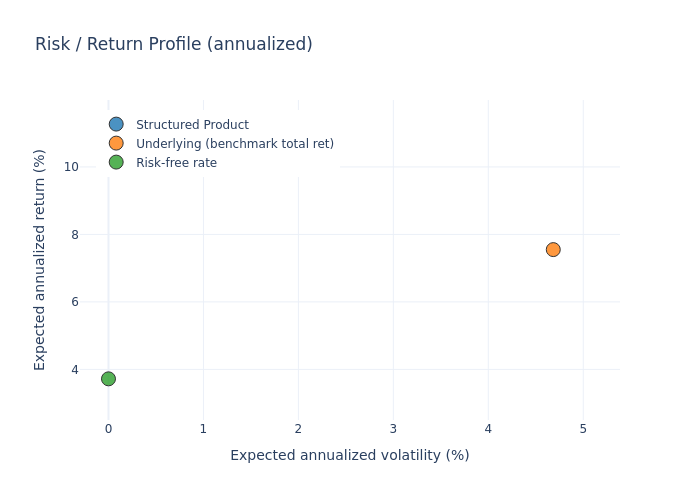
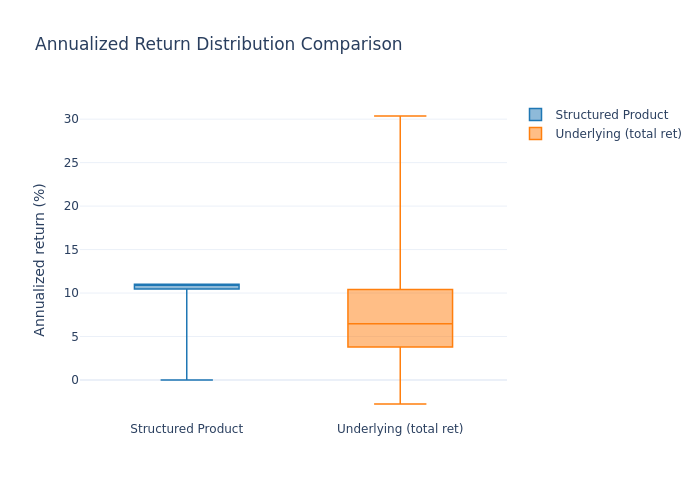
| Expected annualized return | 10.70% | 7.55% |
| Dispersion of annualized returns (std) | 1.04% | 4.68% |
| Probability of loss | 0.00% | 0.17% |
| 99% VaR (1st pct of annualized returns) | +8.81% | +1.49% |
| Expected total return over realized holding | 15.51% | — |
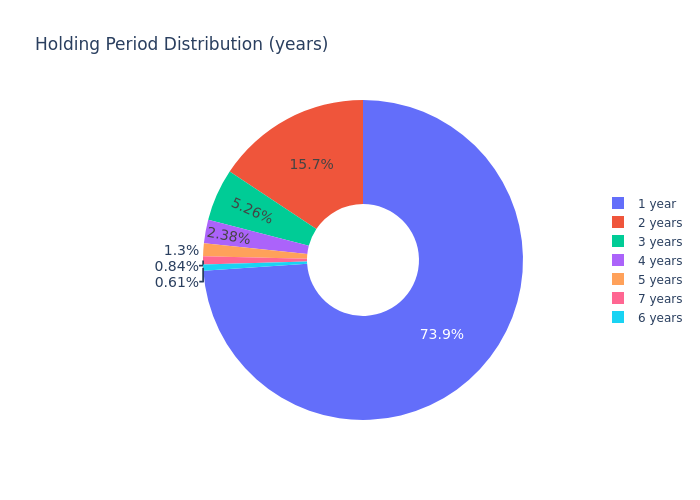
| Expected holding period | 17.60 months (≈1.47 yrs) | — |
| Median holding period | 12 months | — |
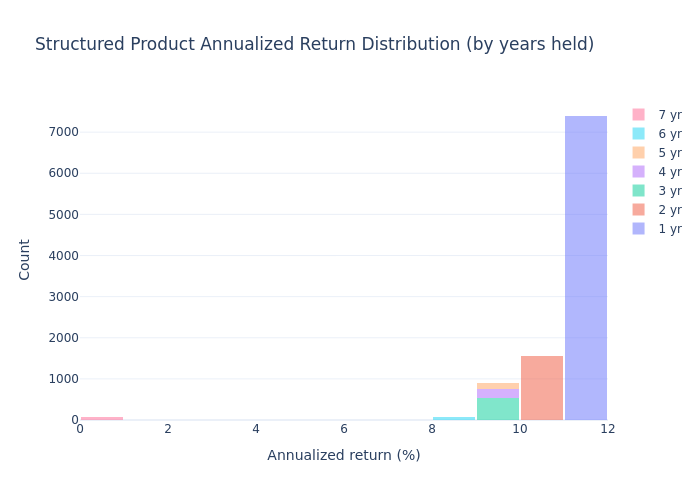
- Holding periods are short because ~74% of paths are auto-called after one year; annualized figures should be read together with the modest total return and short holding period (year-1 call = +11.00% total over 12 months).
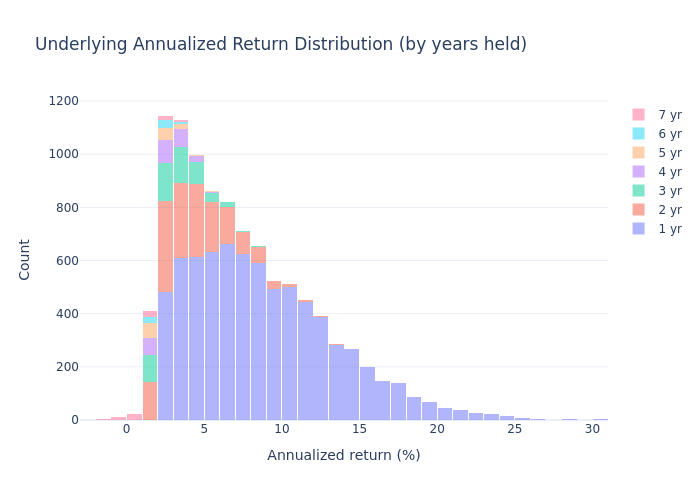
- The underlier benchmark is measured over the same per-simulation holding windows and includes ~1.10% p.a. estimated income. Because auto-call paths are those where the index has already risen, the conditional mean over short windows is above the ~5.3% p.a. net long-run drift assumption.
- "Dispersion of annualized returns" = cross-simulation std of per-simulation annualized returns (not the ~6% underlier process volatility).
3. Charts
3.1 Simulation Outcomes — final return vs underlier (color = years held)
3.2 Annualized Return Distributions (1% bins, color = years held)
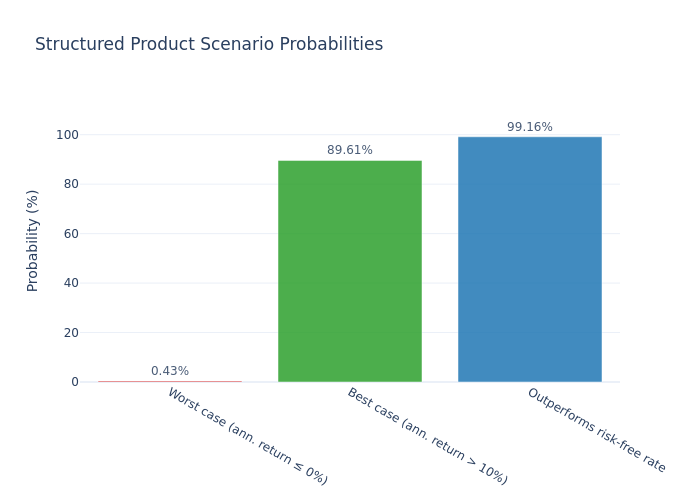
3.3 Scenario Probabilities
3.4 Risk / Return Profile
3.5 Box Plot Comparison
3.6 Holding Period Distribution
4. Investment Commentary
What works well
- Full principal protection at maturity — no barrier to trip; the maturity payoff can never be less than par.
- Frequent, generous early-exit payments — ≈11.00% p.a. whenever the index is at/above 101% of initial on an annual determination date; triggers quickly under the model (>99% of paths, 74% in year 1).
- Uncapped 100% upside participation if the note runs to maturity with the index above initial.
- Low-volatility underlier — the ~5% volatility targeting reduces deep drawdown risk vs a direct equity investment.
Points to keep in mind
- The notes pay no interest; flat/down index at maturity = 0% return over seven years (opportunity cost vs ~3.72% risk-free). 0.43% of paths end ≤0% annualized.
- Early redemption risk — once called, gains cap at the fixed ≈11% p.a. payment (89.61% of paths exceed 10% annualized mainly by exiting early).
- The underlier is new and unproven (established Jan 2026) with ~1.4% p.a. embedded costs; results are sensitive to the assumed long-run drift.
- All payments subject to Morgan Stanley credit risk; notes are unsecured.
- Estimated value on pricing date ($890.10) is below the $1,000 issue price, reflecting issuance/structuring/hedging costs.
This document is a quantitative evaluation only. It does not constitute investment advice or a suitability assessment.
Simulation assumptions: 10,000 simulated paths, 84 months; risk-free rate = 1-yr average U.S. T-bill (3.72%); underlier proxy drift = risk-free + 3.00% p.a. less ~1.4% p.a. embedded index fees (≈5.3% p.a. net); underlier process volatility ≈6% p.a. Payoff mechanics implemented per the term sheet: 101% call threshold, 11.00% p.a. early-redemption payments ($1,110–$1,660), par + 100% uncapped upside at maturity.