
Morgan Stanley Worst-of SLV, NDXT & RTY Contingent Income Memory Auto-Callable Securities
Headline Simulation Results
| Metric | Value |
|---|---|
| Expected annualized return | 8.40% |
| Expected total return (over realized holding period) | 11.77% |
| Expected holding period | 18.98 months (~1.58 years) |
| Probability of negative return | 6.94% |
| 99% confidence VaR (1 year) | −22.91% |
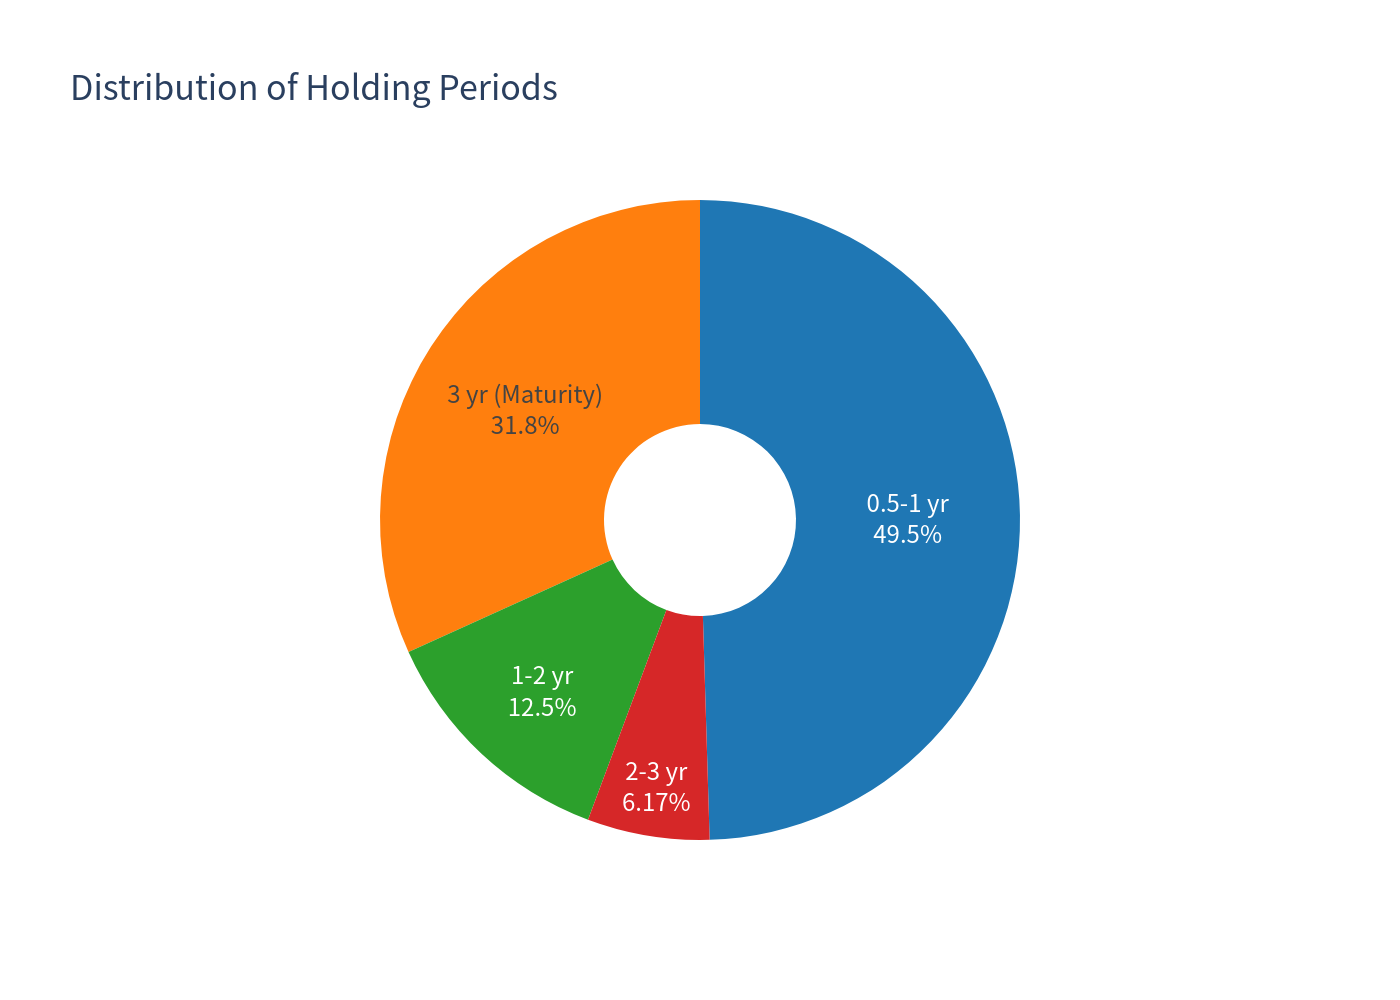
| Automatic early redemption rate | 68.23% |
| Held to maturity | 31.77% |
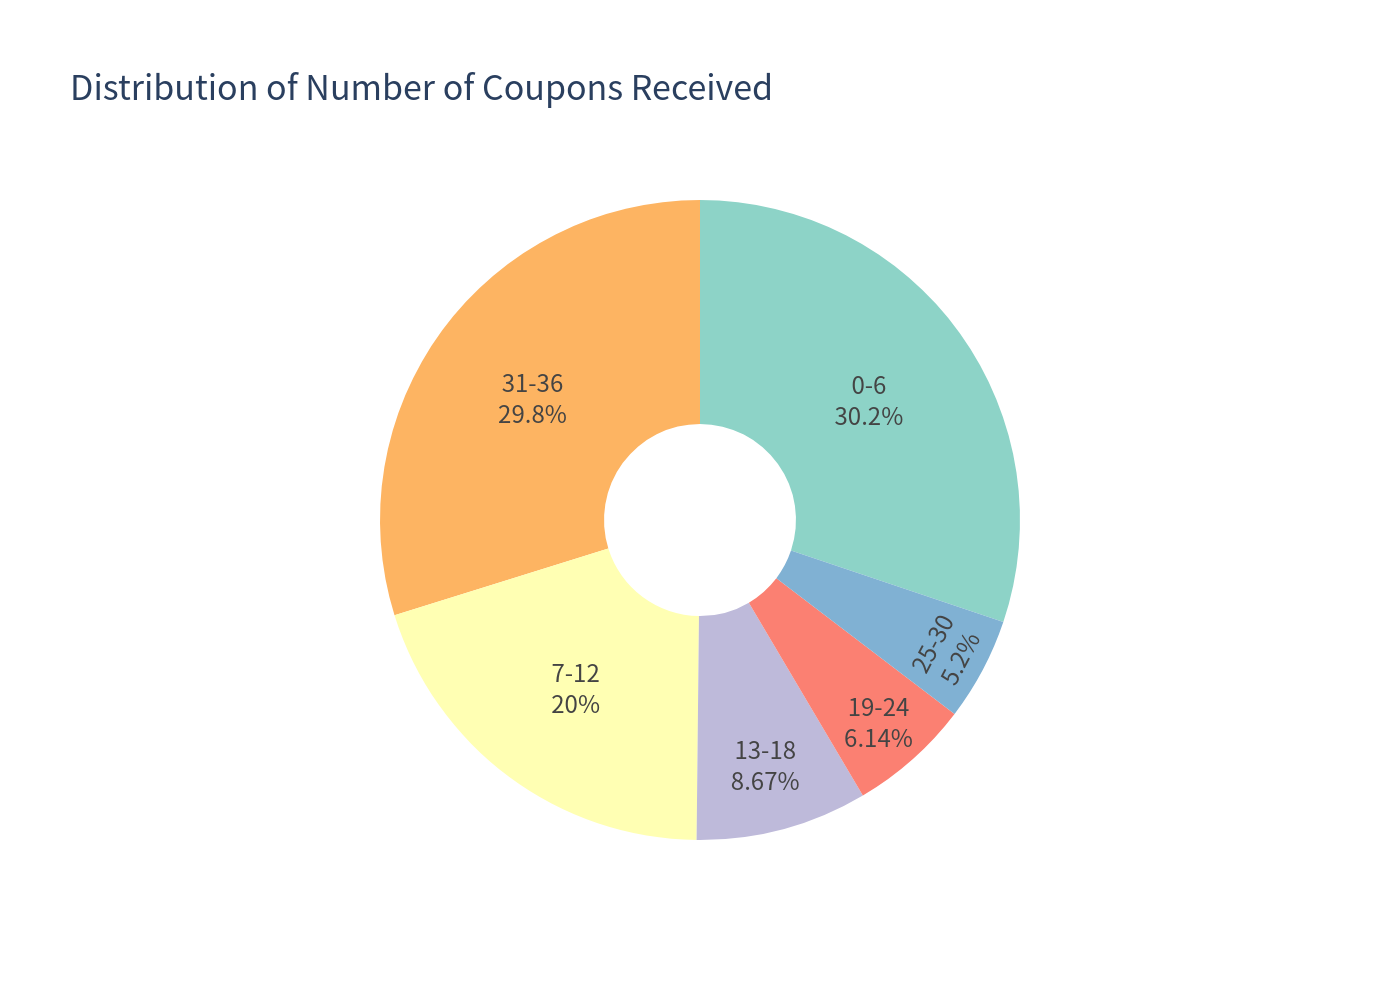
The product generated a positive return in 93.06% of simulated scenarios and delivered an annualized return above 10% in 61.52% of scenarios. The average number of contingent coupons received was 18.21, corresponding to average coupon income of 15.94 index points on a 100-point notional.
Basic Product Information
How It Works (Layman Explanation)
This is a worst-of structured note linked to three underlyings: the iShares Silver Trust (silver), the Nasdaq-100 Technology Sector Index, and the Russell 2000 Index. The worst performer among the three drives every payment.
- Monthly income with memory: Each month, if all three underlyings close at or above 50% of their initial level, the investor receives a coupon of approximately 0.875% of notional per month (10.50% per annum). If the condition is not met, the coupon is not lost — it is remembered and paid later, together with the current coupon, on the first month the condition is met again.
- Automatic early redemption: Starting after 6 months, if all three underlyings close at or above 100% of their initial level on any monthly observation date, the note is automatically redeemed at par plus the coupon for that month. No further payments are made after redemption.
- Downside protection at maturity: If the note survives to maturity and the worst performer has not fallen below 50% of its initial level, the investor receives par plus the final coupon. If the worst performer has fallen below 50%, the investor loses 1% of principal for every 1% decline in the worst performer (no final coupon).
- Capped upside: Investors do not participate in any appreciation of the underlyings. The maximum return is the sum of accumulated coupons.
The worst-of structure means the note is only as strong as its weakest underlier — a sharp decline in any one of silver, technology stocks, or small-cap stocks can impair coupons or principal even if the other two perform well.
Key Statistics — Structured Product vs Underlying Benchmark
The benchmark is an equal-weight basket of the three underlyings (SLV, NDXT, RTY), with dividends added for total-return comparison.
| Metric | Structured Product | Underlying Basket (Total Return) |
|---|---|---|
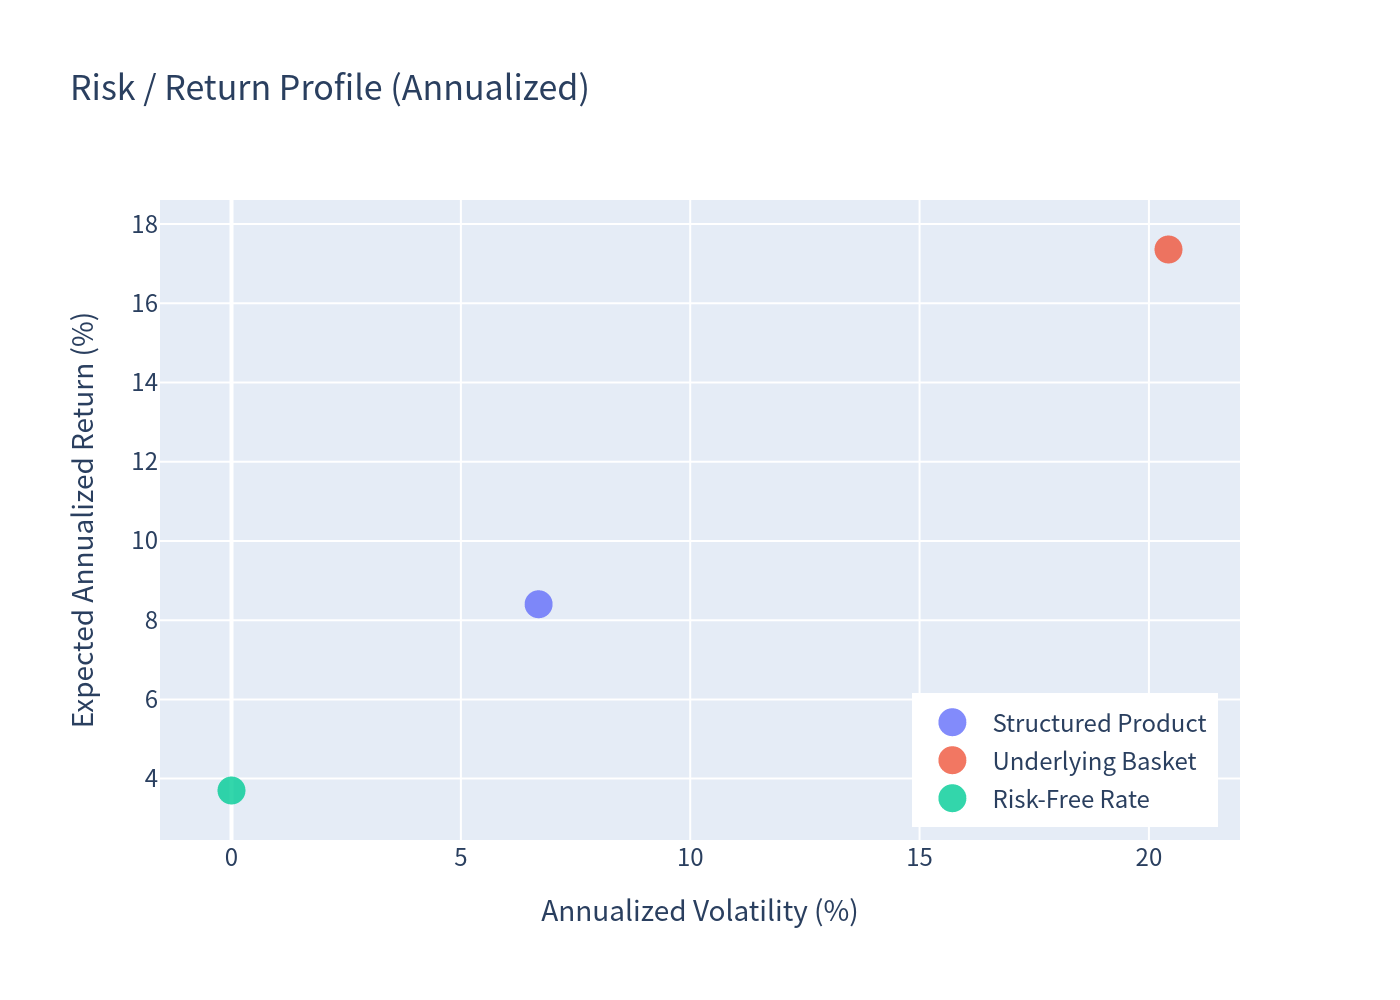
| Expected annualized return | 8.40% | 17.36% |
| Expected annualized volatility | 6.70% | 20.43% |
| Probability of loss | 6.94% | 18.31% |
| 99% confidence VaR (1 year) | −22.91% | −17.15% |
| Risk-free rate (1-yr T-bill) | — | 3.70% |
Reading the table: The structured product offers a materially higher probability of a positive outcome and much lower volatility than direct exposure to the basket, but caps its upside. Its 99% VaR is worse than the diversified basket because the worst-of structure concentrates downside in the weakest underlier at maturity.
Charts
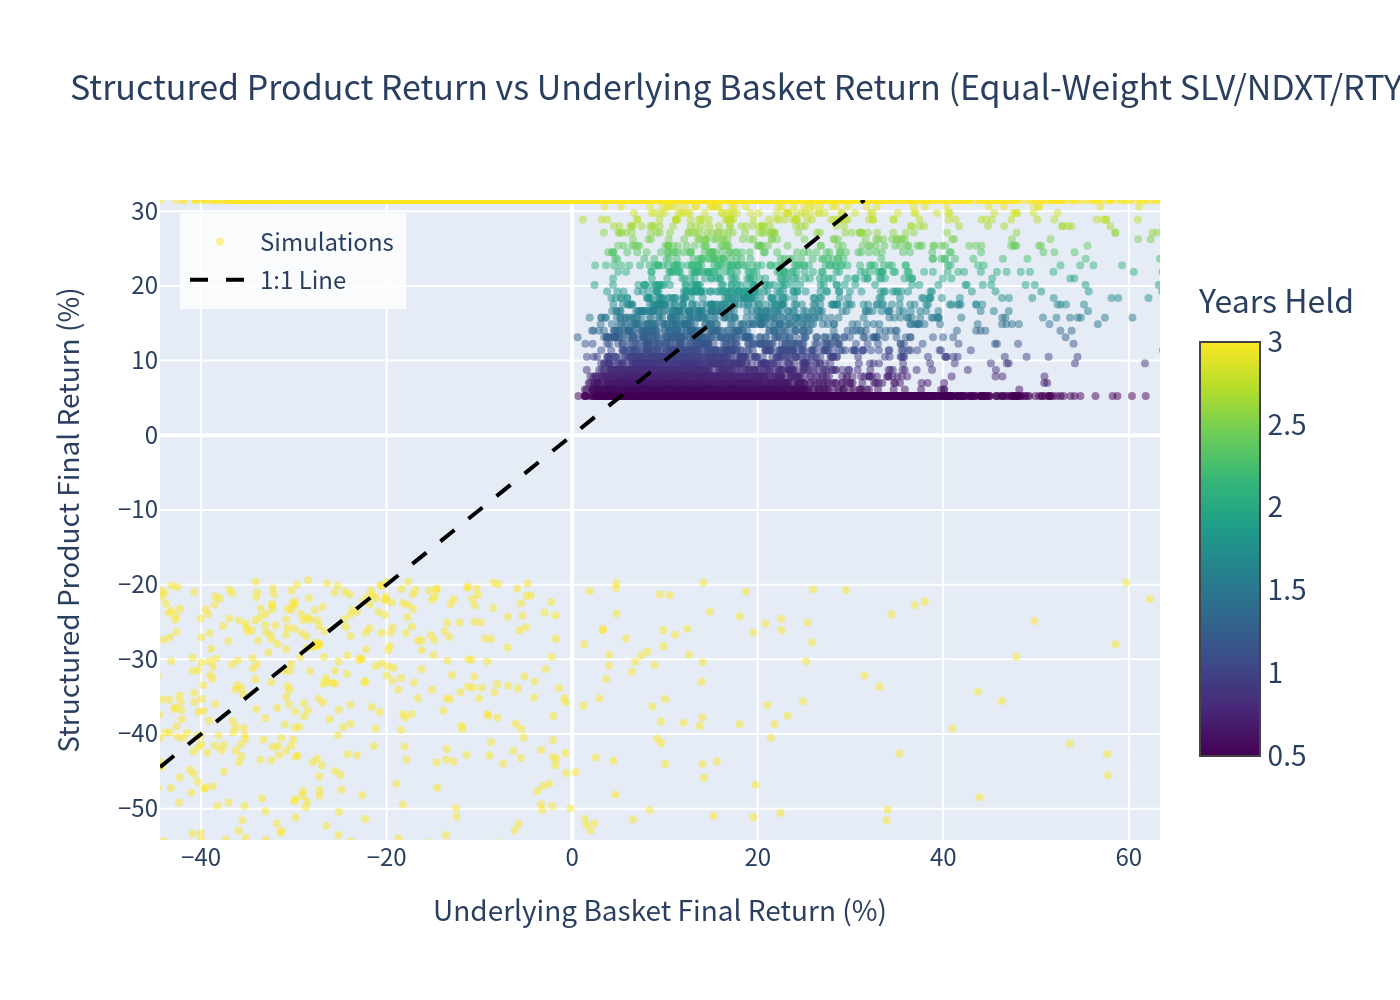
Simulation Outcomes Scatter Plot
Each dot is one simulated path, colored by how long the note was held. The dashed 1:1 line shows the underlying basket's return for reference; points above it indicate the product outperformed the underlying.
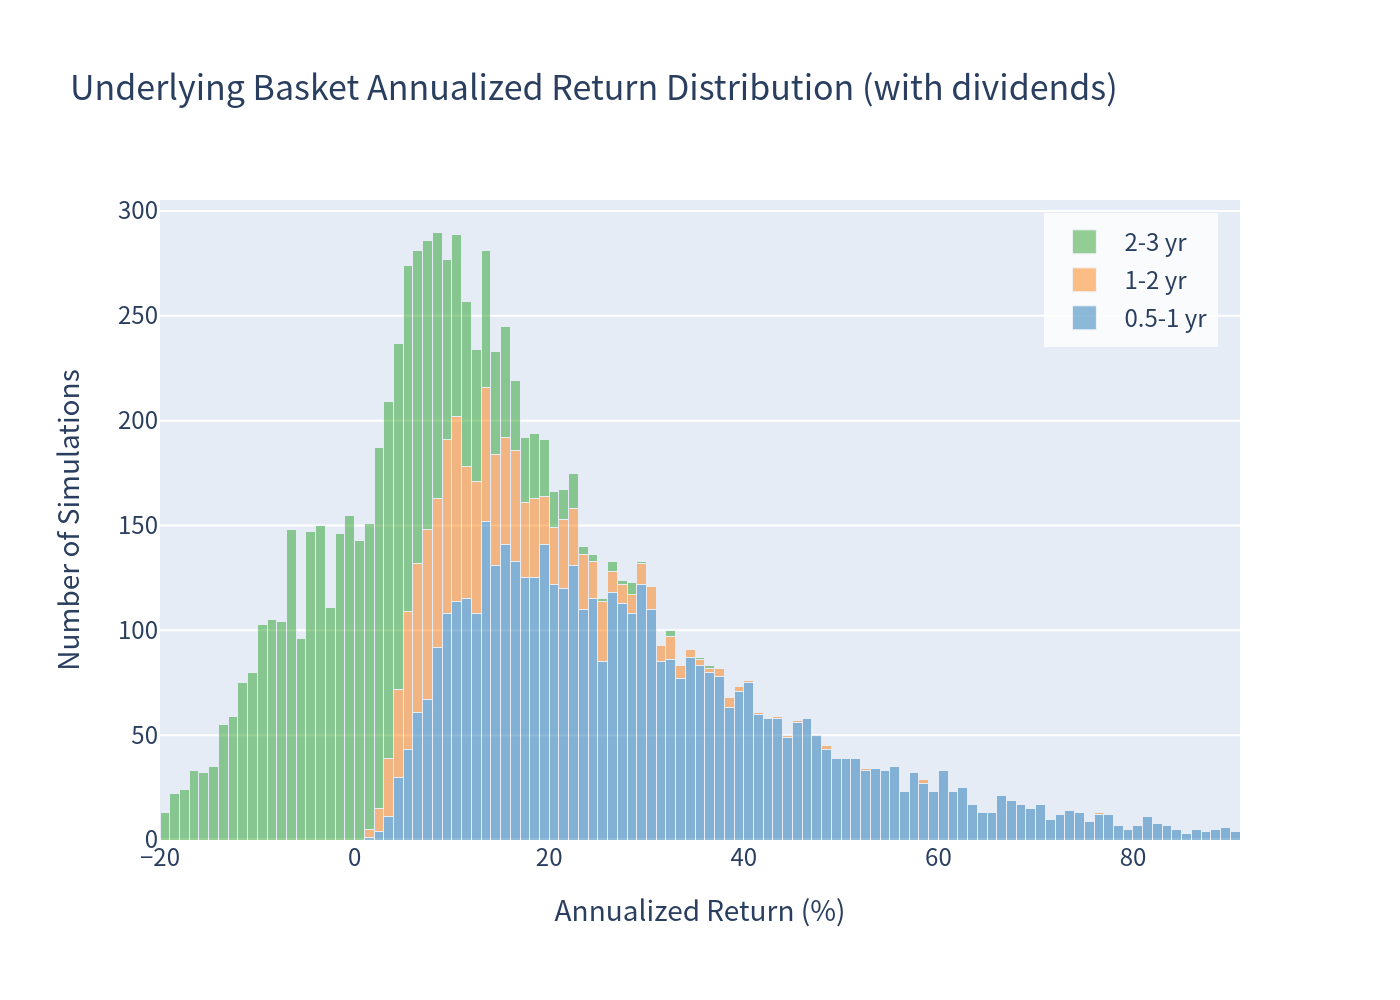
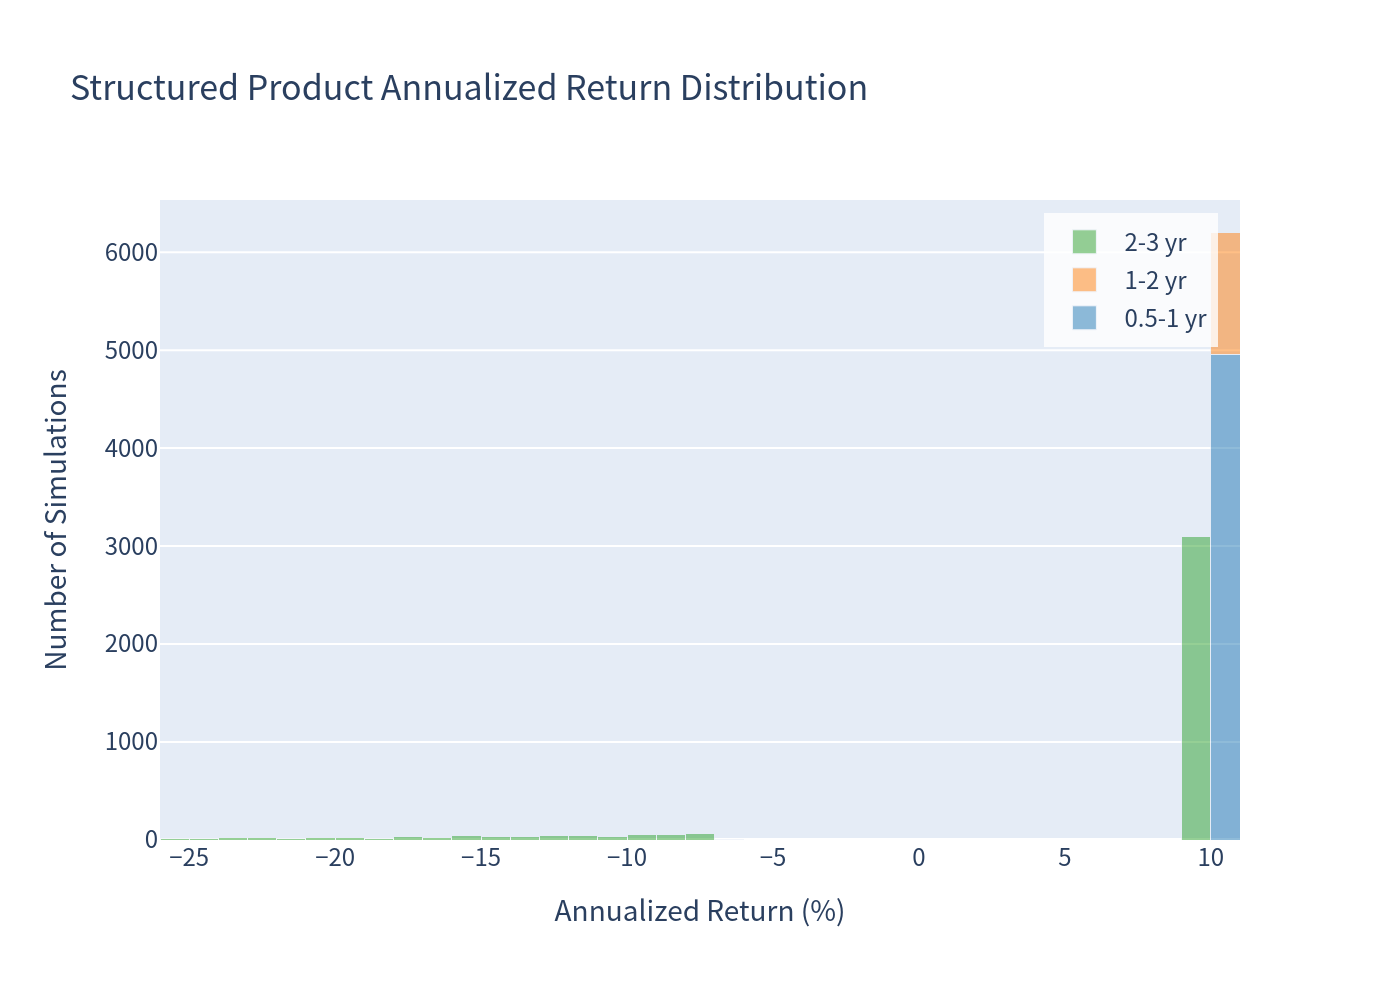
Return Distributions
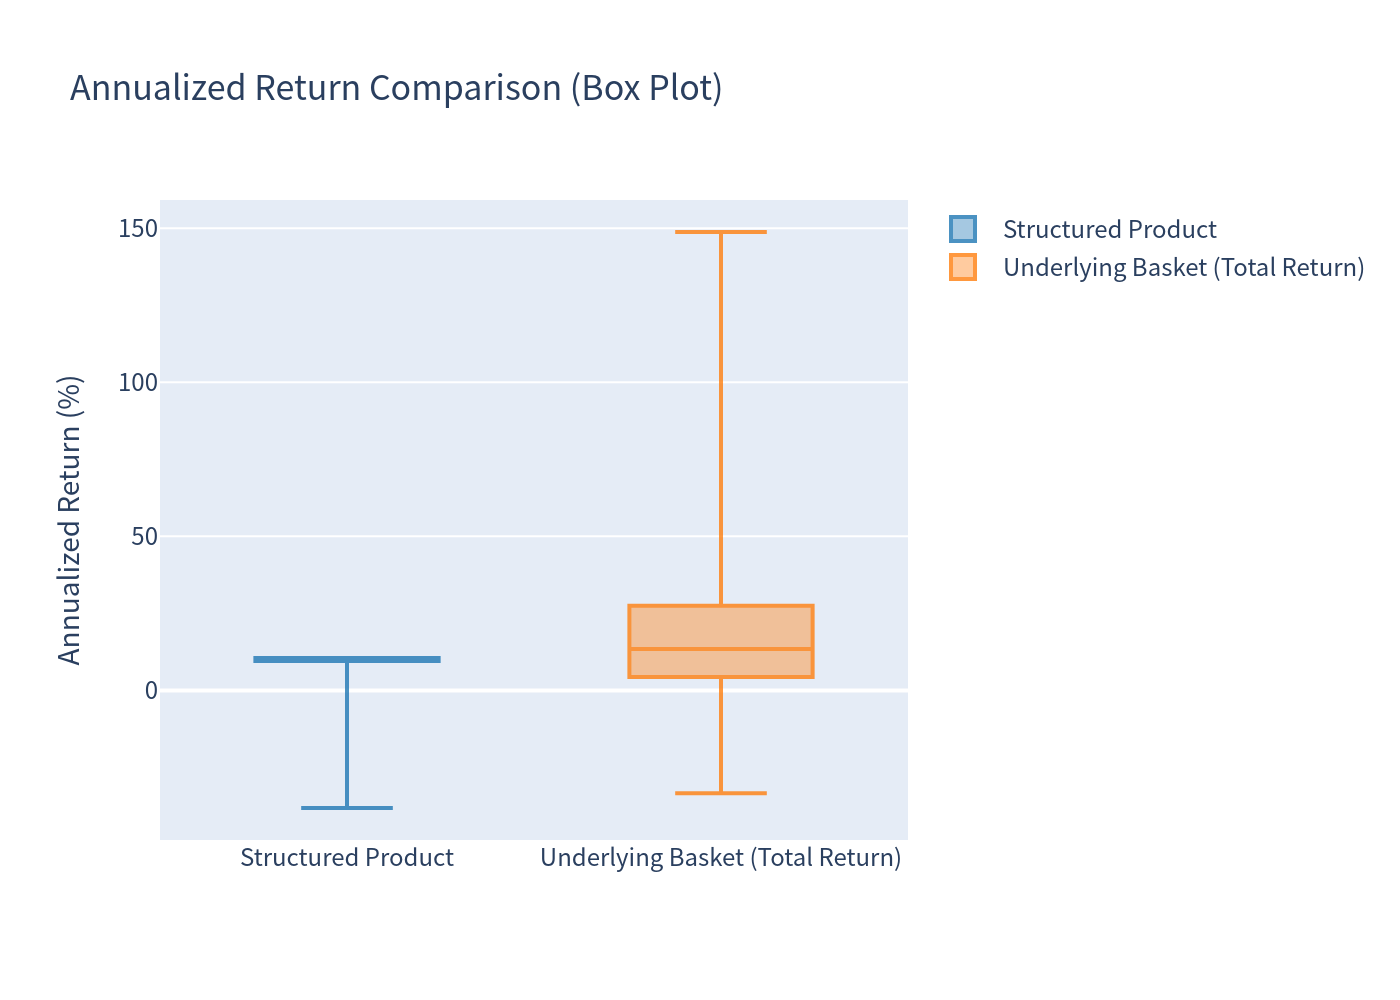
Annualized return histograms (1% bins), stacked by holding period. Note that roughly half of scenarios end in early redemption within the first year, which caps the product's annualized return near 10.5% while the underlying's linear-annualized short-horizon returns can appear extreme.
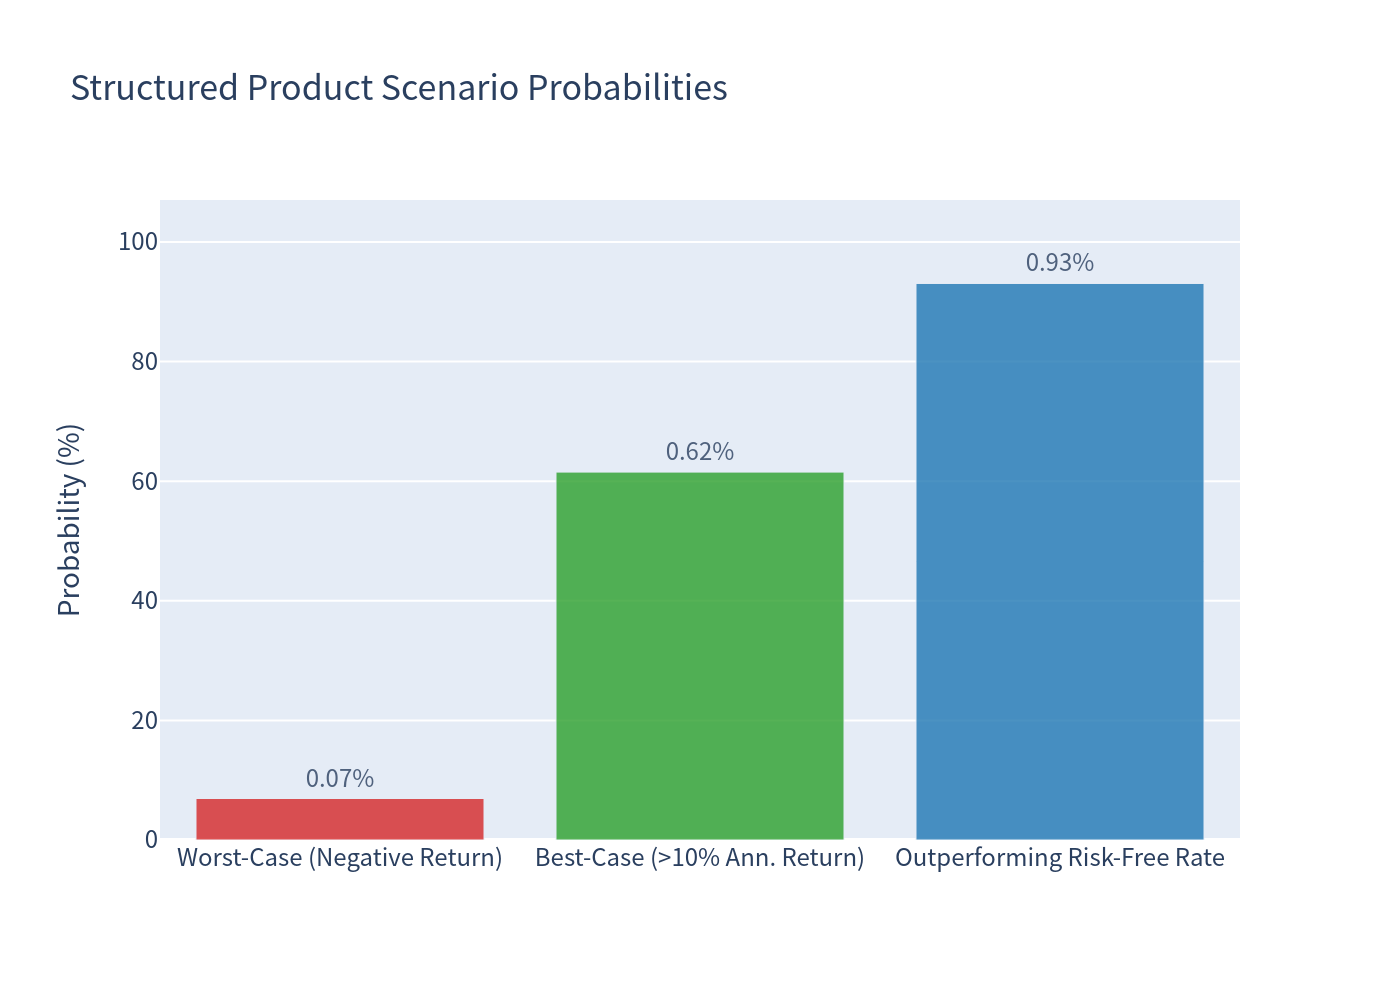
Scenario Probabilities
Risk / Return Profile
Annualized Return Comparison
Holding Period Distribution
Coupon Count Distribution
Investment Commentary
Positive Characteristics
- High probability of income: Coupons were received in essentially all simulated scenarios (with the memory feature recapturing missed coupons), and the note beat the risk-free rate in 93.06% of scenarios.
- Strong downside protection buffer: The 50% barrier provides protection against moderate declines; the probability of any principal loss is only 6.94%, well below the 18.31% loss probability of the underlying basket.
- Low volatility profile: Annualized return volatility of 6.70% is roughly one-third of the underlying basket's 20.43%, reflecting the coupon-income dominated payoff.
- Memory feature: Missed coupons are not forfeited — they accumulate and are paid when conditions improve, which supported income in scenarios with temporary drawdowns.
- Frequent early redemption: 68.23% of scenarios were auto-called (typically within the first year), returning par plus coupons and freeing capital.
Considerations
- Capped upside: Participation in any underlying appreciation is zero; the best outcome is limited to accumulated coupons (max ~31.50 index points over the full term).
- Worst-of downside concentration: Principal loss, when it occurs, is driven by the single worst performer — the 99% VaR (−22.91%) is worse than the diversified basket (−17.15%).
- Annualized figures and holding period: Because ~47.5% of scenarios end in early redemption within 12 months, annualized returns on the product are capped near 10.5% while the underlying's linearly-annualized short-horizon returns can look extreme. The expected total return (11.77%) and expected holding period (~19 months) should be interpreted together with the annualized figure.
- Interest-rate context: With the 1-year risk-free rate at 3.70%, the note's expected annualized return of 8.40% offers a meaningful spread, but the coupon rate assumption (10.50%) sits at the midpoint of the 10.00%–11.00% range disclosed in the term sheet.