
Morgan Stanley Worst-of RTY & SPX Callable Jump Notes — Simulation Report
Headline Results
Key takeaway: This note offers full principal protection at maturity (payment never falls below par) plus 100% participation in the upside of the worst-performing of the Russell 2000® and S&P 500® indices, with the issuer redeeming the note early at pre-set escalating payments when its model indicates it is economically rational to do so. Over 10,000 simulated paths, the note never produced a negative return — the worst outcome was a 0% return (principal returned at par).
Basic Product Information
Issuer: Morgan Stanley Finance LLC (Morgan Stanley guaranteed) ·
CUSIP: 61781DHW1
Tenor: ~5 years (priced Aug 26, 2026; matures Aug 29, 2031)
How it works (layman explanation)
- Underlyings: Russell 2000® Index and S&P 500® Index. The note tracks the worse-performing of the two — the one that has fallen more (or risen less).
- No periodic coupons — the note does not pay interest.
- At maturity (if never redeemed early): you receive your full $1,000 back, plus 100% of any positive return of the worse-performing index. If the worse performer is flat or down, you simply get your $1,000 back. You cannot lose principal.
- Issuer call feature: Starting 12 months after pricing, the note will be redeemed early (in whole, not in part) on a redemption date if and only if Morgan Stanley's internal risk-neutral valuation model indicates redemption is economically rational. If redeemed, you receive a fixed escalating payment — from $1,110.00 per note at the first redemption date (August 2027) rising by roughly $9.17 each month to $1,540.83 per note at the final redemption date (July 2031). These fixed payments equate to roughly an 11% per year simple return on your principal.
- In practice: when the indices have rallied, the note tends to be redeemed early and the return in those scenarios is limited to approximately 11% per year; when the indices are weak, the note typically runs to maturity where your principal is protected and any upside is uncapped.
Key Statistics (Simulated)
| Metric | Structured Product | Underlying Basket* |
|---|---|---|
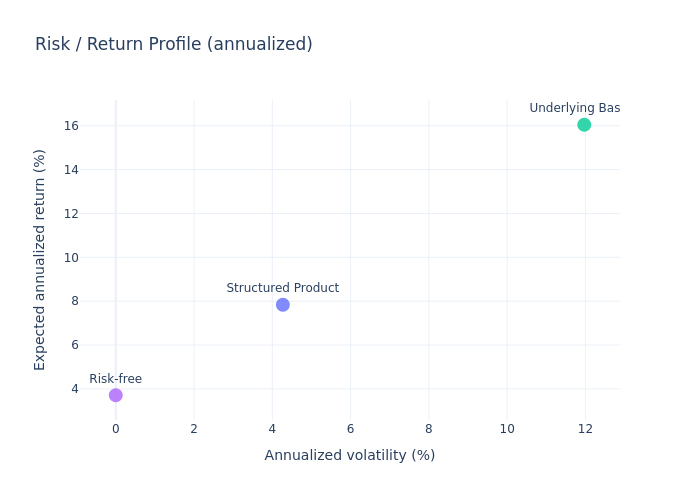
| Expected annualized return | 7.84% | 16.05% |
| Expected total return (same horizon) | 17.39% | 52.81% |
| Annualized volatility | 4.27% | 11.97% |
| Probability of loss | 0.00% | 11.06% |
| 99% VaR (1-year annualized) | 0.00% | -10.17% |
| Median annualized return | 10.58% | 18.72% |
Holding-period profile
- Mean holding period: 34.4 months (~2.9 years)
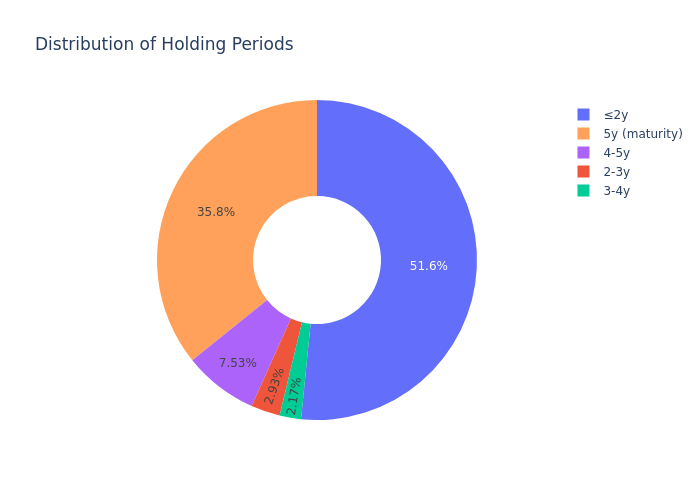
- Redeemed early: 64.2% of simulations (51.6% within the first 2 years)
- Held to maturity: 35.8% of simulations
The note's return profile is dominated by the redemption payments: roughly half of all paths are redeemed in the first two years at ~11% per year, and the remaining paths run to maturity with principal protection and upside participation.
Charts
Simulation Outcomes — Product Return vs Underlying Return
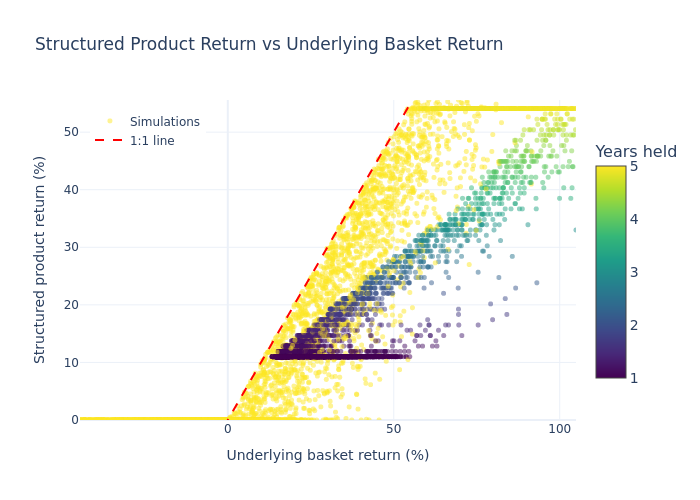
Each dot is one simulated path. The x-axis shows the underlying basket return over the same holding period; the y-axis shows the note's return; color shows how long the note was held. The dashed 1:1 line is shown for reference. Note the absence of any points below 0% on the y-axis (principal protection) and the clustering of points along the ~11%-per-year redemption band.
Annualized Return Distributions
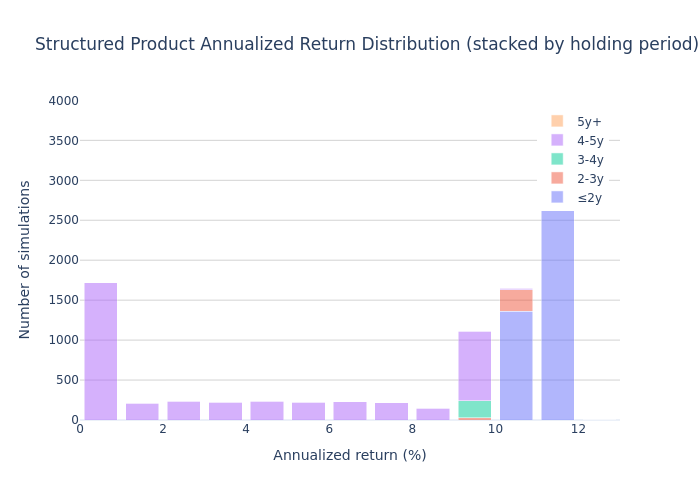
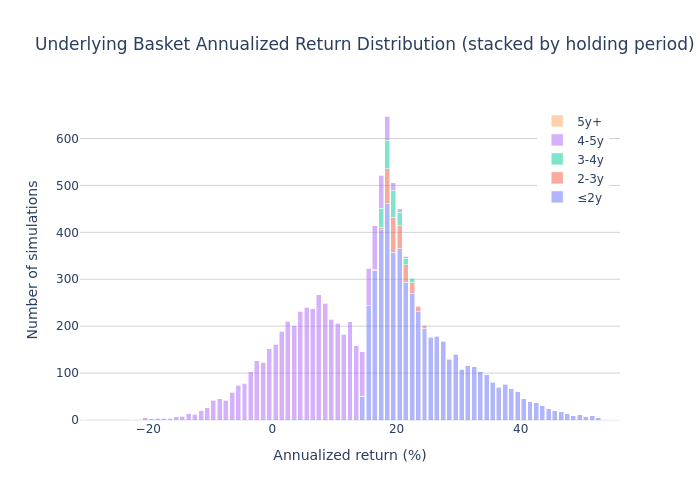
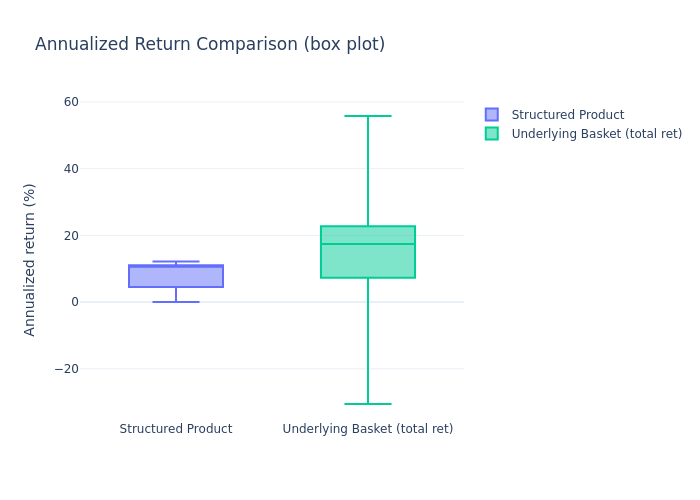
The note's annualized returns are tightly clustered between 0% and ~13% (a direct consequence of the redemption-payment band and the principal floor), while the underlying basket has a much wider distribution with meaningful downside.
Scenario Probabilities
Scenario breakdown across the 10,000 simulated paths.
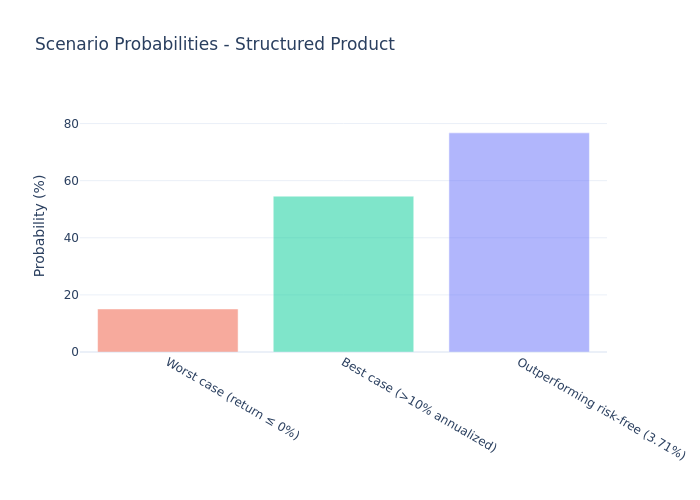
- Worst case (return ≤ 0%): 15.08% — these are paths held to maturity where the worse performer finished flat or lower; the investor still received par (0% loss).
- Best case (>10% annualized): 54.57%
- Outperforming the risk-free rate (3.71%): 76.73%
Risk / Return Profile
Risk-return scatter of the structured product versus the underlying basket.
Annualized Return Comparison (Box Plot)
Distributional comparison of annualized returns between the structured product and the underlying basket.
Holding Period Distribution
Share of simulated paths redeemed early (by period) versus held to maturity.
Investment Commentary
Attractive features
- Full downside protection: the note never lost money in any of the 10,000 simulated paths; the worst outcome was a return of par (0%).
- High probability of beating cash: 76.73% of paths outperformed the 1-year risk-free rate (~3.71%); the note's expected annualized return of 7.84% comfortably exceeds the risk-free benchmark.
- Attractive near-term payoff: more than half of the simulated paths are redeemed within the first two years at approximately 11% per year — a strong short-horizon return with essentially no downside risk in those scenarios.
- Upside participation: when held to maturity, the note captures 100% of the positive performance of the worse-performing index (uncapped at maturity, per the hypothetical payoff table).
Points to consider
- Return is limited when the market rallies: because the issuer redeems the note early when its model says it is economically rational, strong market performance is converted into the fixed ~11%-per-year redemption payments rather than open-ended upside. (Note: at maturity the payoff is not contractually capped; the ~11% ceiling is a property of the early-redemption outcomes.) The expected annualized return (7.84%) is therefore well below the underlying basket's expected return (16.05% same-horizon / 9.33% unconditional 5-year CAGR).
- Worst-of exposure: payoff depends on the worse of the two indices, so both must perform well for full upside; the note is exposed to the risk of the Russell 2000 (small-cap) index specifically.
- No coupon/interest cash flows: all return is concentrated in the redemption or maturity payment; there are no interim interest payments (only possible early-redemption proceeds).
- Modest absolute upside in many scenarios: the median annualized return (10.58%) sits near the ~11%-per-year redemption band, and roughly 15% of paths return only par (0% total return).