
13.00% p.a. Multi Barrier Reverse Convertible on Gold & Silver
Simulation Report — SSPA 1230 Reverse Convertible with Multi Barrier (Continuous), Callable (ISIN CH1593775849)
Headline Results
| Metric | Value |
|---|---|
| Expected annualized return | 7.19% |
| Expected total return (realized holding period) | 4.29% (median 6.50%) |
| Probability of negative return | 16.15% |
| 99% confidence VaR (1 year) | -38.09% |
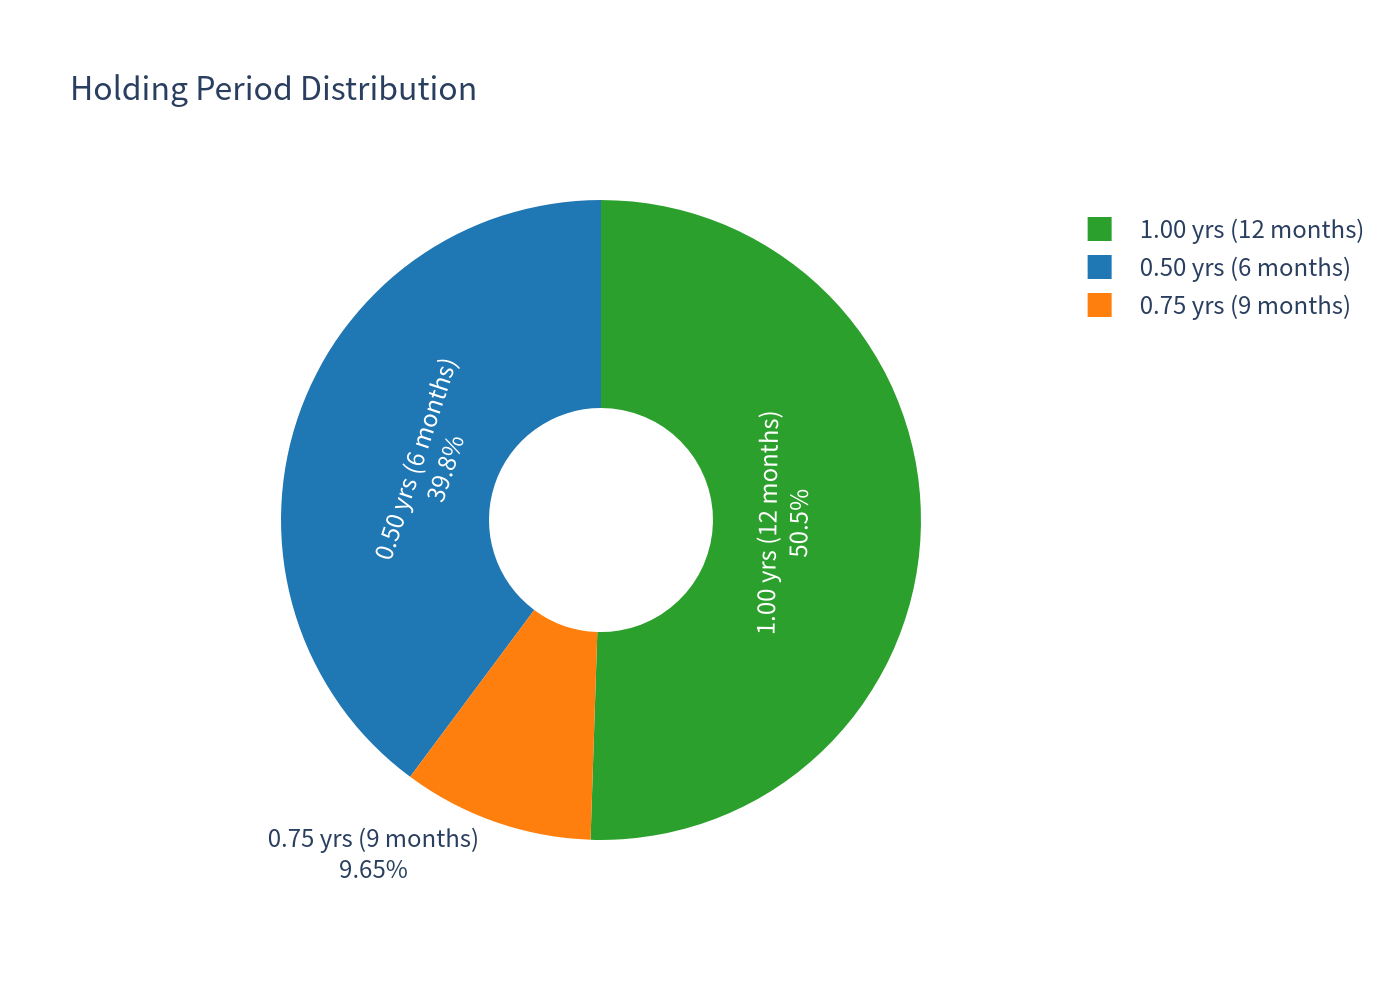
| Expected holding period | 9.32 months |
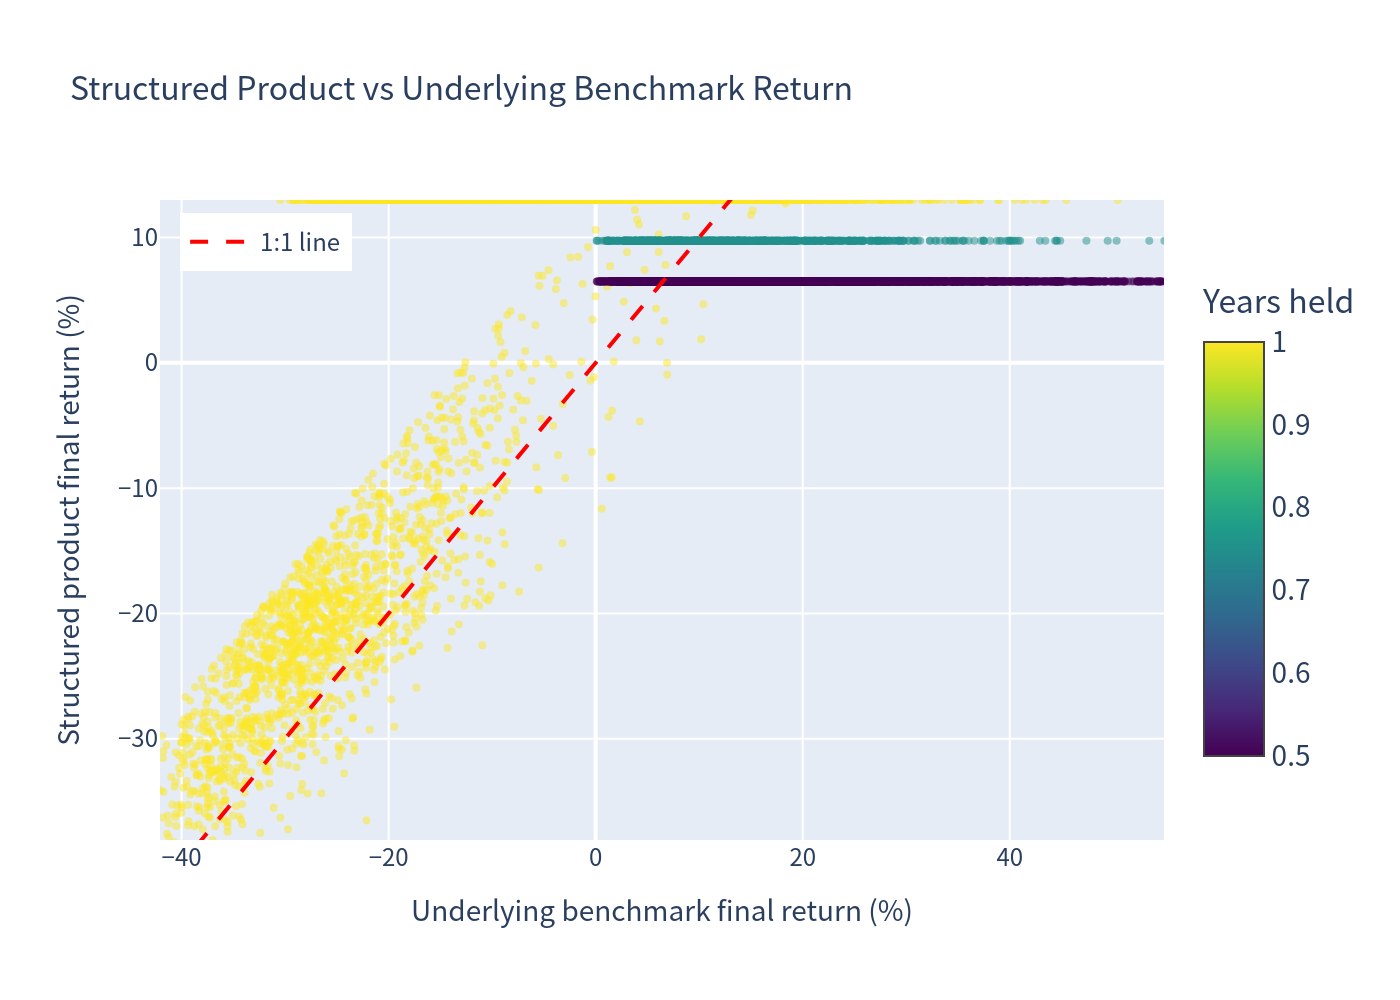
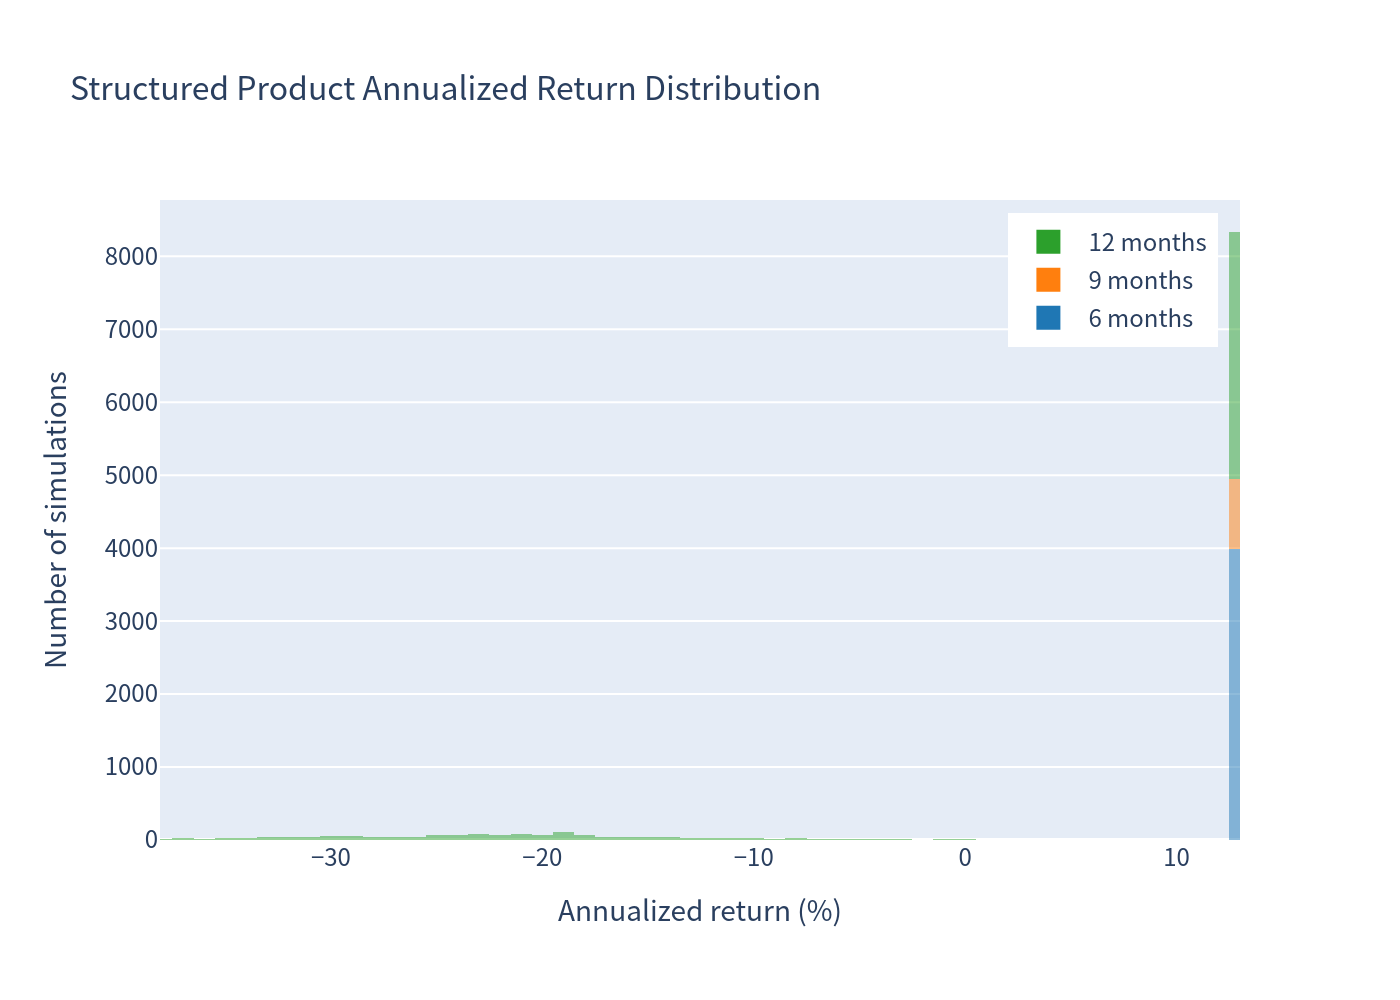
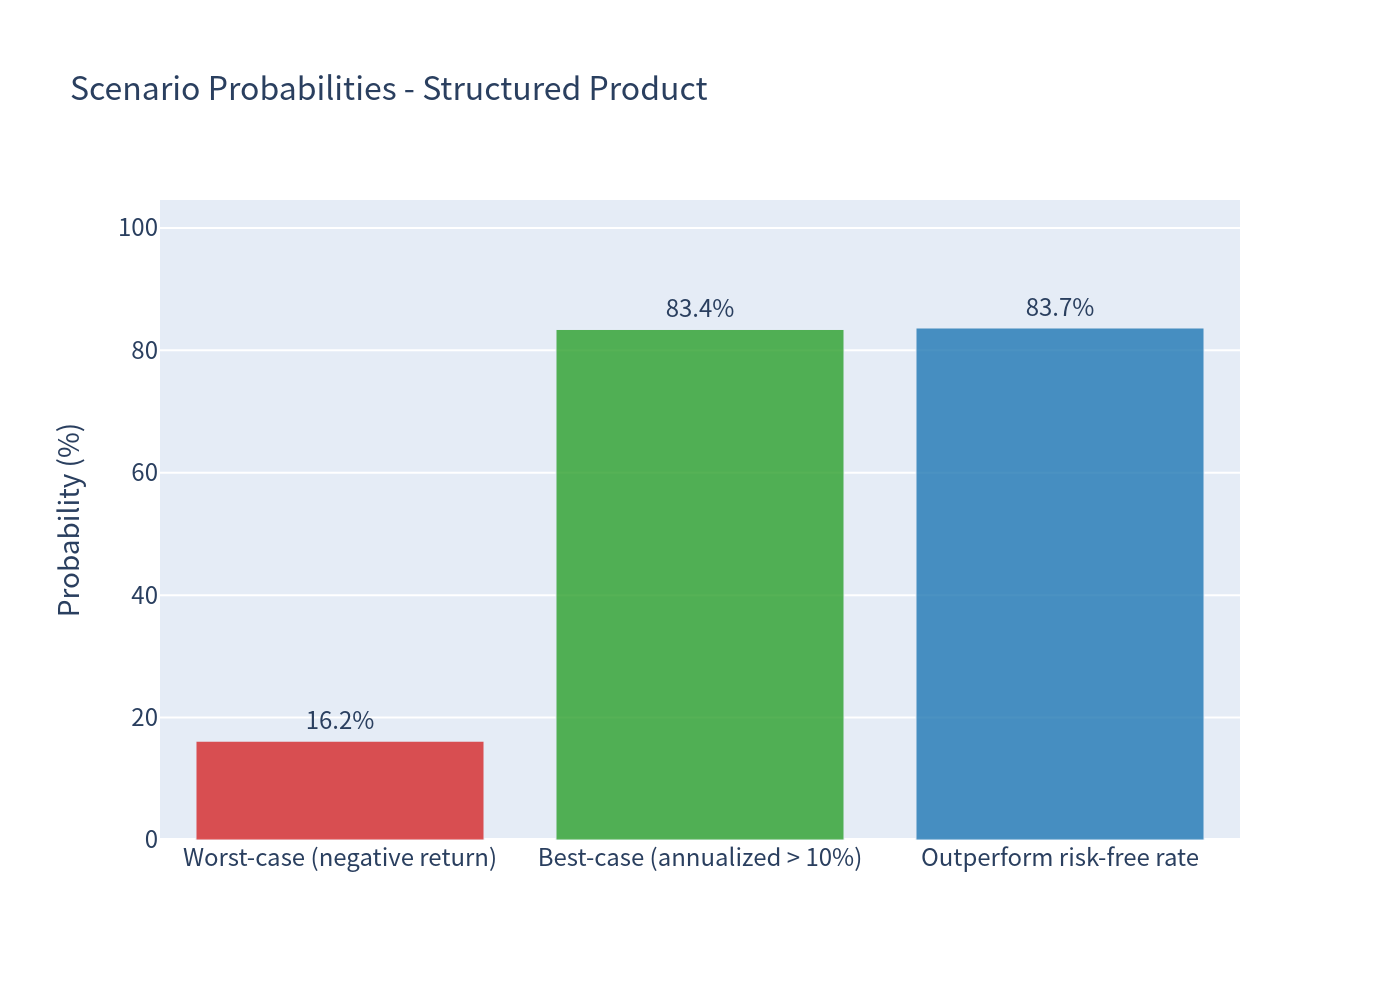
The product pays a fixed 13.00% p.a. coupon (3.25% per quarter) on the worst-of Gold / Silver performance, with a 69% continuous barrier and an issuer call at months 6 and 9. Under the simulation, roughly 49.5% of paths are called early (par + coupon), and 83.4% of paths achieve an annualized return above 10%. A negative return results in about 16.15% of paths, which occurs when the barrier is breached and the worst performer finishes below its strike.
Basic Product Information
| Type | SSPA 1230 Reverse Convertible with Multi Barrier (continuous barrier observation), callable (ISIN CH1593775849) |
| Underlyings | Gold (XAU/USD) and Silver (XAG/USD), payoff linked to the worst performer |
| Currency / Denomination | USD / USD 1,000 (Issue Price 100%) |
| Coupon | 13.00% p.a., paid quarterly (USD 32.50 = 3.25 index points per USD 1,000) |
| Barrier | 69% of initial fixing level, observed continuously over 03/09/2026 – 02/09/2027 |
| Strike | 100% of initial fixing level |
| Term | ~12 months (Issue 09/09/2026 → Redemption 09/09/2027), issuer callable at 09/03/2027 and 09/06/2027 |
How it works (layman explanation)
- The investor receives a quarterly coupon of 3.25% (13% p.a.) regardless of how gold and silver perform.
- The issuer may call (early redeem) the product at month 6 or 9; this is modelled to occur when both metals are trading at or above their initial levels. The investor then receives par (100) plus the coupon for that period — the product ends.
- If not called and held to maturity:
- If neither gold nor silver ever fell below 69% of its initial level (no barrier event), the investor receives par (100).
- If the barrier was breached but the worst performer is still at or above its initial level at maturity, the investor also receives par (100).
- Only if the barrier was breached and the worst performer finishes below its initial level does the investor lose money, receiving
100 × worst performanceplus the final coupon.
Upside is capped at the coupon stream — the product does not participate in any rise in gold or silver prices.
Key Statistics (annualized)
| Metric | Structured Product | Underlying Benchmark (50/50 Gold–Silver) |
|---|---|---|
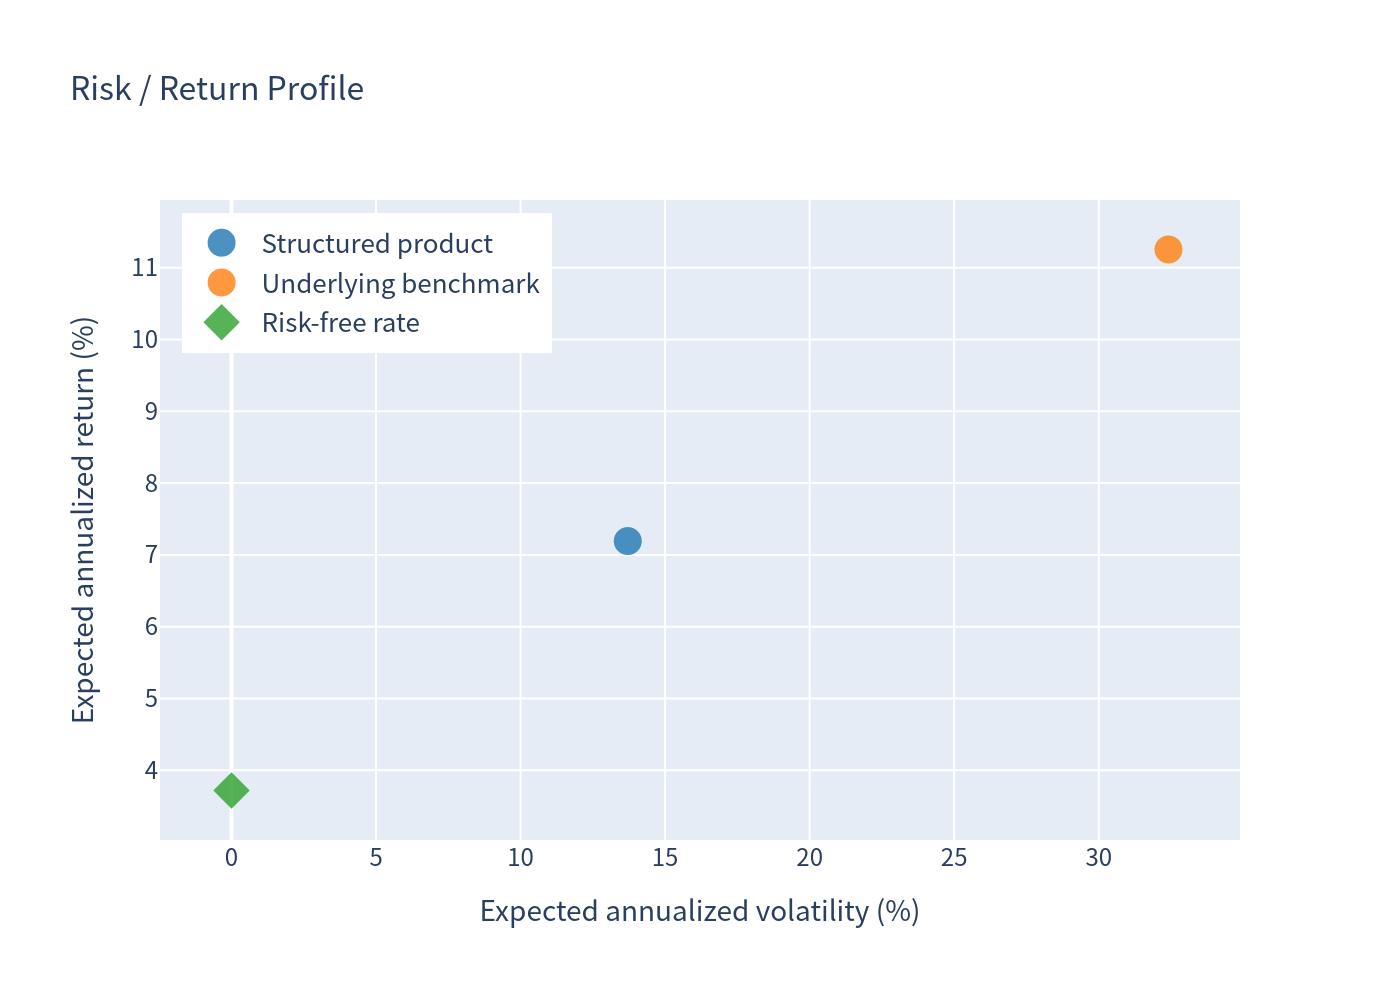
| Expected annualized return | 7.19% | 11.25% |
| Expected annualized volatility | 13.71% | 32.41% |
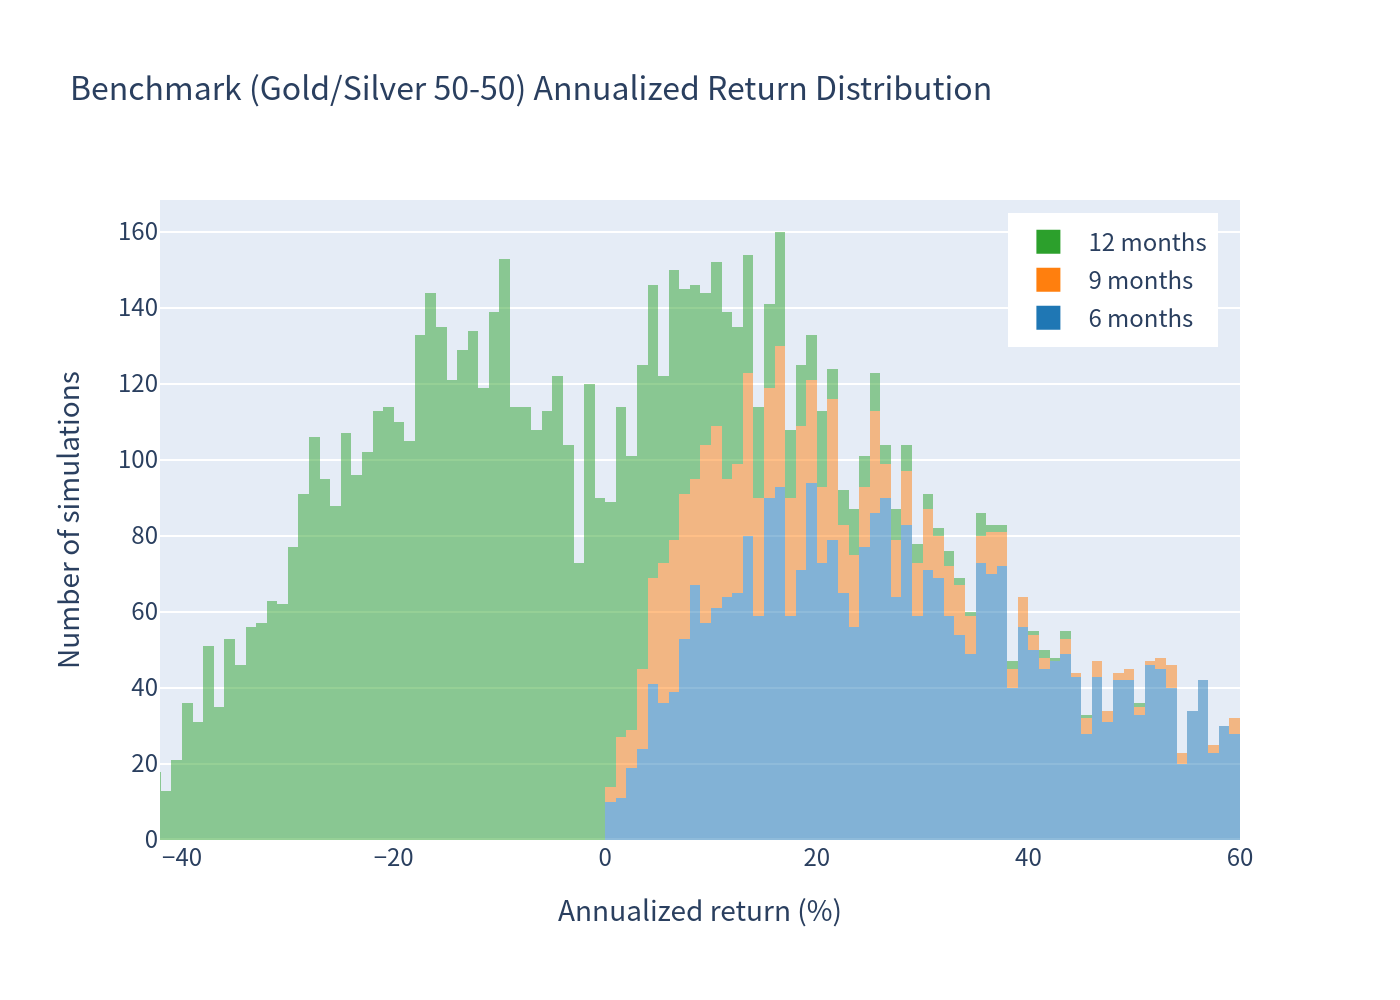
| Probability of loss | 16.15% | 39.95% |
| 99% VaR (1 year) | -38.09% | -42.09% |
| Expected total return | 4.29% | 2.97% |
Risk-free rate used for comparison: 3.72% p.a.
Charts
Simulation Outcomes (Product vs Underlying Benchmark)
Scatter plot of simulated terminal outcomes for the structured product compared with the 50/50 gold–silver underlying benchmark.
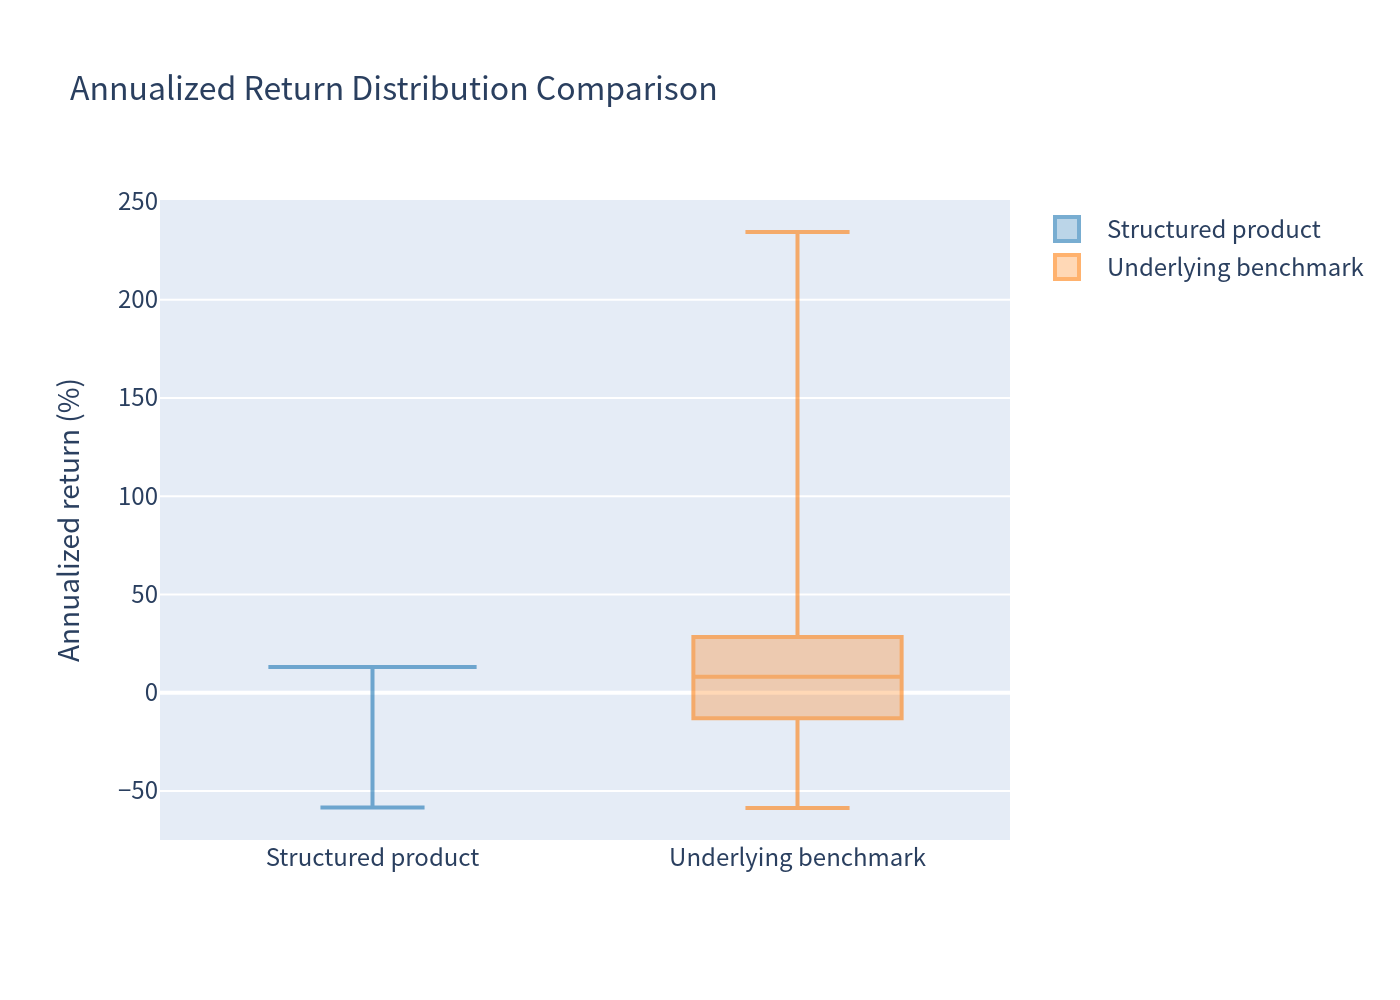
Annualized Return Distributions
Distribution of annualized returns for the structured product and the underlying benchmark.
Scenario Probabilities
Probability of the main payoff scenarios: early call, redemption at par, and loss scenarios.
Risk / Return Profile
Expected return versus risk for the structured product relative to the underlying benchmark.
Return Distribution Comparison (Box Plot)
Box-plot comparison of total return distributions for the product and the underlying benchmark.
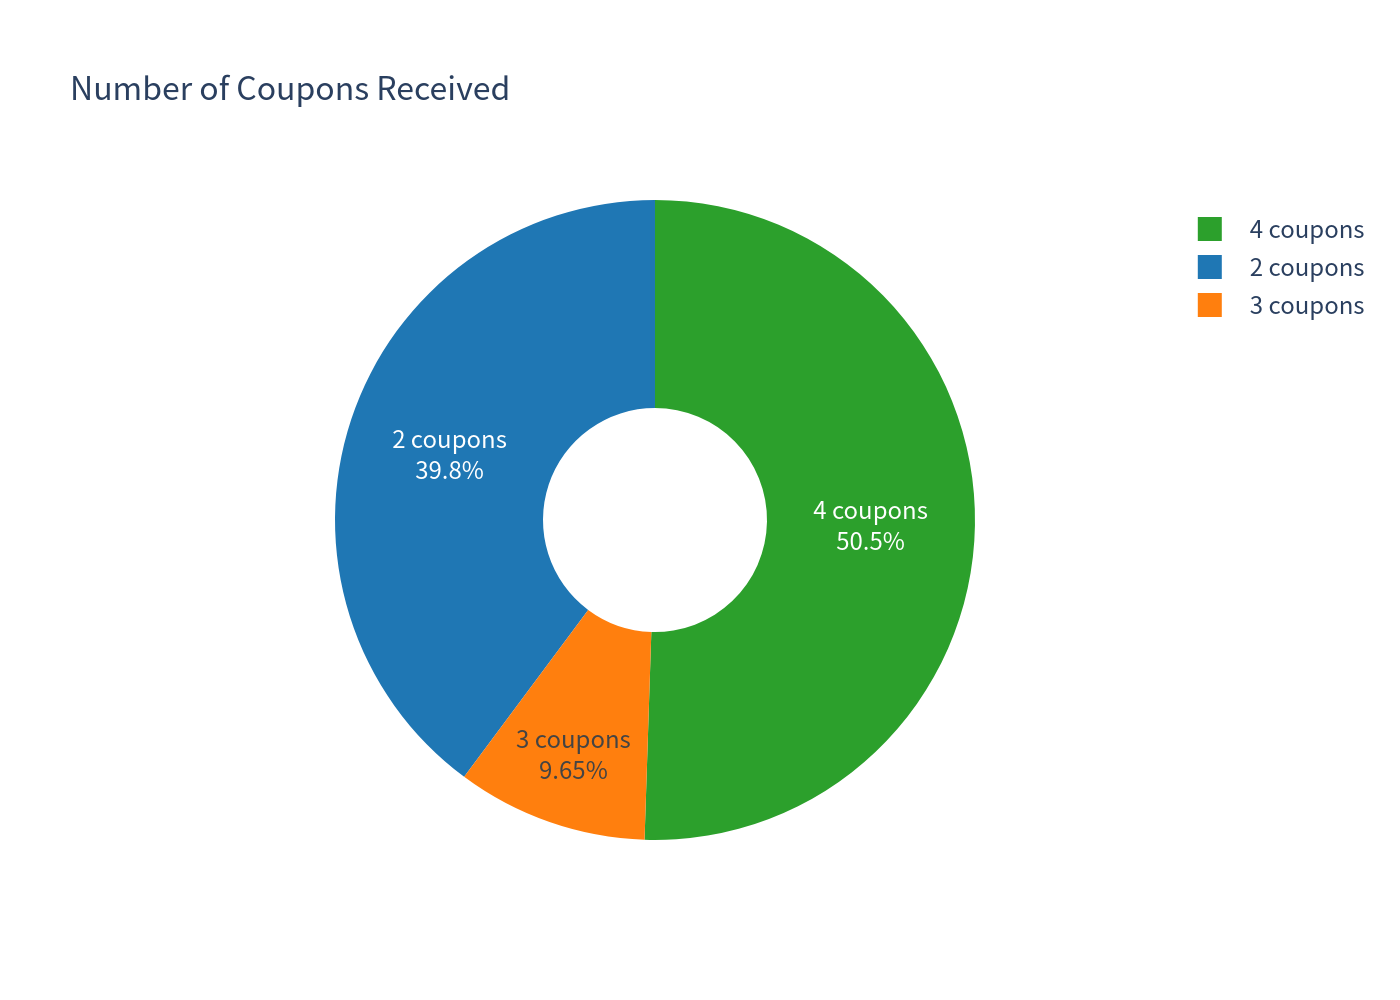
Holding Period & Coupon Outcomes
Distribution of realized holding periods and number of coupons received.
Investment Commentary
Key strengths of this product:
- Attractive fixed coupon of 13.00% p.a. (3.25% quarterly), paid in all scenarios.
- Conditional downside protection: capital is only at risk if the barrier (69%) is breached and the worst performer finishes below its initial level at maturity. This loss condition is triggered in about 16.7% of simulated paths; after the coupon cushion, about 16.2% of all paths end with a negative total return.
- Frequent early exit: in about 49.5% of paths the issuer calls the product at month 6 or 9, returning par plus coupons (a total return of 6.50% or 9.75%).
- Meaningfully lower volatility (13.71%) and lower probability of loss (16.15%) than the underlying 50/50 gold–silver basket (32.41% / 39.95%).
Considerations:
- Upside is capped: total return is limited to the coupon stream, with no participation in gold/silver appreciation.
- In loss scenarios (barrier breached and worst-of below strike at maturity), losses are leveraged to the worst performer — the simulated worst case is about -58.5%, which (since losses occur only at the 12-month maturity) represents both the total and annualized loss.
- The continuous barrier is approximated at monthly frequency in this analysis; a daily-monitored barrier could trigger slightly more often.
- As with all structured products, investors are exposed to the credit risk of the issuer/guarantor.
This report is for information only and does not constitute investment advice.