
9.00% p.a. Multi Barrier Reverse Convertible on Carrefour, Danone, LVMH (Issuer-Callable)
Headline Simulation Results
7.55%
Expected Annualized Return
3.59%
Probability of a Negative Return
-32.35%
99% Confidence VaR (1-Year, Annualized)
| Metric | Value |
|---|---|
| Expected annualized return | 7.55% |
| Expected total return (over realized holding period) | 7.91% |
| Expected holding period | 13.09 months (~1.09 years) |
| Probability of a negative return | 3.59% |
| 99% confidence VaR (1-year, annualized) | -32.35% |
| Probability of outperforming the risk-free rate | 96.41% |
Key takeaway: The product delivers a high, mostly stable coupon stream (9% p.a., paid quarterly) with a low probability of loss (≈3.6%). Its downside protection is conditional: losses occur only if any of the three underlyings falls more than 51% below its initial level, and in that case the investor absorbs the full decline of the worst-performing stock at maturity.
How It Works (Layman Explanation)
- Fixed coupons: The investor receives EUR 22.50 per EUR 1,000 (2.25% of notional) every quarter — i.e. 9.00% p.a. — regardless of how Carrefour, Danone and LVMH perform, for as long as the product is outstanding.
- Issuer call: The issuer may redeem the product early at each quarterly observation date, returning 100% of the notional plus the coupon then due. In the simulation, we assume the issuer calls when the worst-performing stock is back at or above its starting level (a standard issuer-optimal behaviour for a high-coupon reverse convertible).
- Maturity without a barrier event: If none of the three stocks ever traded at or below 49% of its starting level, the investor receives 100% of the notional back.
- Maturity with a barrier event: If any stock traded at or below 49%:
- If the worst-performing stock at maturity is at or above its starting level → the investor still receives 100%.
- If the worst-performing stock at maturity is below its starting level → the investor receives shares of that worst stock (cash equivalent of its final level), absorbing the full loss of the worst performer.
In short: high fixed income while the market behaves, conditional protection against a severe (-51%) shock, but full worst-of downside if that shock actually occurs.
Key Statistics — Structured Product vs Underlying Basket
| Metric | Structured Product | Underlying Basket (incl. dividends) |
|---|---|---|
| Expected annualized return | 7.55% | 17.79% |
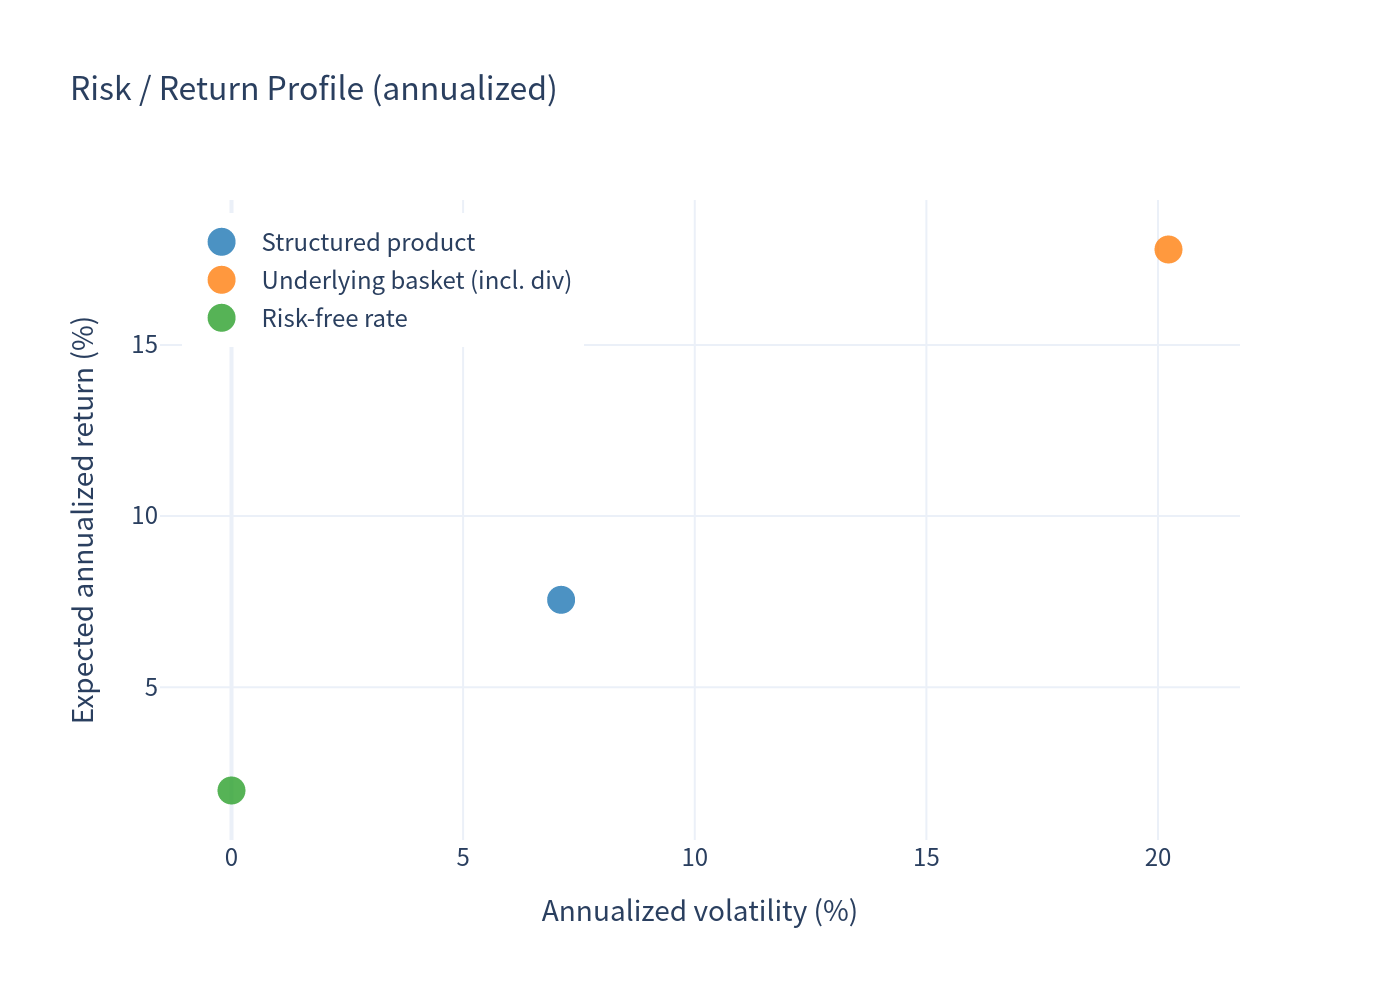
| Expected annualized volatility | 7.12% | 20.23% |
| Probability of loss | 3.59% | 26.98% |
| 99% confidence VaR (1-year, annualized) | -32.35% | -20.38% |
| Expected total return (over realized holding period) | 7.91% | 8.26% |
Reading the table: the product converts a volatile equity payoff into a much lower-volatility income stream. It sharply reduces the probability of loss (3.6% vs 27.0%) but caps upside, so in strong up-markets the underlying basket easily outperforms it. Note the underlying's annualized return is measured over the same (often short, up-market) holding periods in which the product is called — see the caveat below.
Charts
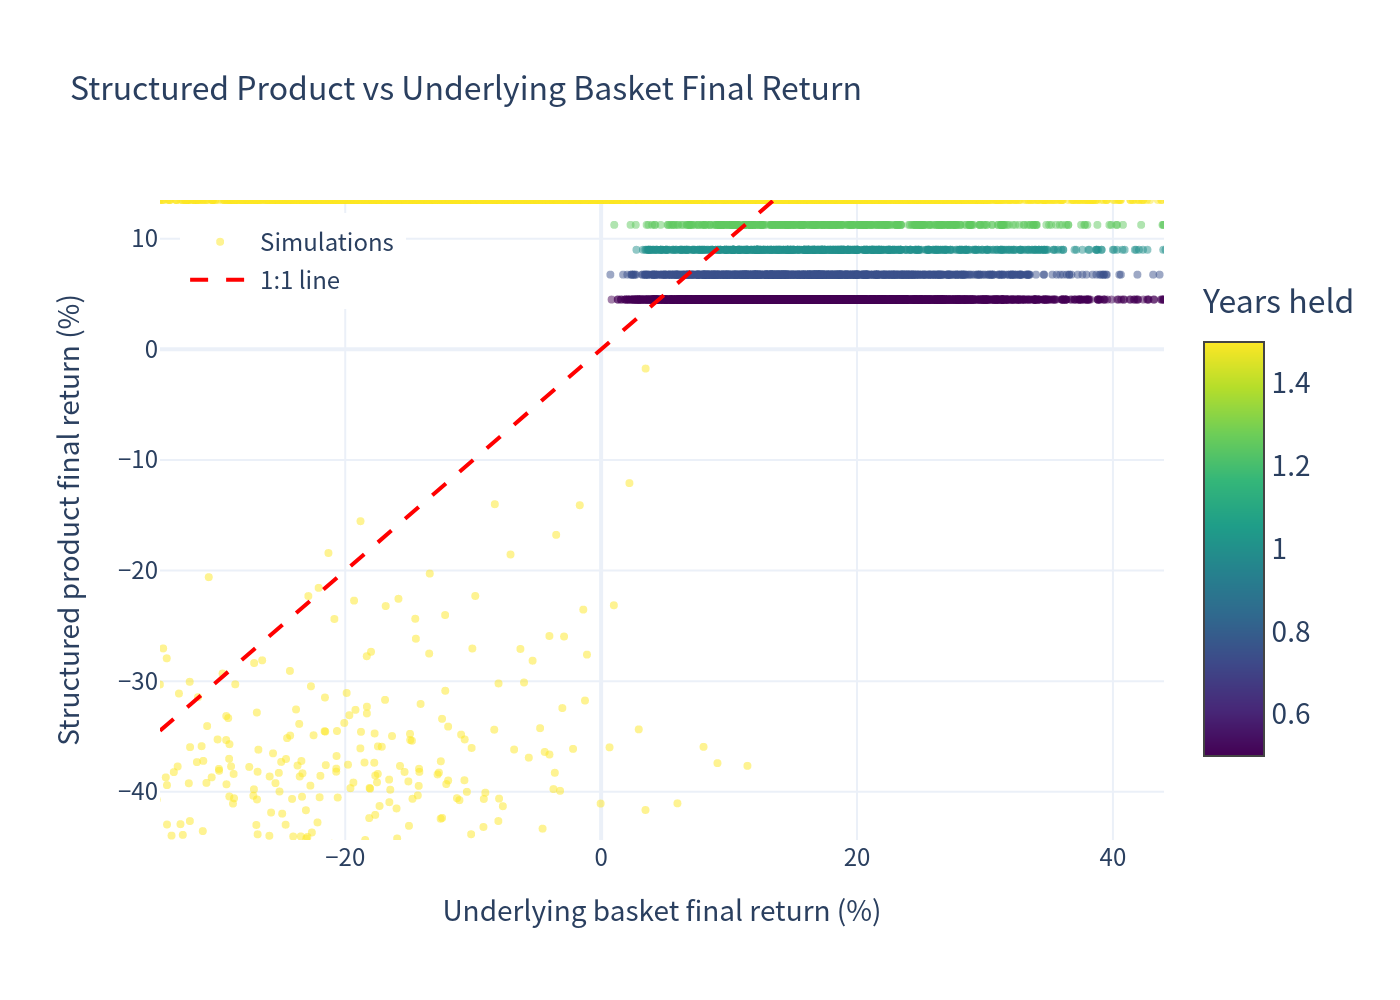
Simulation Outcomes
Scatter plot of simulated scenarios — total return versus underlying performance.
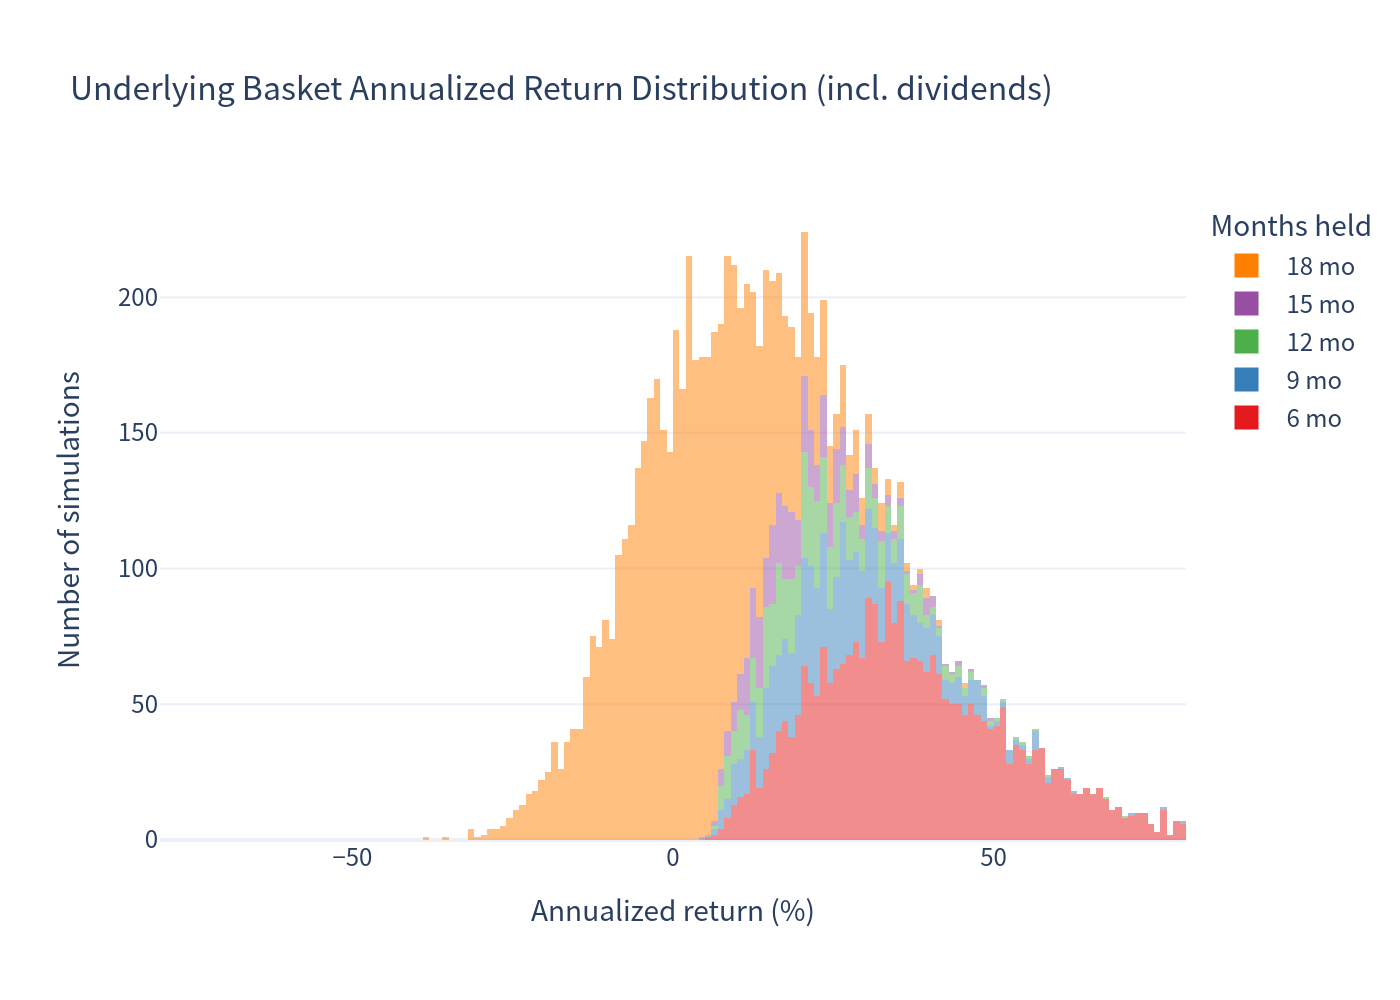
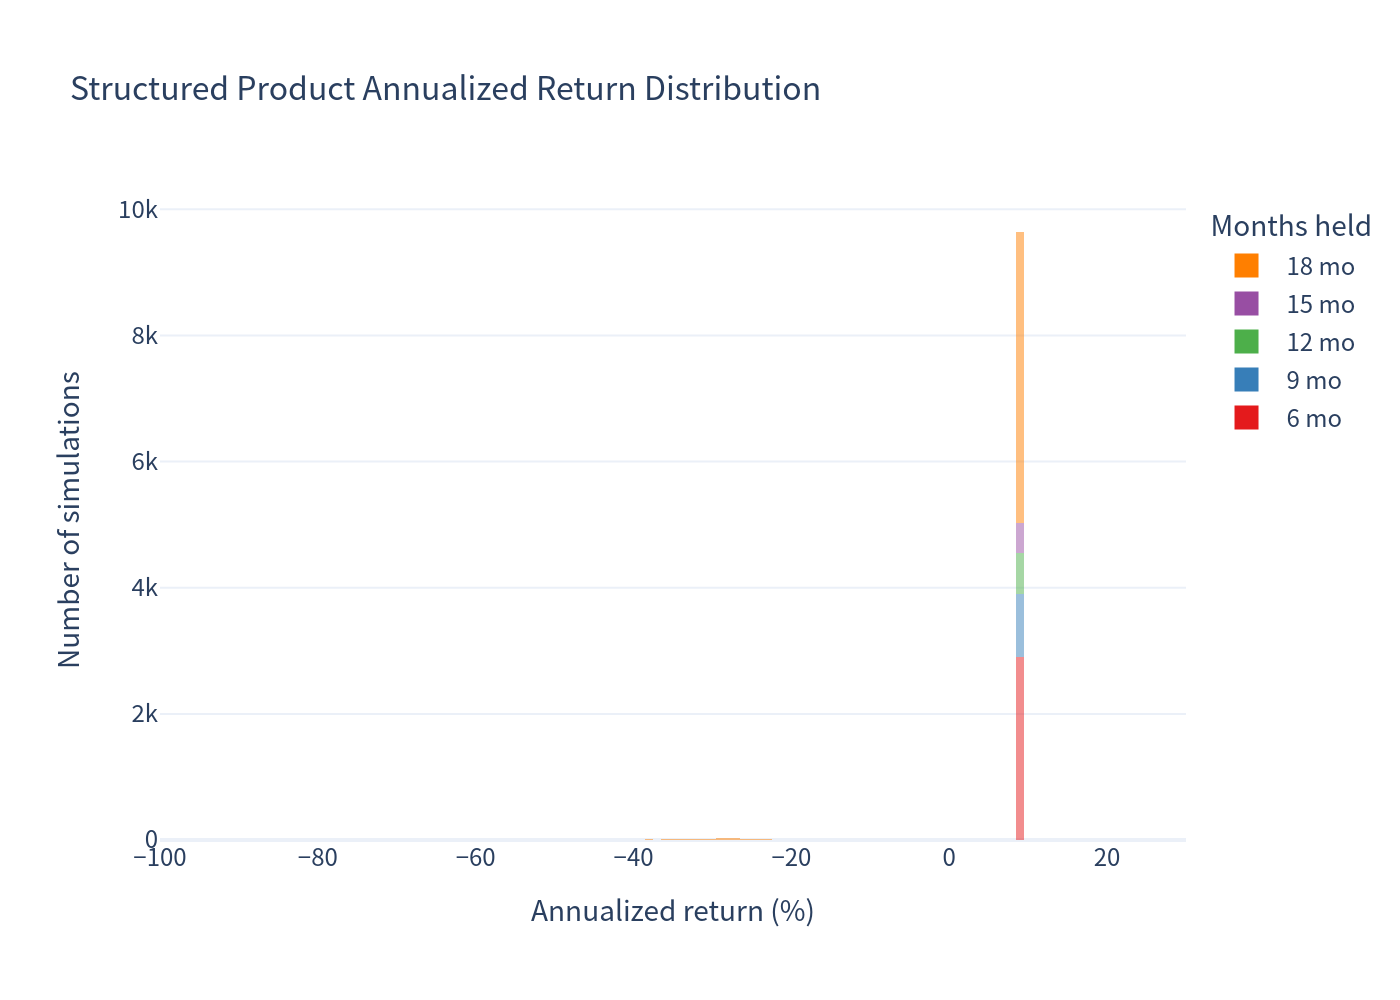
Annualized Return Distributions
Distribution of annualized returns for the underlying basket and the structured product.
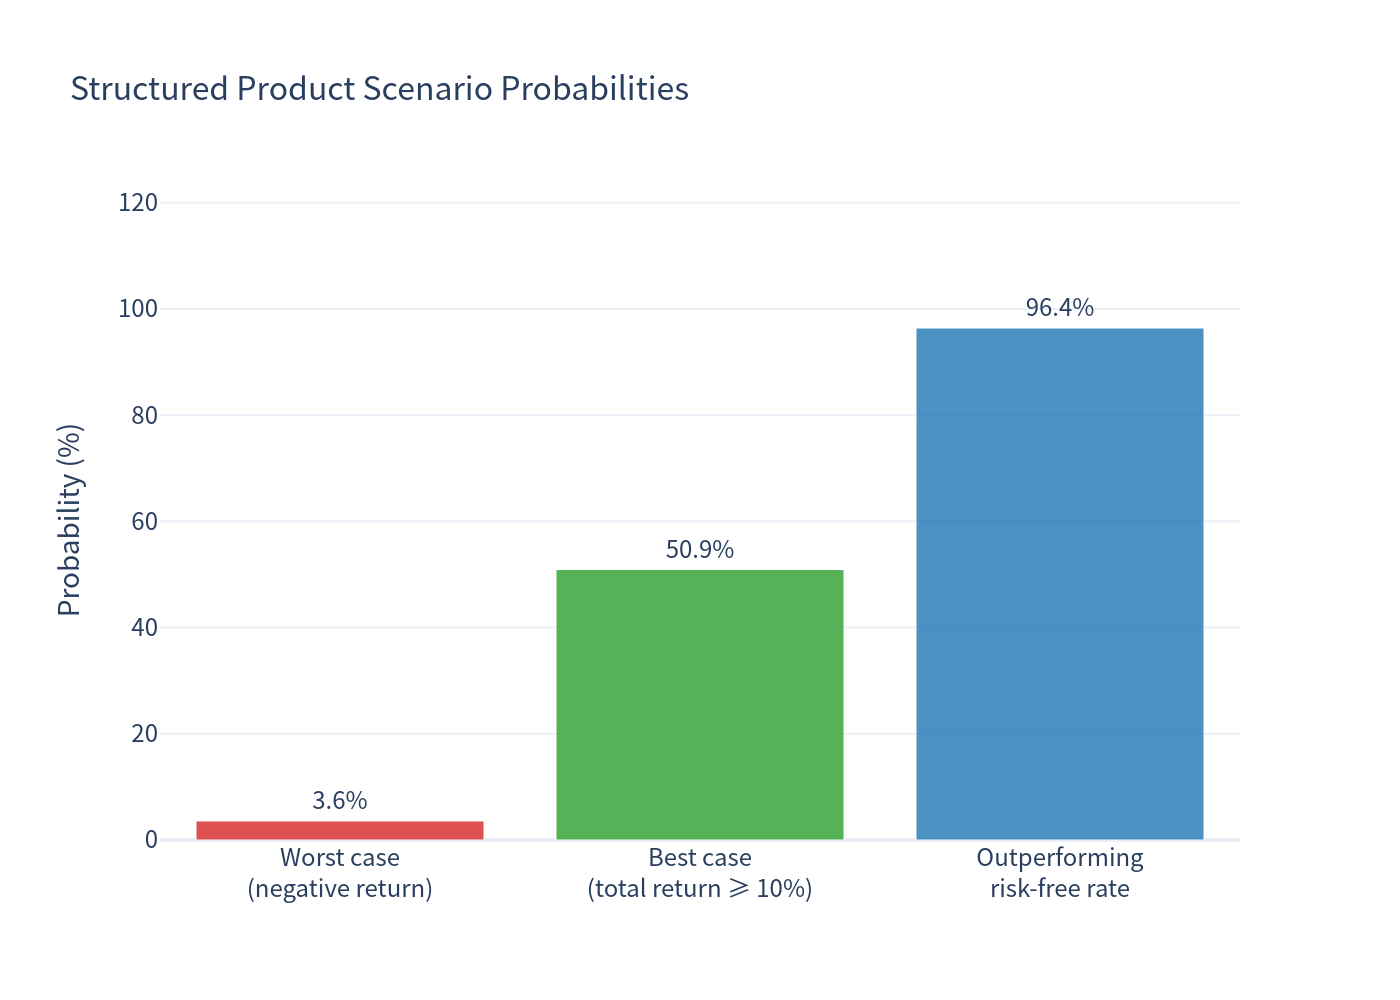
Scenario Probabilities
Likelihood of the various outcome scenarios across simulated paths.
Risk / Return Profile
Positioning of the structured product relative to the underlying basket on a risk-return basis.
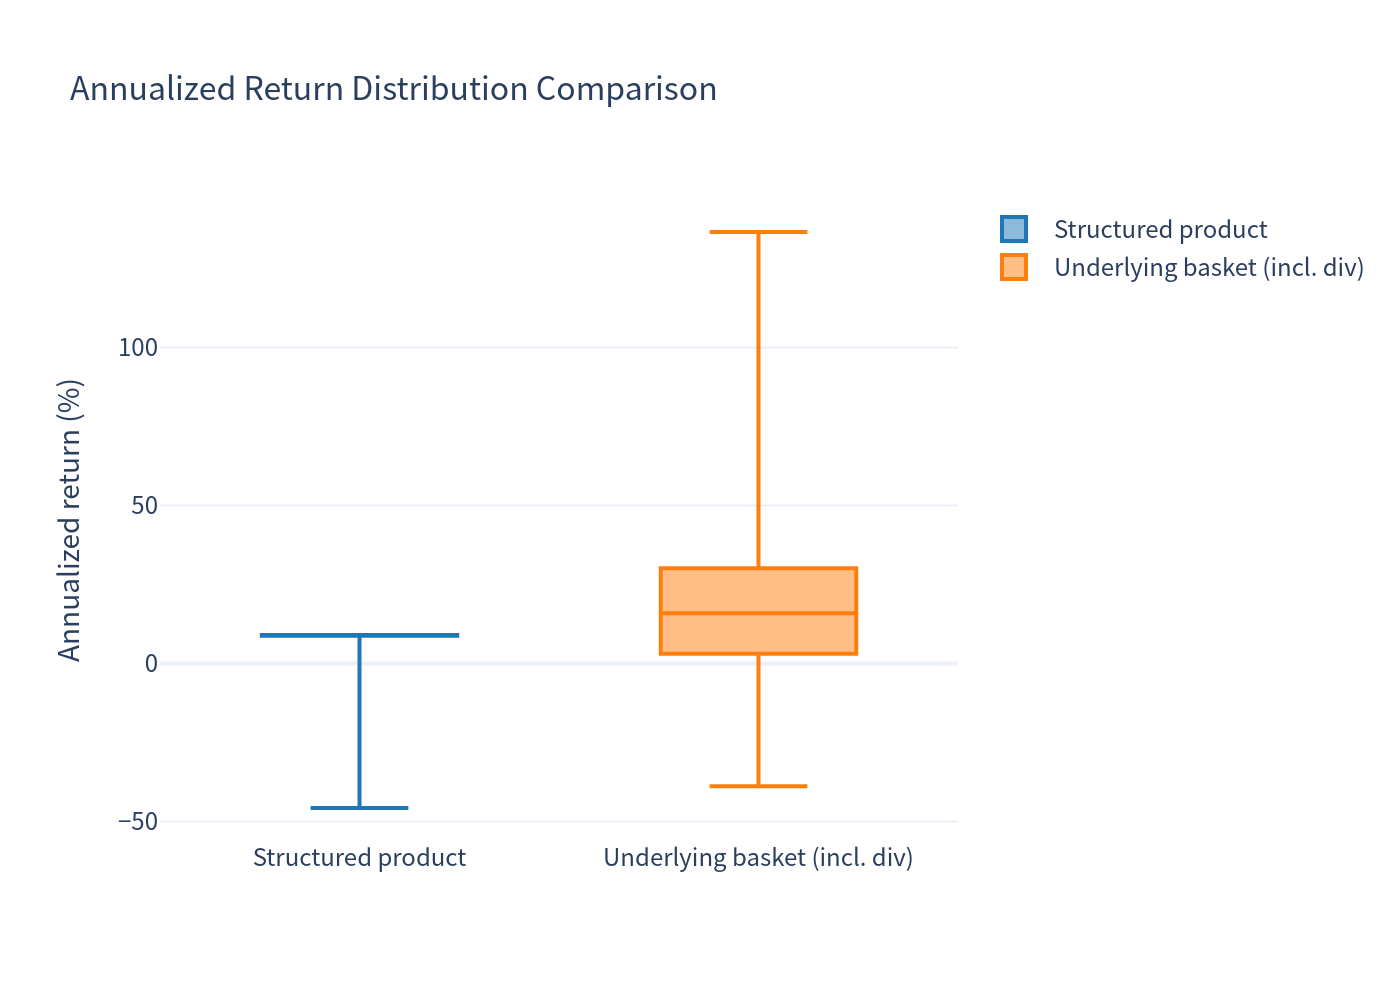
Distribution Comparison
Boxplot comparison of return distributions — product versus underlying basket.
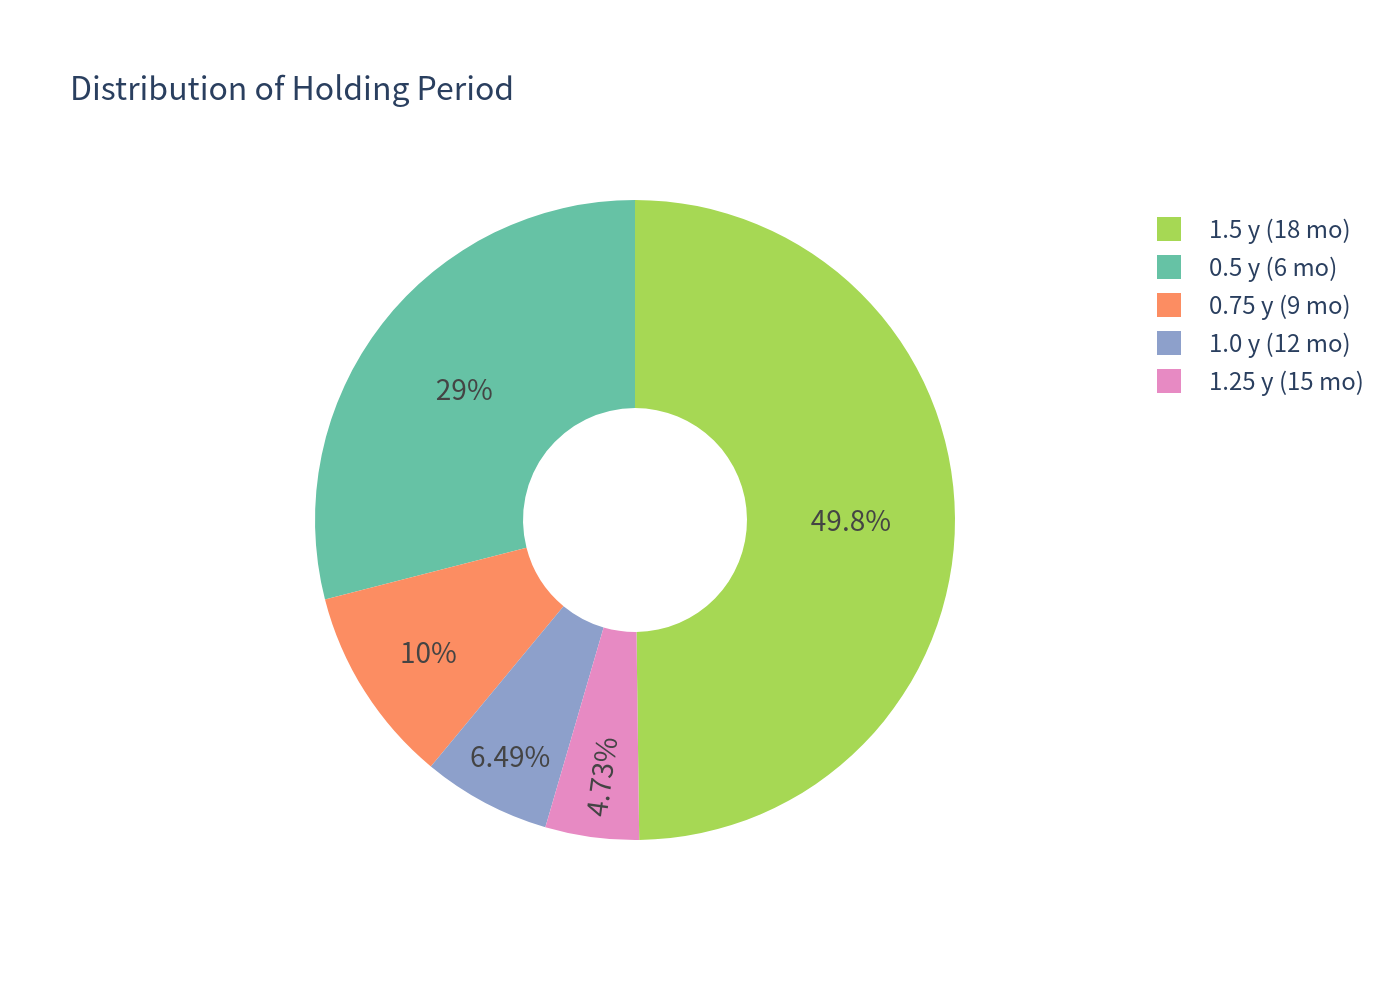
Holding Period & Coupon Distributions
Distribution of realized holding periods in years.
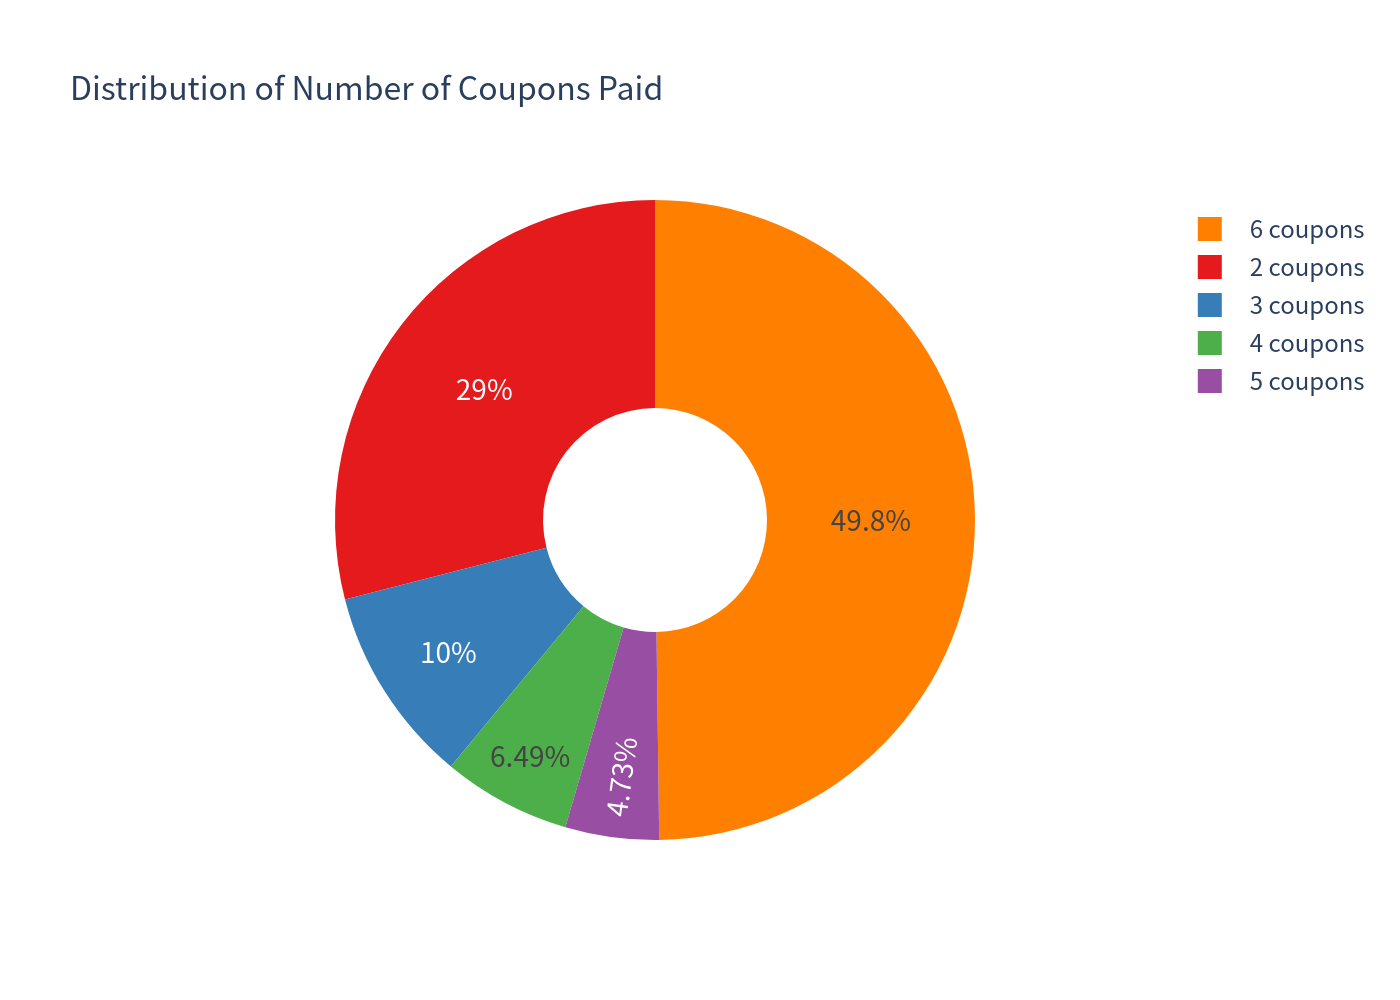
Distribution of the number of coupons received.
Investment Commentary
Attractive Features (Pros)
- High contractual coupon of 9.00% p.a. paid quarterly (2.25% per period), independent of underlying performance — a yield well above the EUR risk-free rate (≈2.0%).
- Low loss probability: in only ≈3.6% of simulated scenarios does the investor lose money; ≈50.9% of scenarios deliver a total return of at least 10%.
- Deep barrier (49%): the barrier is breached only if any one of the three stocks falls more than 51% below its initial level (an any-of condition); the worst-of conversion at maturity then applies.
- Improved risk profile vs. direct equity investment: annualized volatility of the product (7.12%) is far below that of the underlying basket (≈20%), and the probability of loss is ~7.5× lower.
- Issuer call is generally friendly to the investor: early redemption returns full notional plus coupon and shortens credit exposure.
Considerations (Cons)
- Capped upside: the coupon is the only compensation; when the market rallies, the product lags the underlying basket (visible in the scatter plot above the 1:1 line).
- Worst-of conversion tail risk: when the barrier is breached, the investor bears the full decline of the worst stock, not the basket average — this is why the product's 99% VaR (-32.35%) is worse than the underlying's (-20.38%), even though losses are far less frequent.
- Early call reduces total coupons: the issuer called in ~50% of simulated paths, shortening the average holding period to ~13 months (e.g., 29% of paths last only 6 months / 2 coupons).
- Credit risk of the issuer (Leonteq Securities AG) and guarantor (Aargauische Kantonalbank) applies in addition to market risk.
Caveats on the Numbers
- Short holding periods & annualization: because many simulations end early (6–15 months), annualized figures can look extreme — especially for the underlying, whose early exits coincide with strong up-markets (its mean annualized return of 17.79% reflects this conditioning). The product's annualized return is capped near 9% and is far less sensitive. Total returns and holding periods should be interpreted alongside annualized figures.
- Barrier observation granularity: the contract observes the barrier continuously, but the monthly-stepped simulation checks it monthly, which may understate barrier-event frequency (simulated ≈3.7%).
- The issuer-call trigger is not defined in the term sheet and is modeled under a stated assumption (call when worst performer ≥ 100% of initial level).
This analysis is a quantitative evaluation based on simulated market scenarios and stated modeling assumptions. It is not investment advice and does not constitute a suitability assessment.