
13.20% p.a. Multi Barrier Reverse Convertible — Simulation Analysis
Headline Simulation Results
| Metric | Structured Product |
|---|---|
| Expected annualized return | 2.67% |
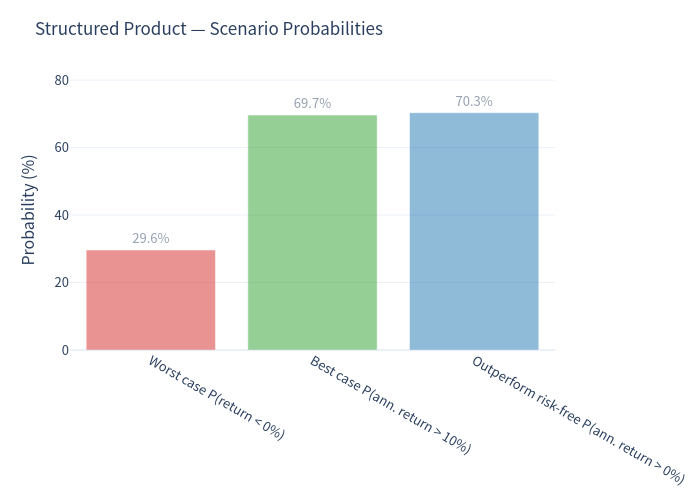
| Probability of a negative return | 29.65% |
| 99% confidence VaR (1-year, annualized) | −38.90% |
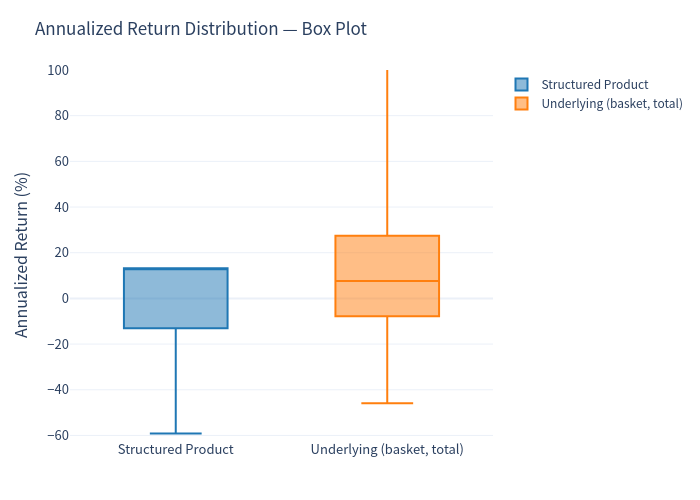
Across 10,000 Monte-Carlo scenarios the note paid coupons in every path while alive, but ~30% of outcomes ended in a loss (barrier breached and the worst-of finished well below strike, so coupons no longer offset the principal loss). The product was called early in 29.6% of paths; average holding period was 12.8 months out of a maximum 15. Expected total return over the realised holding period was +1.33%.
About the Product (how it works)
- You buy a note at 100% of nominal and receive a fixed 13.20% p.a. coupon, paid quarterly (five coupons of 3.30% = 16.50% in total over the 15-month maximum term), regardless of how the shares move — as long as the note is alive.
- The note is linked to three Swiss shares and the redemption looks at the worst-performing one.
- Downside protection: the nominal (100%) is returned at maturity as long as none of the three shares ever falls to 59% of its starting level (a continuous barrier) during the note's life.
- If the 59% barrier is touched at any time, protection is lost: at maturity you receive the worse of par (if the worst share is back at/above its start) or the actual performance of the worst share (full downside, via share delivery). Upside is always capped at par.
- The issuer may call the note on one of three quarterly observation dates (months 6, 9, 12) and repay nominal plus the coupon; in practice the call removes upside in strong markets. (Modelled as a rational call when all shares are at/above their starting level — see below.)
Key Statistics
Simulated outcomes (10,000 paths, ~0.00% CHF risk-free rate)
| Metric | Structured Product | Underlying basket (total return, same horizon)* |
|---|---|---|
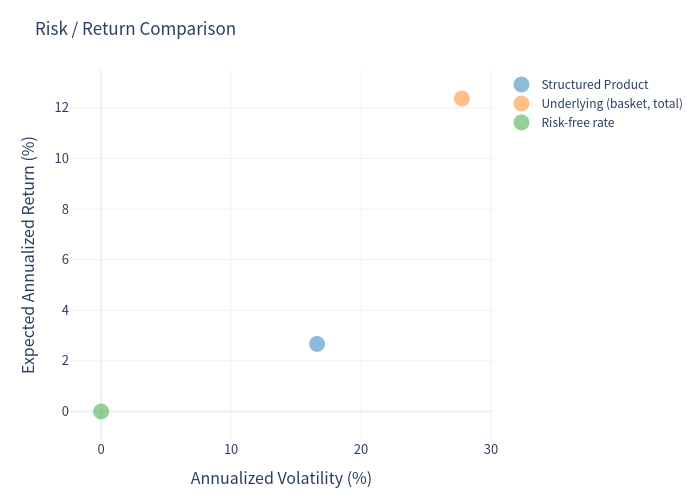
| Expected annualized return | 2.67% | 12.36% |
| Expected annualized volatility | 16.62% | 27.76% |
| Probability of loss | 29.65% | 38.12% |
| 99% VaR (1-year, annualized) | −38.90% | −32.47% |
| Expected total return (holding period) | 1.33% | 5.36% |
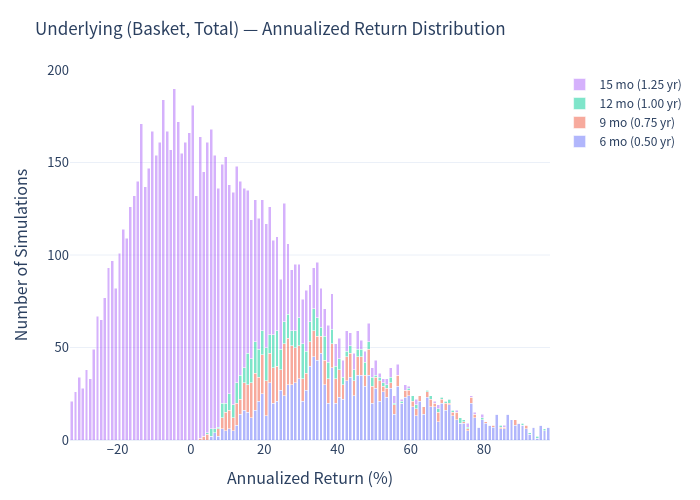
*The underlying column is measured at the month each product path ended (same horizon). Because early calls are triggered by strong share performance and short holding periods are annualised linearly, this figure is inflated; on a clean buy-and-hold 15-month basis the equal-weight basket's expected annualized total return is ≈ 6.72% (median 4.73%, probability of loss 44.9%).
Underlyings (historical)
| Share | Bloomberg | Annualised volatility | Dividend yield |
|---|---|---|---|
| Accelleron Industries AG | ACLN SW | 32.5% | 2.37% |
| Autoneum Holding AG | AUTN SW | 35.9% | 2.54% |
| Huber + Suhner AG | HUBN SW | 30.1% | 1.30% |
| Equal-weight basket | — | — | ≈ 2.07% |
- Continuous worst-of barrier-event probability ≈ 31.6% (standalone: Accelleron 9.0%, Huber+Suhner 13.9%, Autoneum 16.2%).
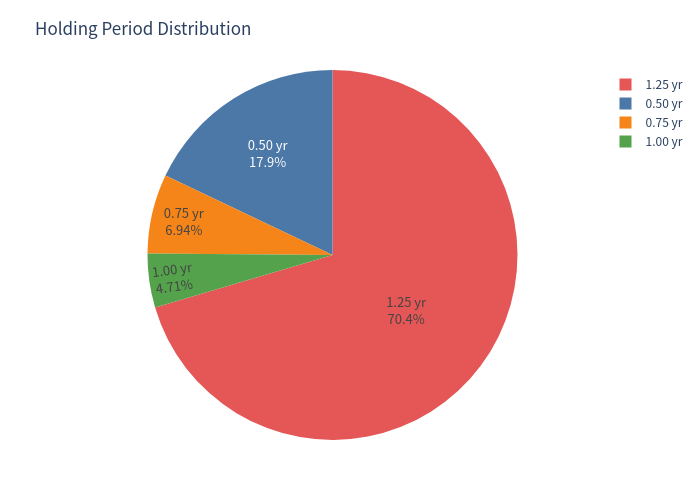
- Outcome mix: held to maturity (15m) 70.4%, called at month 6/9/12 17.9% / 6.9% / 4.7%.
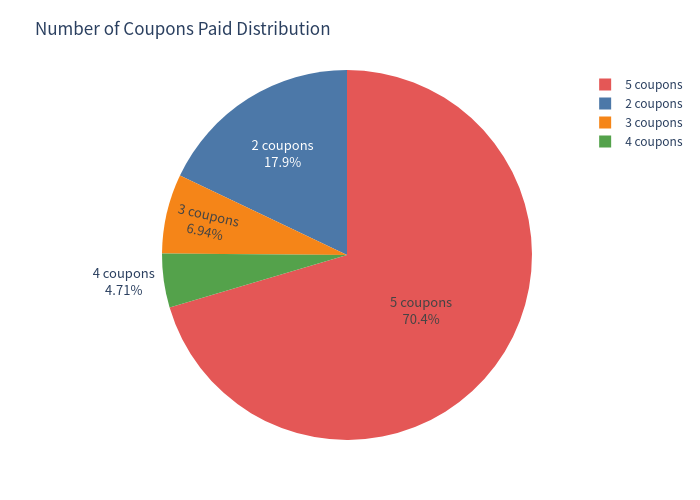
- Coupons received: 5 coupons 70.4%, 4 coupons 4.7%, 3 coupons 6.9%, 2 coupons 17.9%.
Charts
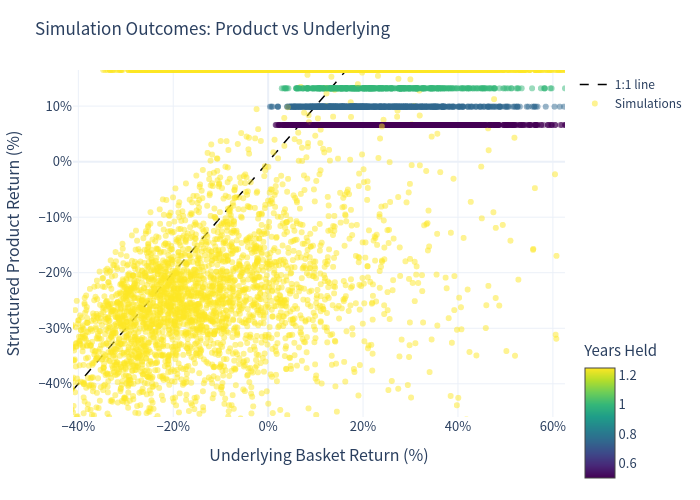
Simulation outcomes — product vs underlying
Each point is one scenario; colour shows years held. Points below the dashed 1:1 line underperform the basket.
Scenario probabilities
Return distribution — underlying basket (annualised)
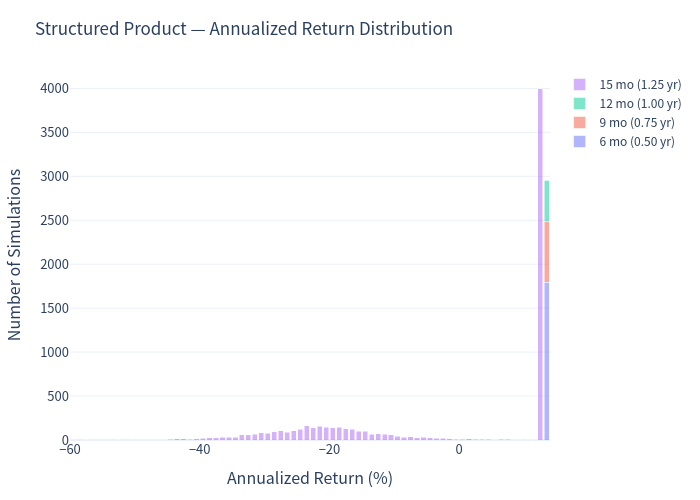
Return distribution — structured product (annualised)
The product's return is tightly capped near the coupon (~13% annualised) when protected, with a discrete loss tail when the barrier is breached.
Risk / return comparison
Annualised return — box plot
Holding period distribution
Number of coupons paid
Investment Commentary
Points in favour
- High, unconditional coupon: 13.20% p.a. (16.50% total) is paid in every scenario while the note is alive, providing a large buffer before any loss.
- Meaningful downside cushion: the 59% barrier is deep; in the majority of simulated paths (≈68%) protection holds and par is returned, and the total coupon pushes the note into profit even in mild declines.
- Lower realised volatility than the shares: 16.6% vs 27.8% for the equal-weight basket, with a lower probability of loss (29.7% vs 38–45%).
- Defined, capped risk profile suited to a range-bound or mildly bullish view on the three Swiss industrials.
Points to consider
- Worst-of exposure concentrates risk: the redemption depends on the single weakest share, so the downside tail (99% VaR −38.9%) is wider than that of the equal-weight basket, despite lower average volatility.
- Capped upside via the issuer call: when the shares rally (all above their starting levels), the note is likely called and you forgo further gains above the coupon.
- Barrier is continuous: a single intraday dip to 59% removes protection; if the worst share then recovers to/above its starting level by maturity, par is still returned, otherwise you take the worst share's downside.
- Return give-up vs direct equity: expected annualized return (2.67%) trails a buy-and-hold basket (~6.7% annualised total return) — the trade for the coupon and protection.
- Because many paths are called early, annualised figures can look extreme; total return and holding period should be read together.