
USD Autocall Reverse Convertible — Simulation Analysis
Worst-of NVIDIA Corporation · ASML Holding N.V. · SK hynix Inc. (ADR)
Headline Simulation Results
| Metric | Result |
|---|---|
| Expected annualized return | 10.31% |
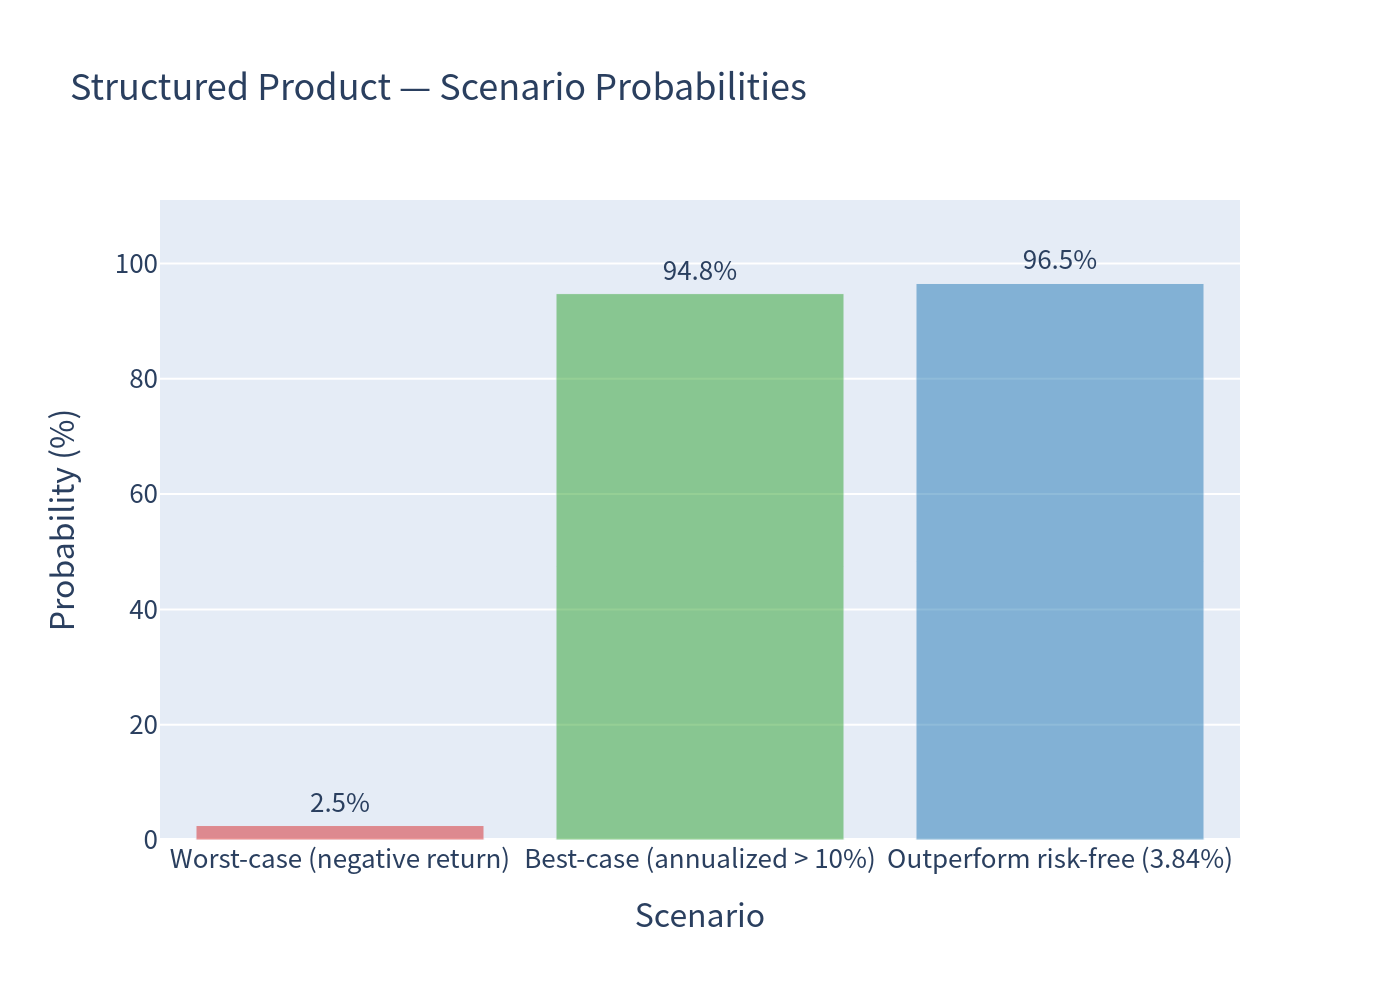
| Probability of a negative return | 2.51% |
| 99% confidence VaR (1-year, annualized) | -10.36% |
Over the full sample of simulated outcomes the note returns a positive total return in ~97.5% of paths, most of which land close to the maximum coupon-driven outcome (11%). The loss tail is driven entirely by the worst-of downside branch (see below).
- Expected holding period: 10.11 months (0.84 years)
- Expected total return over the realized holding period: 8.58% (mean per-path total return)
- Expected annualized return (mean of per-path annualized return): 10.31%
Because many paths are called early (short holding period), annualized figures should be read together with the total-return and holding-period figures above. In paths closed after only 6 months, an identical 5.50% cash-on-cash gain annualizes to ~11%; this linear annualization can make short-dated outcomes look large relative to a full-year view.
How the Product Works (plain language)
This is a yield-enhancing “reverse convertible” with an early-redemption (autocall) feature, linked to the worst performer of three semiconductor stocks (NVIDIA, ASML, SK hynix ADR).
- Coupon: The note pays a fixed 2.75% per quarter (11.00% per annum) as long as it is outstanding – independent of how the stocks perform. If the note is redeemed early, the coupon for that period is still paid.
- Early redemption (autocall): On two observation dates (March 2027 and June 2027), if all three stocks are at or above 100% of their starting level, the note is redeemed early at par (100%) plus the coupon.
-
Maturity (if not called):
- If all three stocks finish at or above 53.25% of their starting level (i.e., none fell more than ~46.75%), you receive 100% of principal plus the final coupon.
- If any one stock finishes below 53.25% of its starting level, you receive the worst-performing stock (or its cash equivalent). Below the barrier the redemption value falls at about 1.88x the rate of the worst stock’s further decline (a 10% slide below the 53.25% barrier cuts the redemption value by roughly 18.8%), so losses can be significant.
In short: you collect an attractive fixed income, but you are effectively selling downside protection on the weakest of three high-volatility chip stocks.
Key Statistics: Note vs. Underlying
The underlying benchmark is an equal-weight basket of the three stocks (total return, dividends included).
| Metric | Structured Product | Underlying Basket (Total Return) |
|---|---|---|
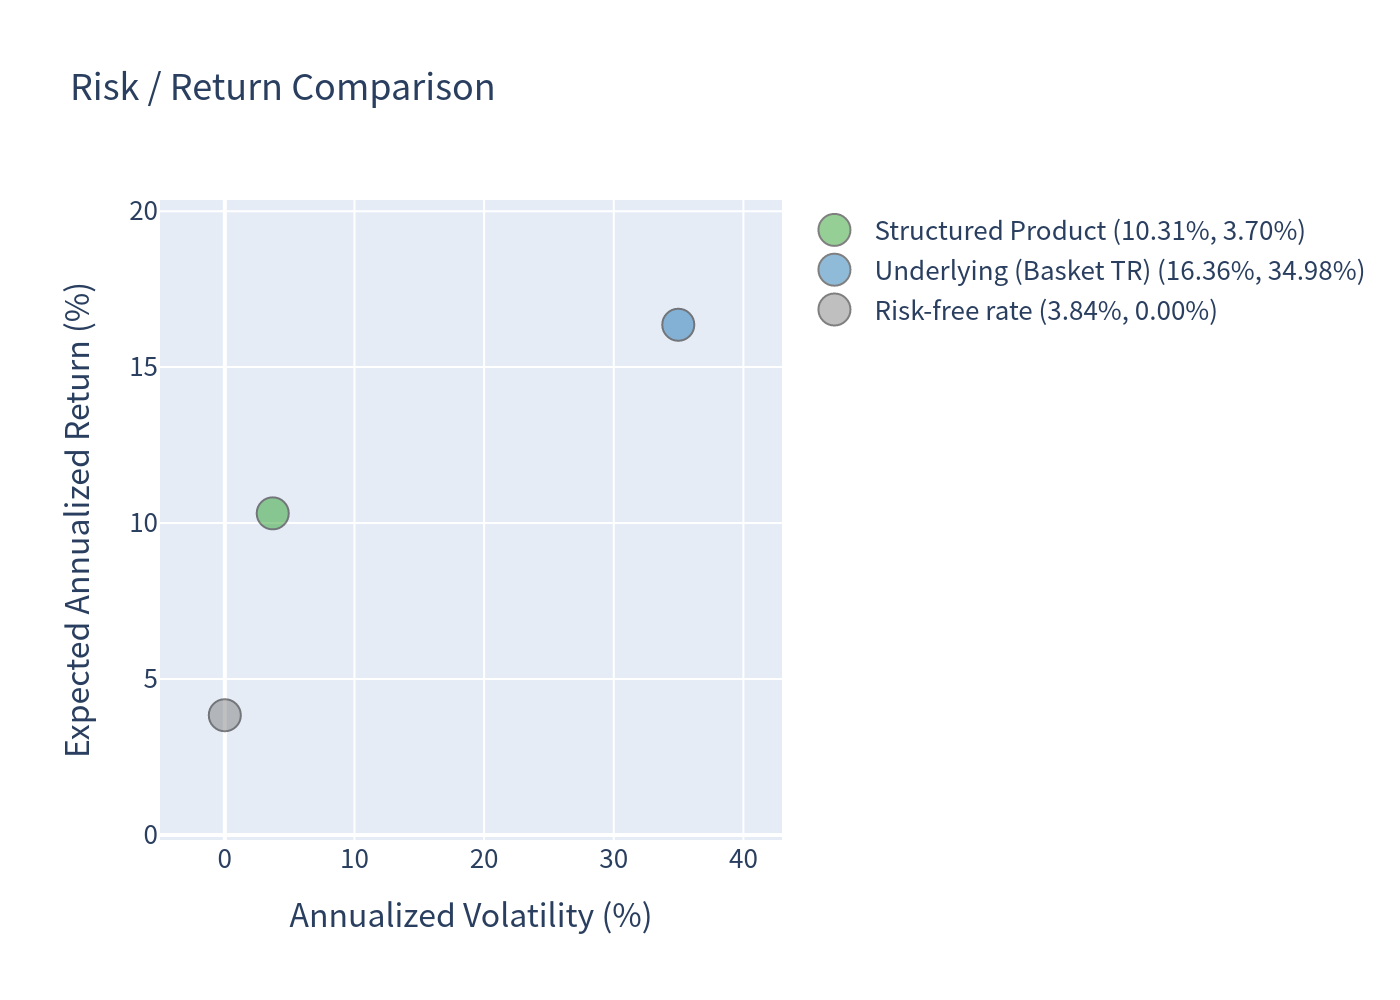
| Expected annualized return | 10.31% | 16.36% |
| Expected annualized volatility | 3.70% | 34.98% |
| Probability of loss | 2.51% | 37.40% |
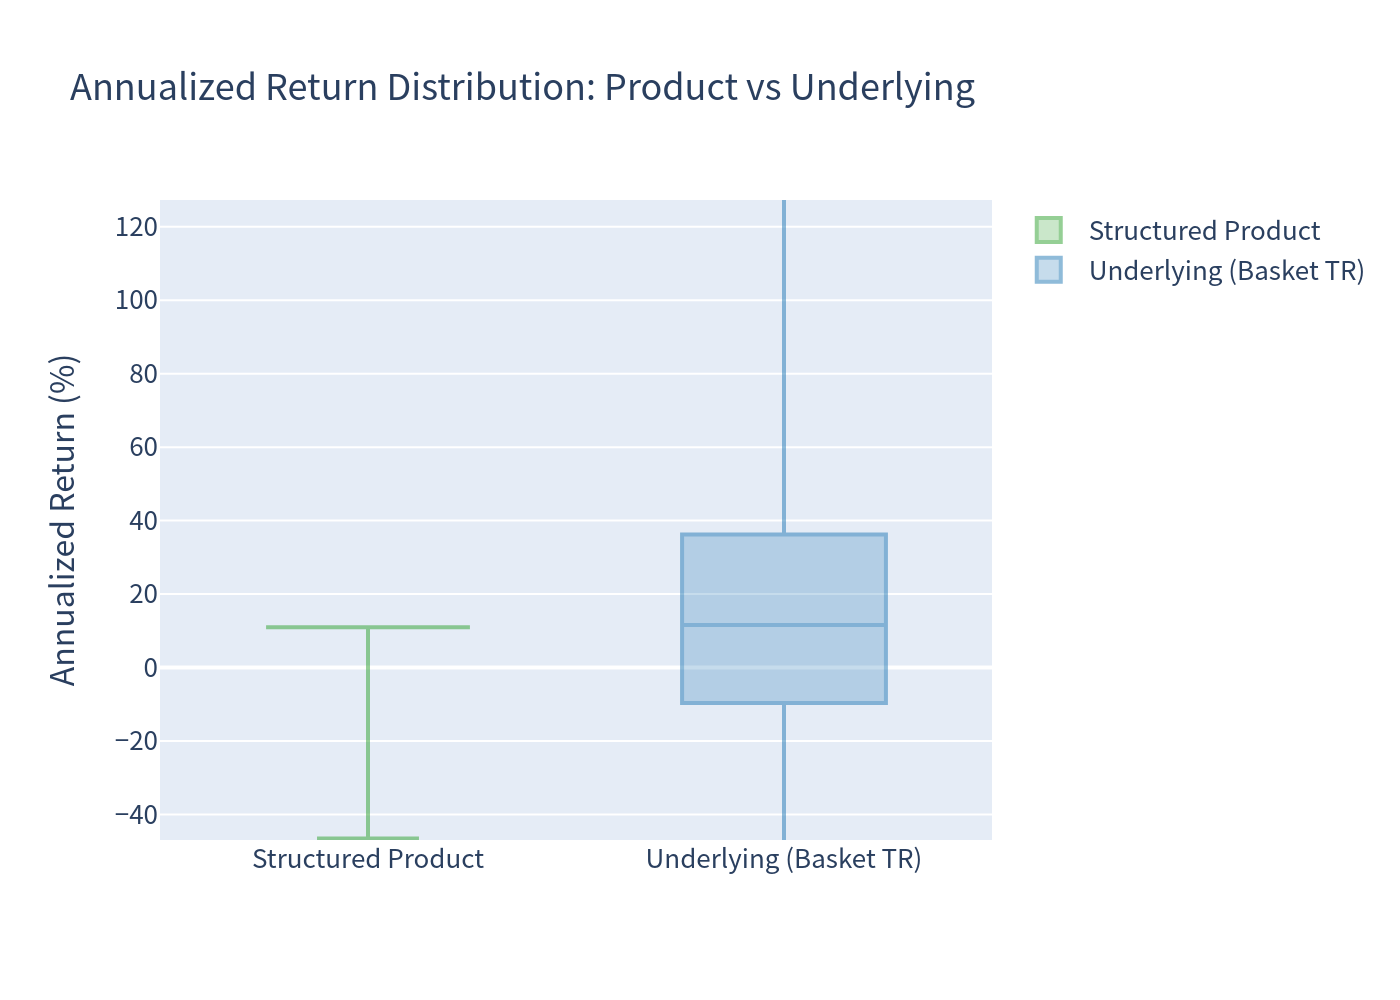
| 99% VaR (1-year, annualized) | -10.36% | -41.93% |
The note delivers a much smoother return stream than the basket: far lower volatility and tail risk, at the cost of capping upside at the coupon. Expected return sits well above the ~3.84% risk-free rate but below the raw equity basket (whose higher expected return comes with ~35% volatility and a ~37% chance of a loss).
Early-redemption and coupon outcomes
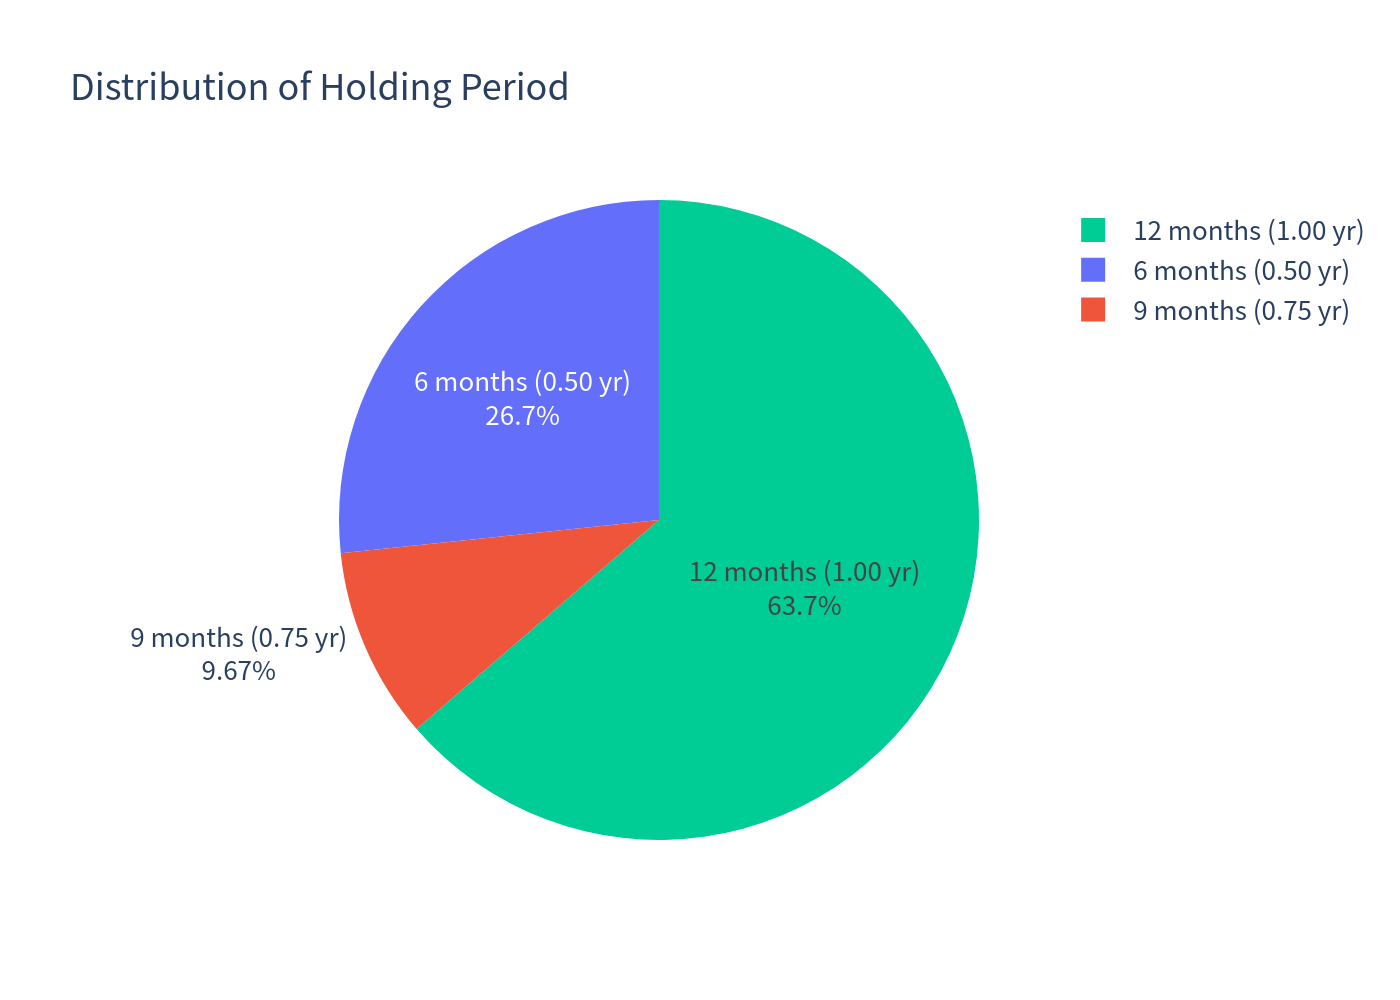
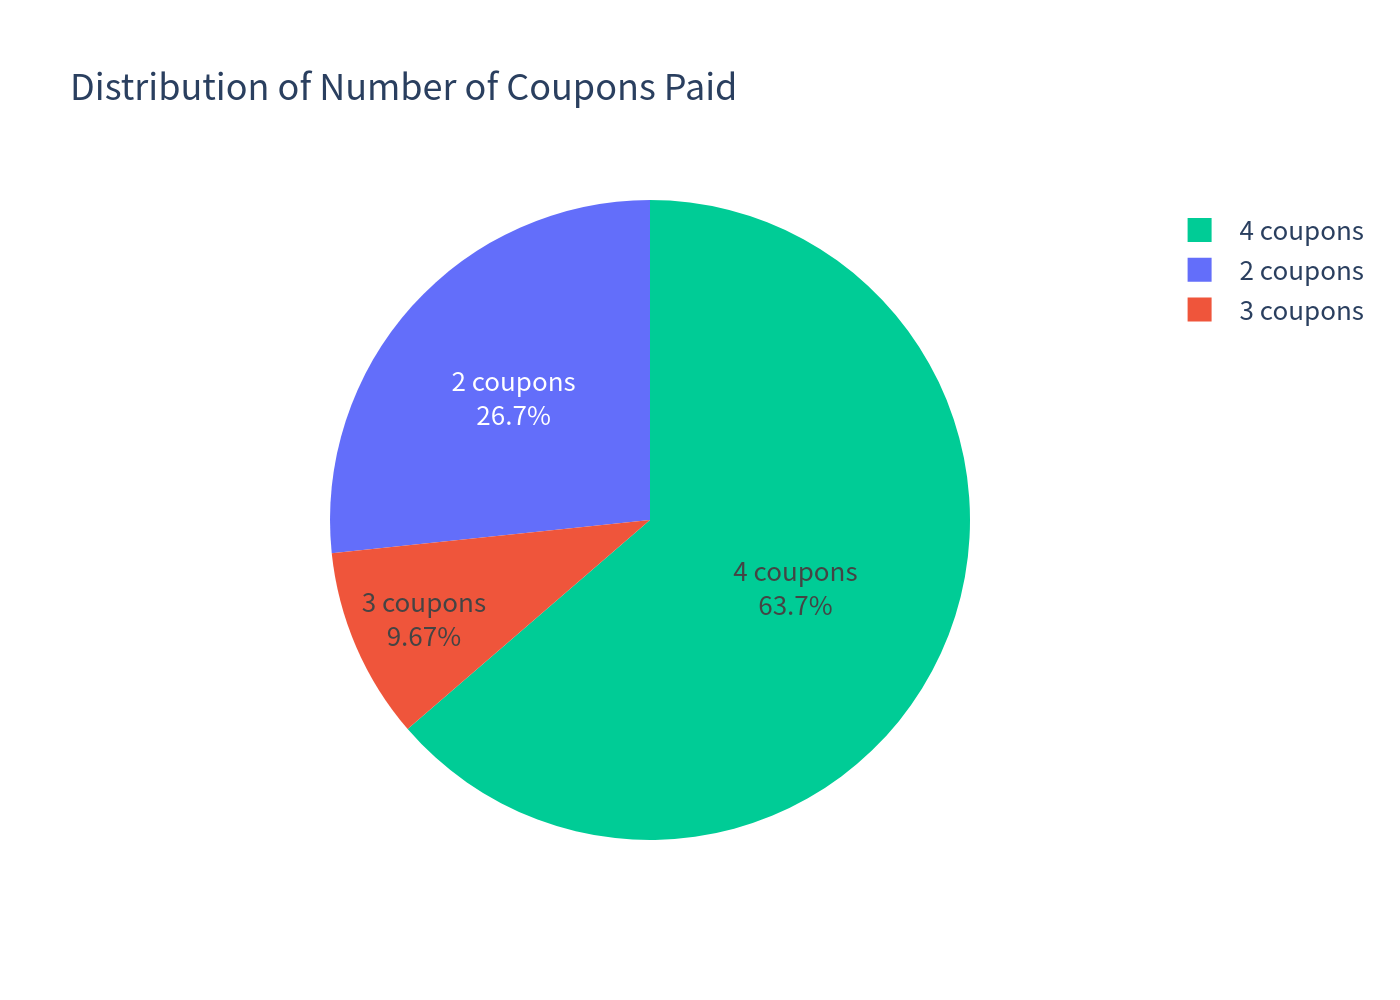
- Autocalled in month 6: 26.66% of paths (2 coupons received)
- Autocalled in month 9: 9.67% of paths (3 coupons received)
- Held to maturity: 63.68% of paths (4 coupons received)
- Average coupons received: 3.37 out of 4
- Deep-downside (worst-of below 53.25% at maturity, physical delivery): 5.48% of paths
Charts
Simulation outcomes (product vs. underlying)
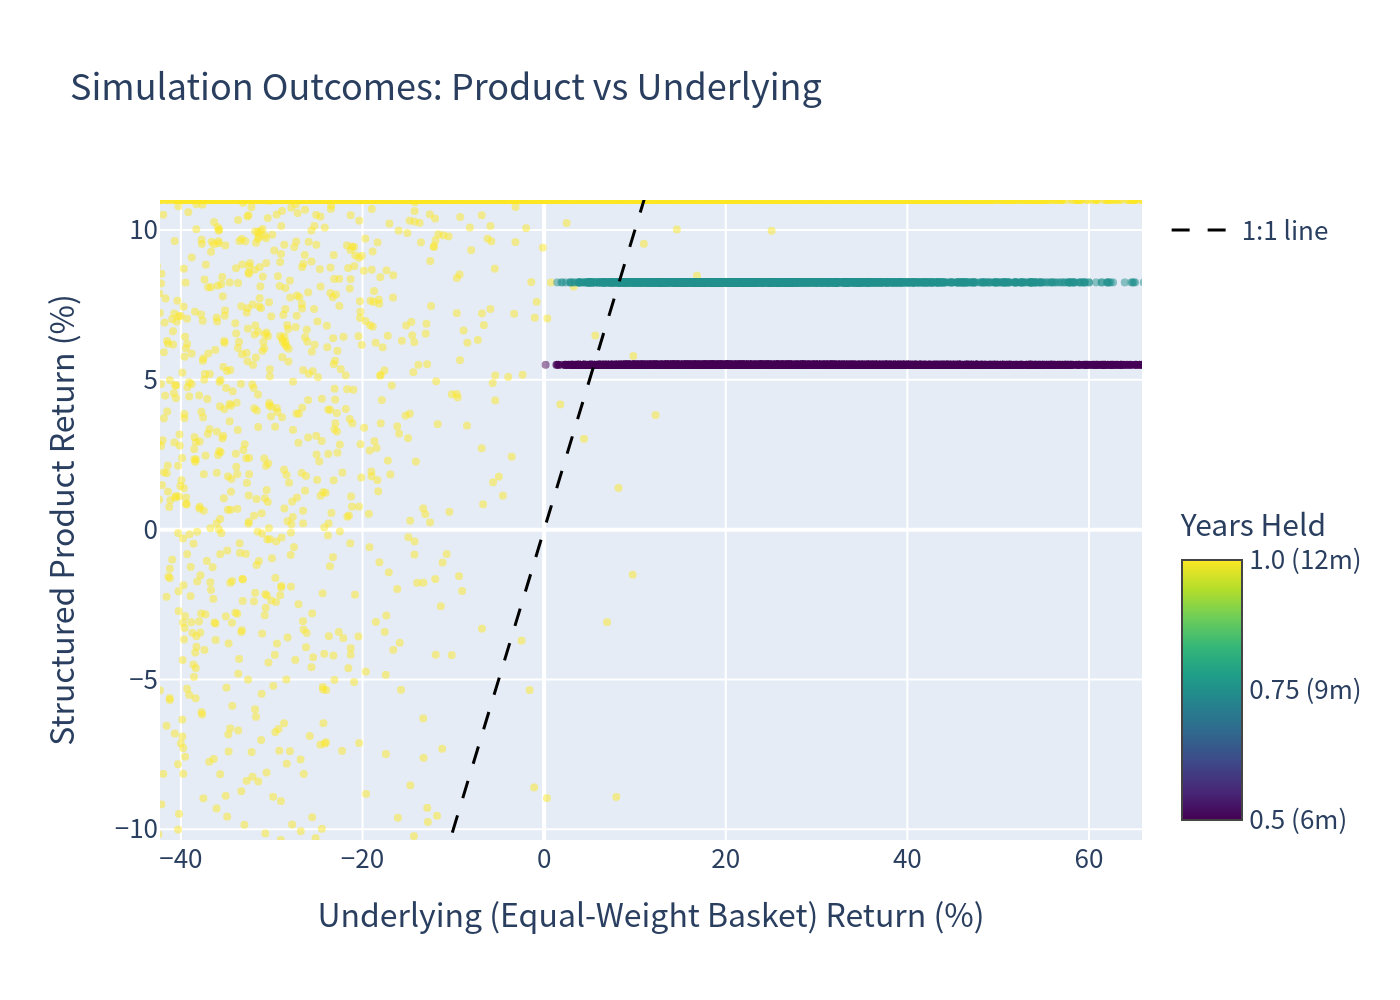
Most paths cluster at positive product returns regardless of the underlying’s outcome (capped upside). Only when the worst-of basket is deeply negative do points cross below zero on the product axis.
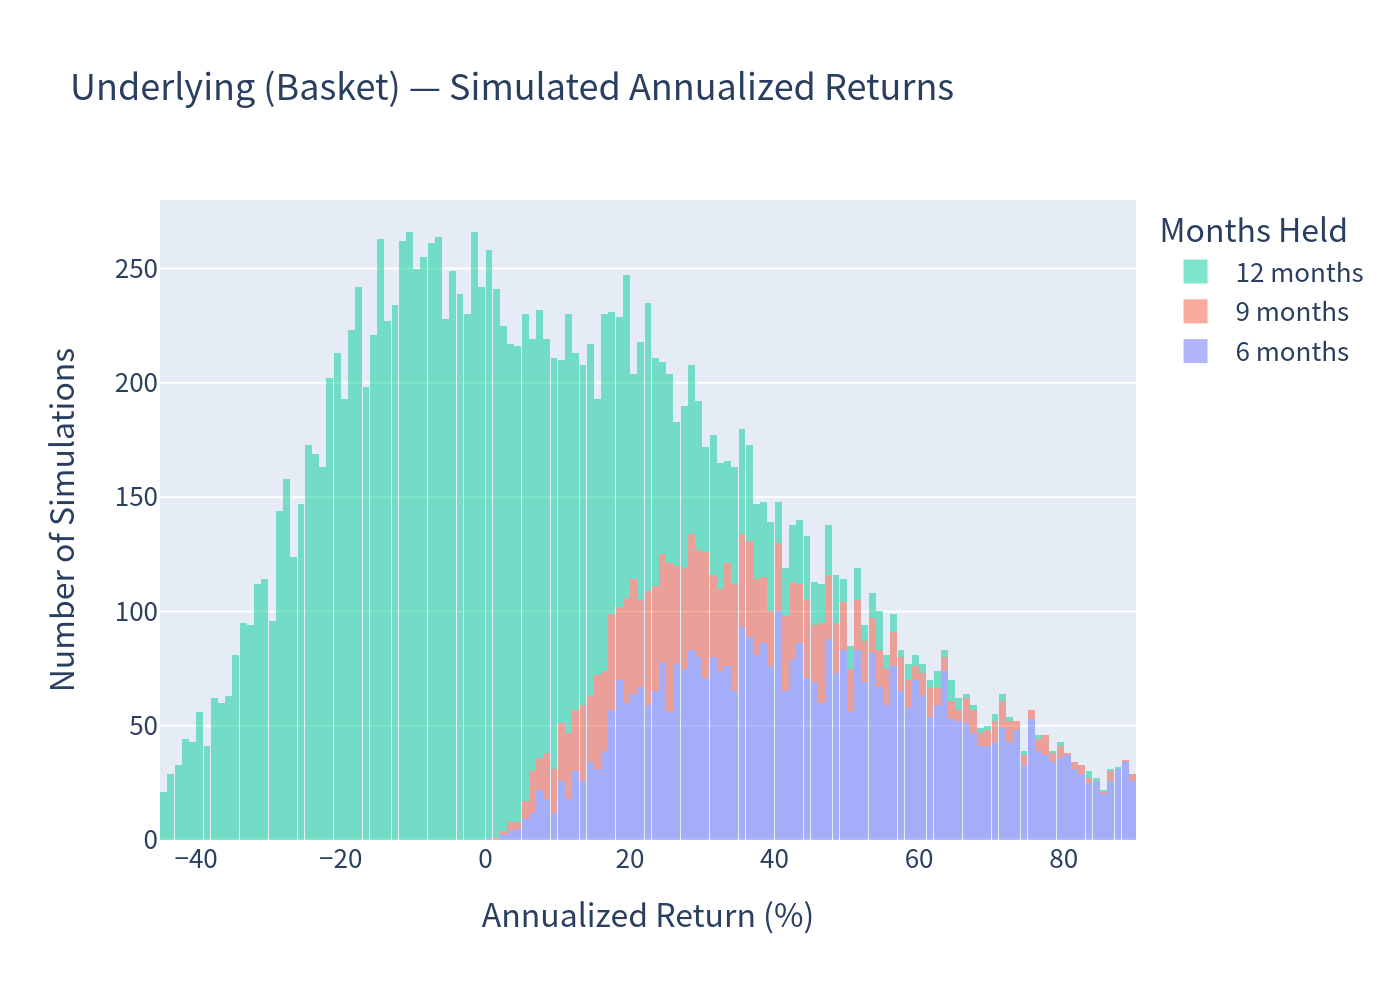
Annualized return distribution — Underlying basket
Annualized return distribution — Structured product
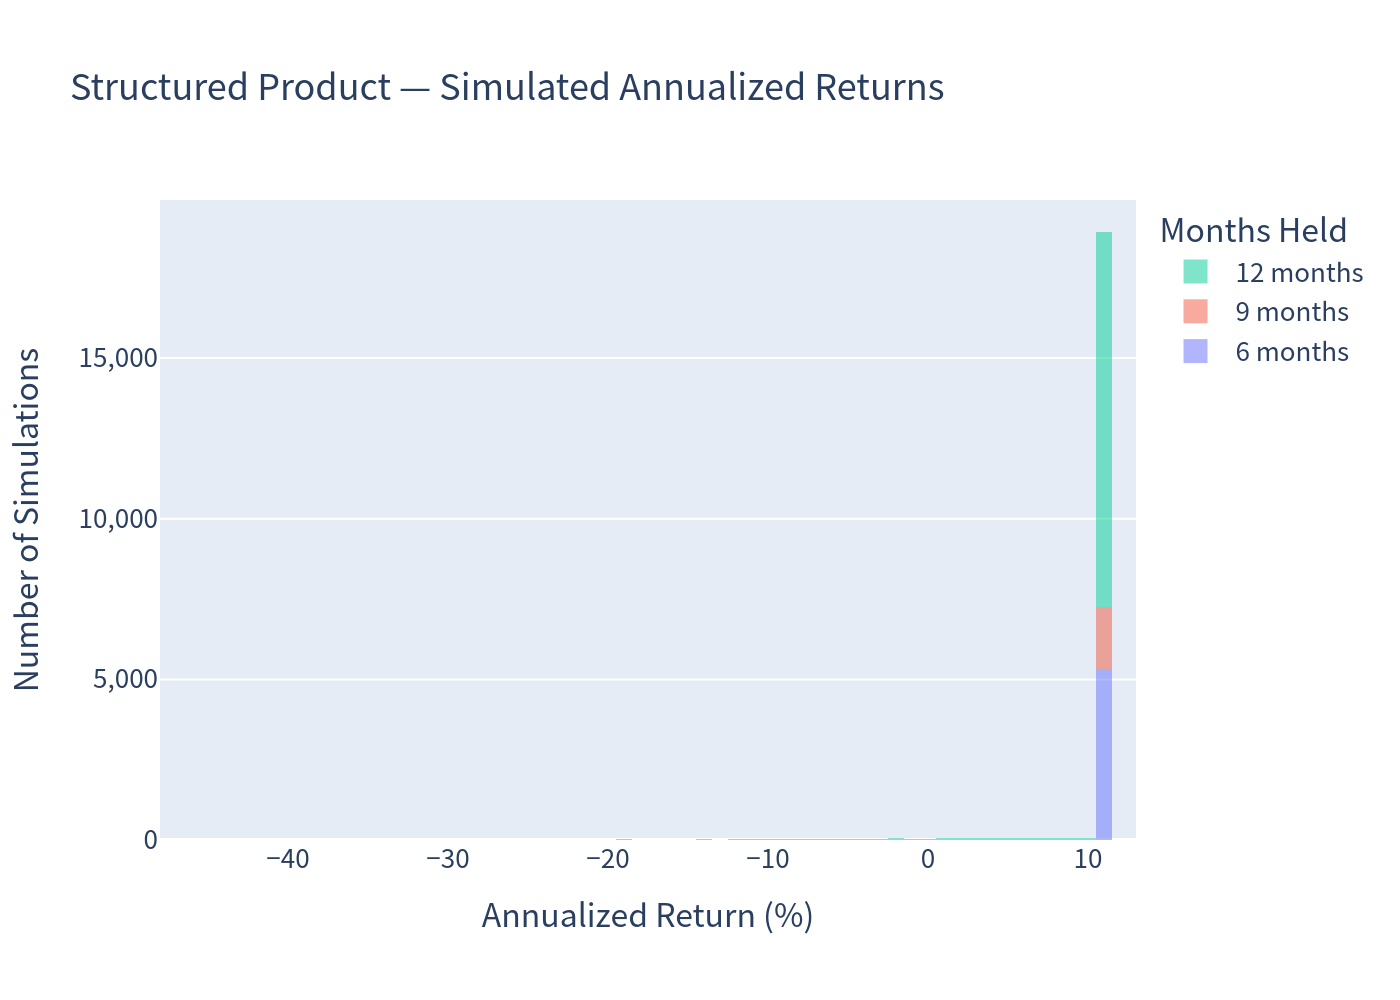
The product histogram shows a dominant spike at ~11% (the coupon-driven “all good” outcome) and a small, heavy left tail reflecting the worst-of crash scenario.
Scenario probabilities
Risk / Return comparison
Annualized return box plot
Holding-period distribution
Distribution of number of coupons paid
Investment Commentary
Favourable characteristics
- High current yield: an 11.00% p.a. coupon is a meaningful spread over the ~3.84% risk-free rate, paid quarterly and unconditionally while the note is alive.
- Deep protection barrier: the European 53.25% strike sits ~46.75% below the starting levels, so the basket can fall substantially before principal is at risk; only ~2.5% of simulated paths produce a negative return.
- Frequent early exit: roughly 36% of paths are autocalled within nine months, returning principal plus coupons relatively quickly.
- Smoother profile: realized return volatility (~3.7%) and 99% VaR (-10.4%) are dramatically lower than holding the three stocks directly (-41.9% VaR).
Risks worth noting
- Capped upside: gains are limited to the coupon; participation in a strong semiconductor rally is forgone.
- Worst-of downside: a sharp drawdown in any single name can trigger physical delivery of that weakest stock and erode coupons plus principal. The worst simulated path returned -46.50%.
- Issuer exposure: returns depend on UBS AG’s ability to pay (unsecured, unsubordinated obligation); no depositor protection applies.