
Structured Product Evaluation Report
Worst-of EURO STOXX 50 / Russell 2000 / S&P 500 — Contingent Income Auto-Callable Notes due Nov 2, 2029
Headline Simulation Results 10,000 Monte-Carlo scenarios
| Headline Metric | Value |
|---|---|
| Expected annualized return (mean of per-scenario annualized return) | 8.90% |
| Expected total return over realized holding period | 6.94% |
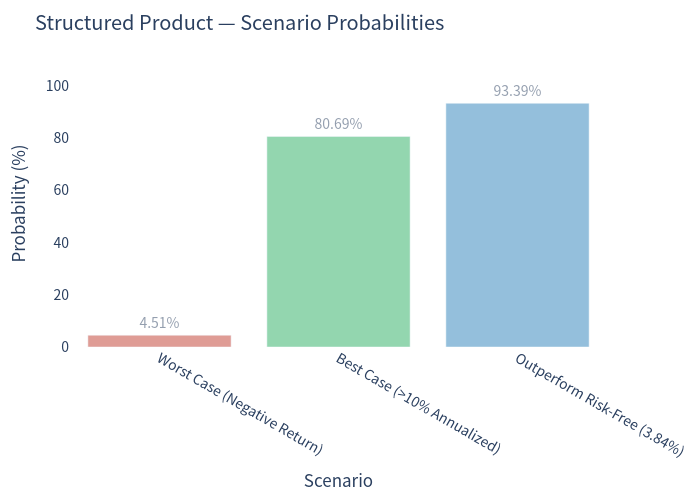
| Probability of a negative return | 4.51% |
| 99% confidence VaR (1-year, 1st percentile) | -17.37% |
| Expected holding period | ~1.06 years (12.77 months) |
| Probability of automatic early redemption | 87.58% |
Basic Product Information
- Issuer / Guarantor: Morgan Stanley Finance LLC / Morgan Stanley (USD, $1,000 per note).
- Underlyings: EURO STOXX 50® Index (SX5E), Russell 2000® Index (RTY), S&P 500® Index (SPX). All payoff conditions depend on the worst-performing of the three.
- Contingent coupon: 10.05%–11.05% p.a. (modeled at the 10.55% midpoint, ≈2.64 points per quarter), paid quarterly only if the worst-of level is at or above 80% of its starting level on the observation date.
- Automatic early redemption: beginning after 6 months, then quarterly — if all three indices close at or above 100% of their starting levels, the note is called at par plus the period's coupon.
- Downside protection: at maturity, if the worst-of final level is at or above 70% of its starting level, principal is returned in full; below 70%, principal is reduced 1:1 with the worst index (e.g. worst at 60% ⇒ 60% of principal returned).
- Upside: capped — investors never participate in index appreciation.
How it works (plain language)
You put up $1,000. Every quarter you collect an attractive coupon (~2.64% of principal) as long as none of the three indices has dropped below 80% of where it started. Starting after six months, the note is called away automatically (you get your $1,000 back plus that quarter's coupon) as soon as all three indices are back to at least their starting levels. If the note survives to 2029, you get your full $1,000 back provided the weakest index is still above 70% of its start; if the weakest index falls below 70%, you lose principal one-for-one with that decline. Upside is capped at par plus coupons, but downside below the 70% barrier on the worst index is effectively uncapped down to −100%.
Key Statistics — Structured Product vs Underlying Benchmark
Benchmark = buy-and-hold of an equal-weight basket of the three indices over the full 3-year term, total return including an average dividend yield of ≈1.56%. This unconditional measure is the fair "standalone investment" reference.
| Metric | Structured Product | Underlying (Buy & Hold 3y, Total Return) |
|---|---|---|
| Expected annualized return | 8.90% | 10.39% |
| Expected annualized volatility | 5.26% | 9.86% |
| Probability of loss | 4.51% | 18.22% |
| 99% VaR (1 year) | -17.37% | -14.68% |
| Expected total return (over its horizon) | 6.94% (over ~1.06 y) | 32.07% (over 3 y) |
Comparison summary
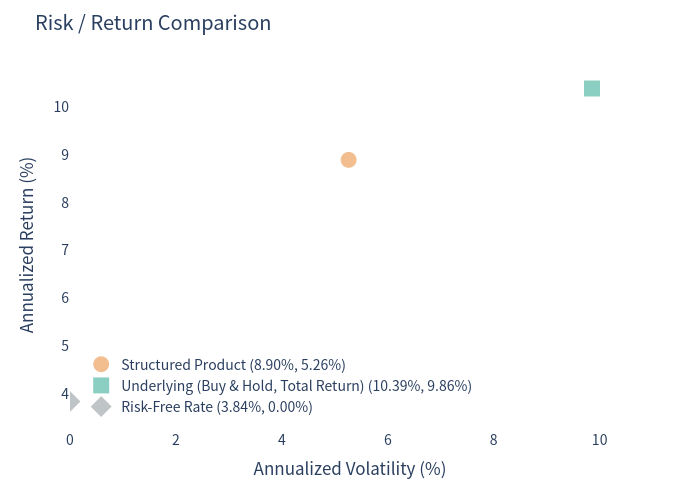
Versus simply buying and holding the basket, the note delivers a lower expected return (8.90% vs 10.39%) and carries a deeper 99% tail (-17.37% vs -14.68%) because its payoff is tied to the weakest index, but it offers far lower volatility (5.26% vs 9.86%) and a much smaller chance of any loss (4.51% vs 18.22%) thanks to the 70% barrier and the coupon cushion.
Charts
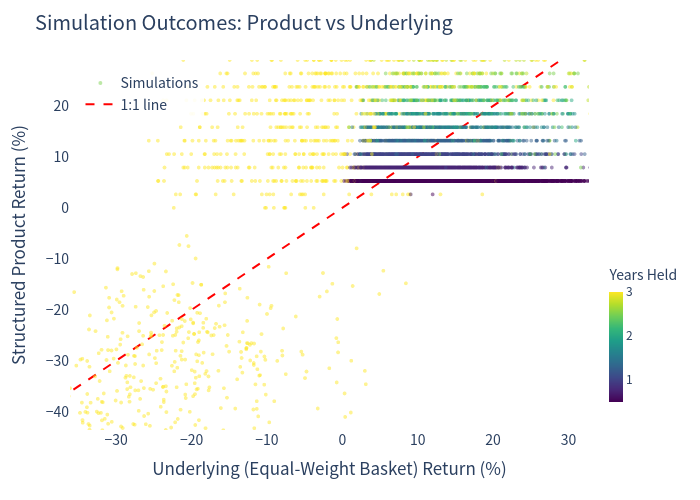
Simulation outcomes: product vs underlying (same realized holding period)
Each dot is one of the 10,000 scenarios. The x-axis measures the equal-weight basket over the same realized holding period as the note, so it captures the per-scenario opportunity cost; colour marks how long the note was held. Because upside is capped, product returns sit in a tight band around par-plus-coupon, while deep drawdowns of the worst index pull product returns sharply negative.
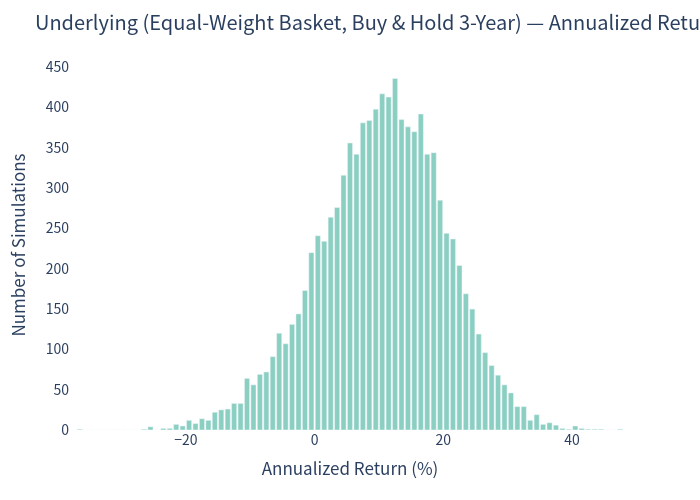
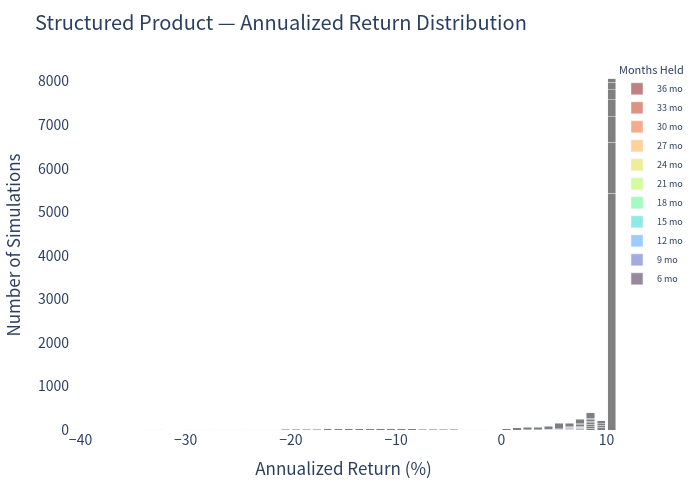
Annualized return distributions
The buy-and-hold basket has a broad, right-skewed distribution with meaningful left tail; the product distribution is compressed near the coupon level with a thin negative tail coming from maturity barrier breaches (and stacking by holding period shows most mass at the early-call level).
Risk vs return
The note sits to the left of the buy-and-hold basket — much lower volatility and a lower expected return — while its deep tail (VaR) is somewhat worse.
Return box plot
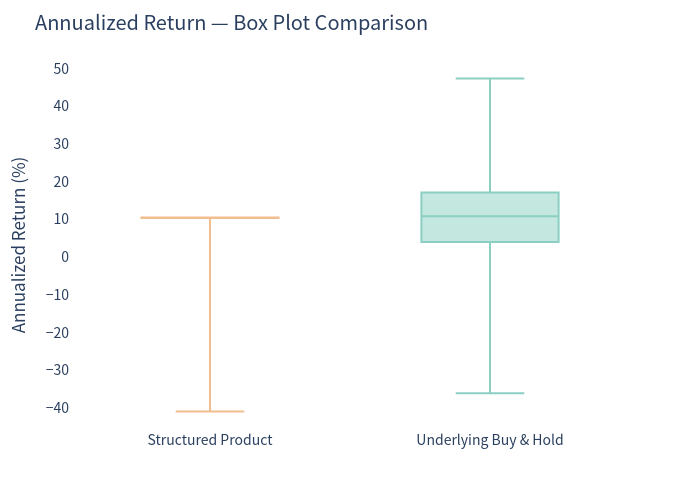
Most product outcomes cluster at the maximum coupon-driven level (~10.5% annualized, after an early call); the box plot contrasts this tight, callable profile with the much wider standalone basket.
Scenario probabilities
Holding period and coupon distributions
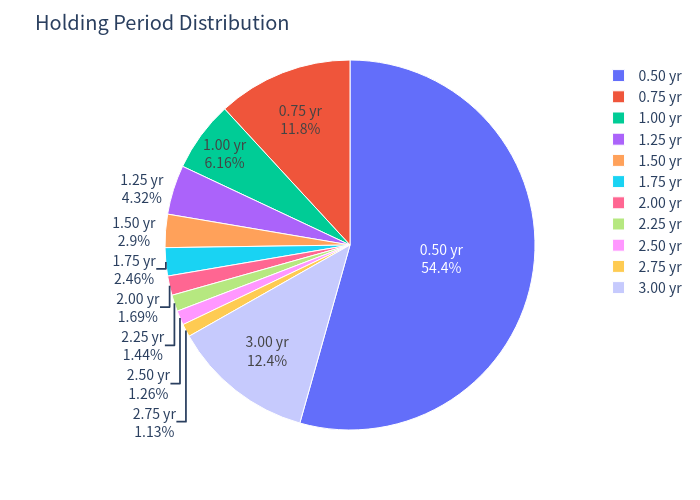
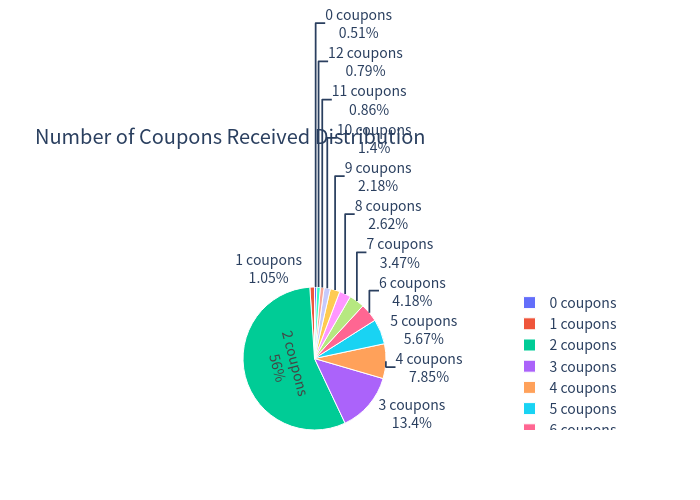
Automatic redemption concentrates outcomes into a first call at month 6 (~54%) and a full-term survival (~12%).
Investment Commentary
Potential advantages
- High headline coupon (~10.55% p.a.), paid whenever the worst-of index is above 80% of its start — a level the worst index clears in the large majority of quarterly observations.
- Frequent early redemption — ~88% of scenarios are called, most at the first opportunity, returning principal quickly with several coupons.
- Downside buffer to −30% on the worst-of index lowers the probability of any loss to ≈4.5% (versus ≈18% for a buy-and-hold basket) and keeps volatility low (~5%).
- Attractive risk-adjusted profile — a ~93% probability of beating the 1-year T-bill and a substantially lower chance of loss than holding the indices directly.
Considerations / trade-offs
- Capped upside: investors forgo index appreciation; in strong markets the note is simply called and must be reinvested, possibly at lower future rates.
- Worst-of exposure: returns are tied to the weakest of three indices, so one lagging market can trigger a loss even if the others rise. This is why the note's 99% VaR (-17.37%) is worse than the diversified basket (-14.68%) despite its much lower volatility.
- Lower expected return: the coupon-rich, callable, barrier structure buys its reduced risk at the cost of a lower expected return than plain index exposure (8.90% vs 10.39% annualized).
- Call / reinvestment and credit risk: a ~1-year expected life means proceeds may need reinvesting at unknown rates, and payments depend on Morgan Stanley's creditworthiness.