
7.20% p.a. Multi Barrier Reverse Convertible on Nestlé, Novartis, Roche — Simulation Report
Headline Results
| Metric | Value |
|---|---|
| Expected annualized return | 7.11% |
| Probability of a negative return | 0.60% |
| 99% confidence VaR (1 year) | +7.20% |
| Expected total return over realized holding period | 7.04% |
| Expected holding period | 12.17 months (~1.0 year) |
1. Basic Product Information
Product: 7.20% p.a. Multi Barrier Reverse Convertible on Nestlé, Novartis and Roche (SSPA Type 1230), issued in CHF and listed on SIX Swiss Exchange (ISIN CH1593770956).
How it works (layman's explanation)
- You receive a fixed quarterly coupon of 1.80% (7.20% p.a. in total) on every coupon date regardless of how the three Swiss blue-chip stocks perform, as long as the product has not been redeemed early.
- The product is callable by the issuer: at each of the eight quarterly observation dates (from year 1 onward), the issuer can redeem the product early at 100% of the nominal amount plus the coupon then due. Because the 7.20% coupon is far above current CHF interest rates (~0%), the issuer is expected to call the product at the first observation date (~12 months) in the vast majority of scenarios — the investor then receives 100% of capital back plus 4 coupons (≈ +7.2% for one year).
- At maturity, if the product has not been called:
- No barrier event (all three stocks stayed above 59% of their initial level): you receive 100% of nominal back.
- Barrier event (any of the three stocks traded at or below 59% of its initial level at any time): you receive 100% of nominal only if the worst-performing stock has recovered to its initial level (≥ 100%) at maturity; otherwise you receive physical delivery of the worst-performing stock, worth less than par.
- Upside is capped — you receive the coupon but do not participate in any share price gains.
2. Key Statistics (simulated, annualized)
| Metric | Structured Product | Underlying Basket* |
|---|---|---|
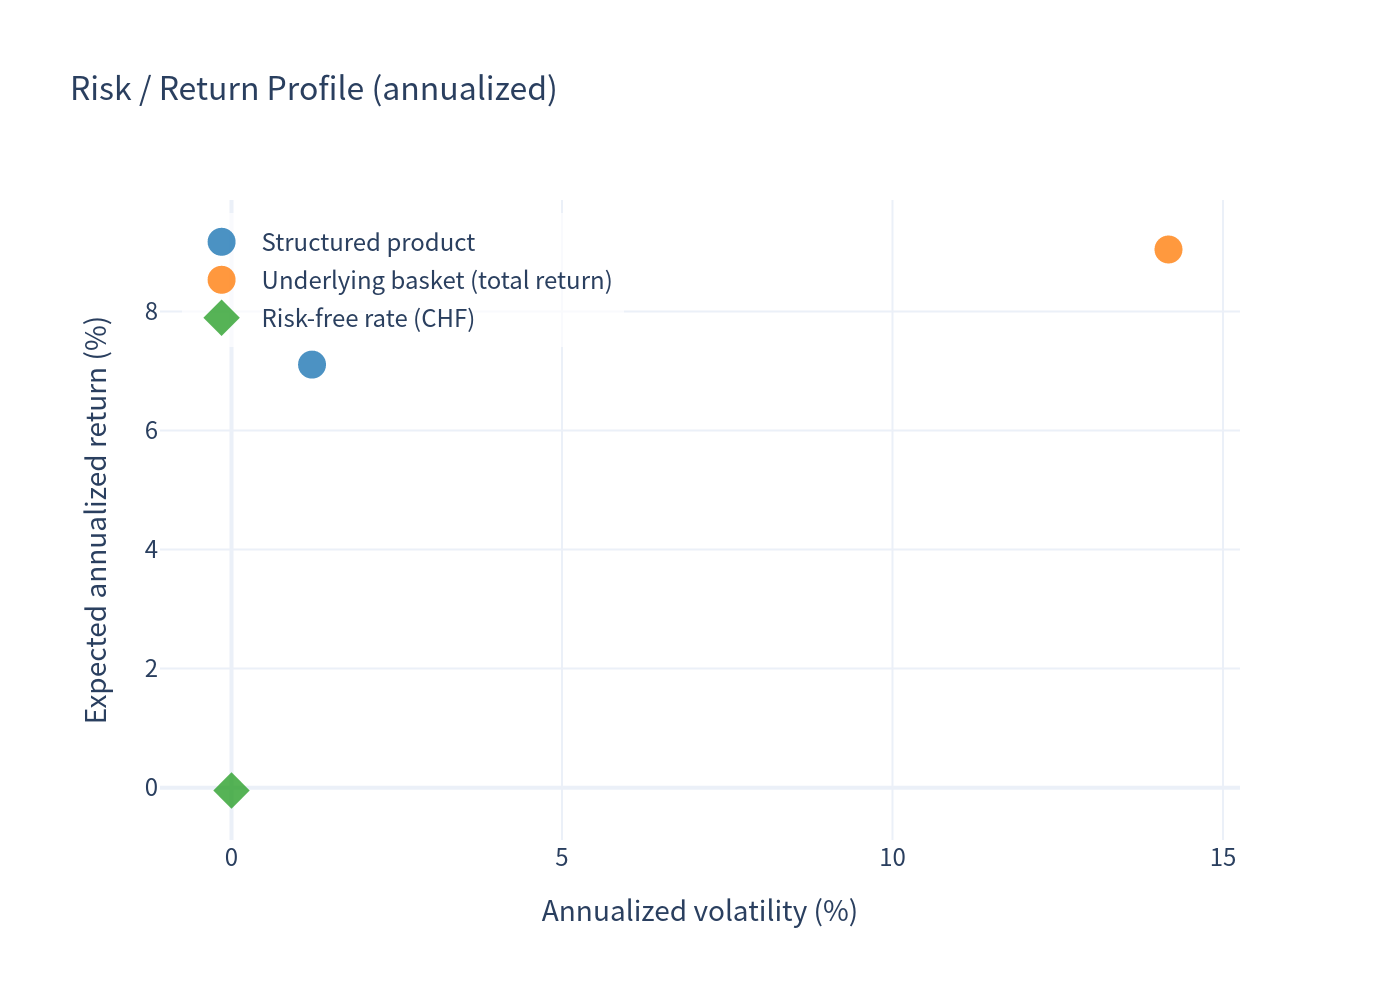
| Expected annualized return | 7.11% | 9.04% |
| Expected annualized volatility | 1.22% | 14.18% |
| Probability of loss | 0.60% | 27.35% |
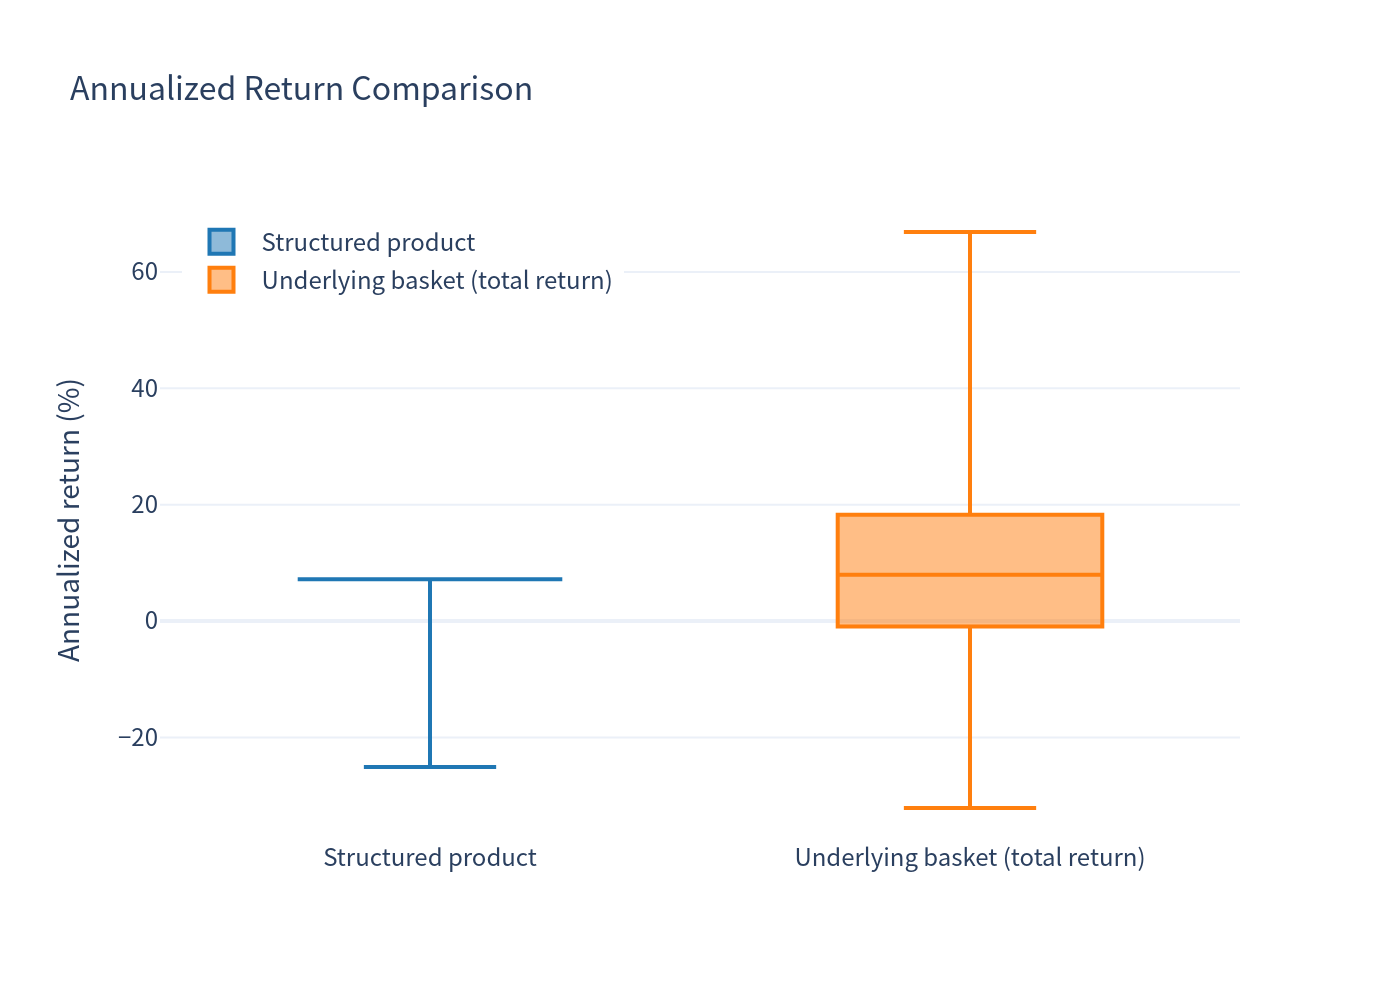
| 99% VaR (1 year) | +7.20% | -20.02% |
| Median annualized return | 7.20% | 7.97% |
| Mean total return (realized holding period) | 7.04% | 9.01% |
| Mean holding period | 12.17 months | 12.17 months |
Outcome profile
| Outcome | Share of simulations |
|---|---|
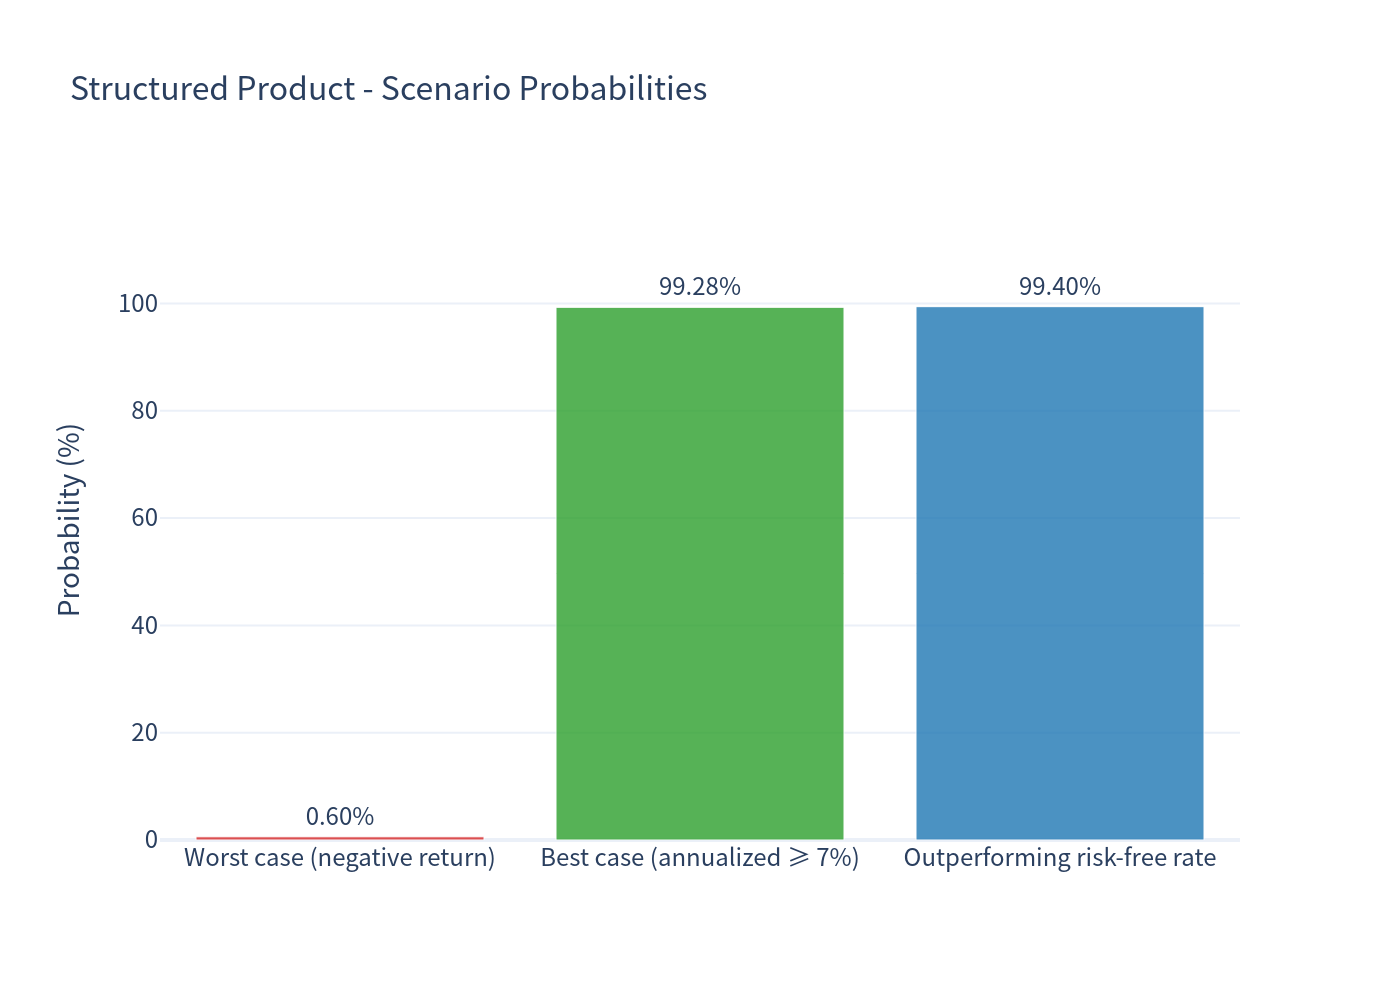
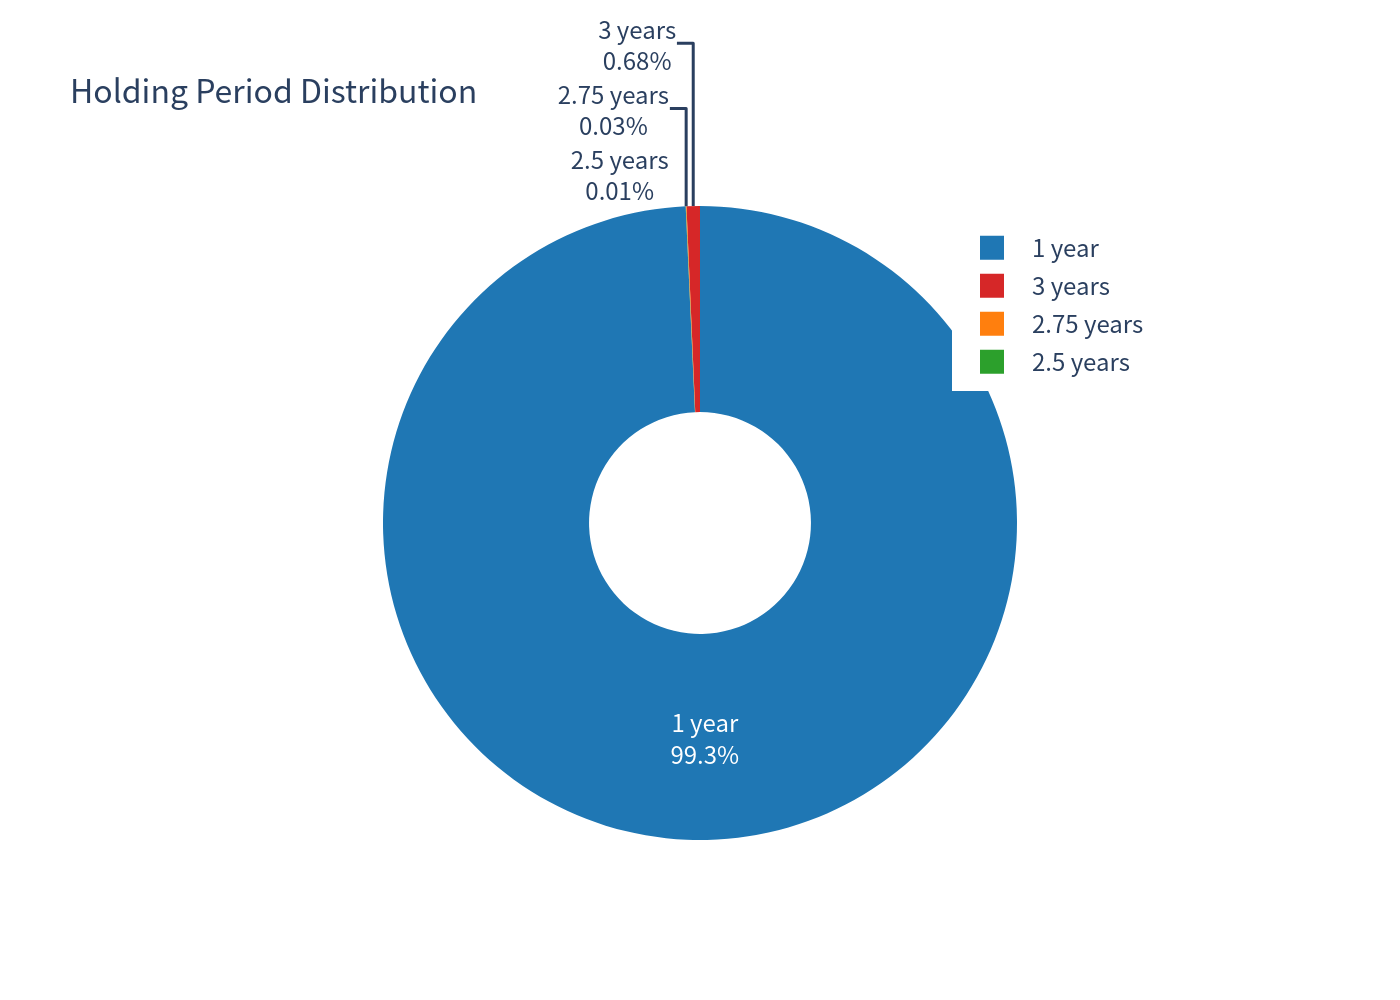
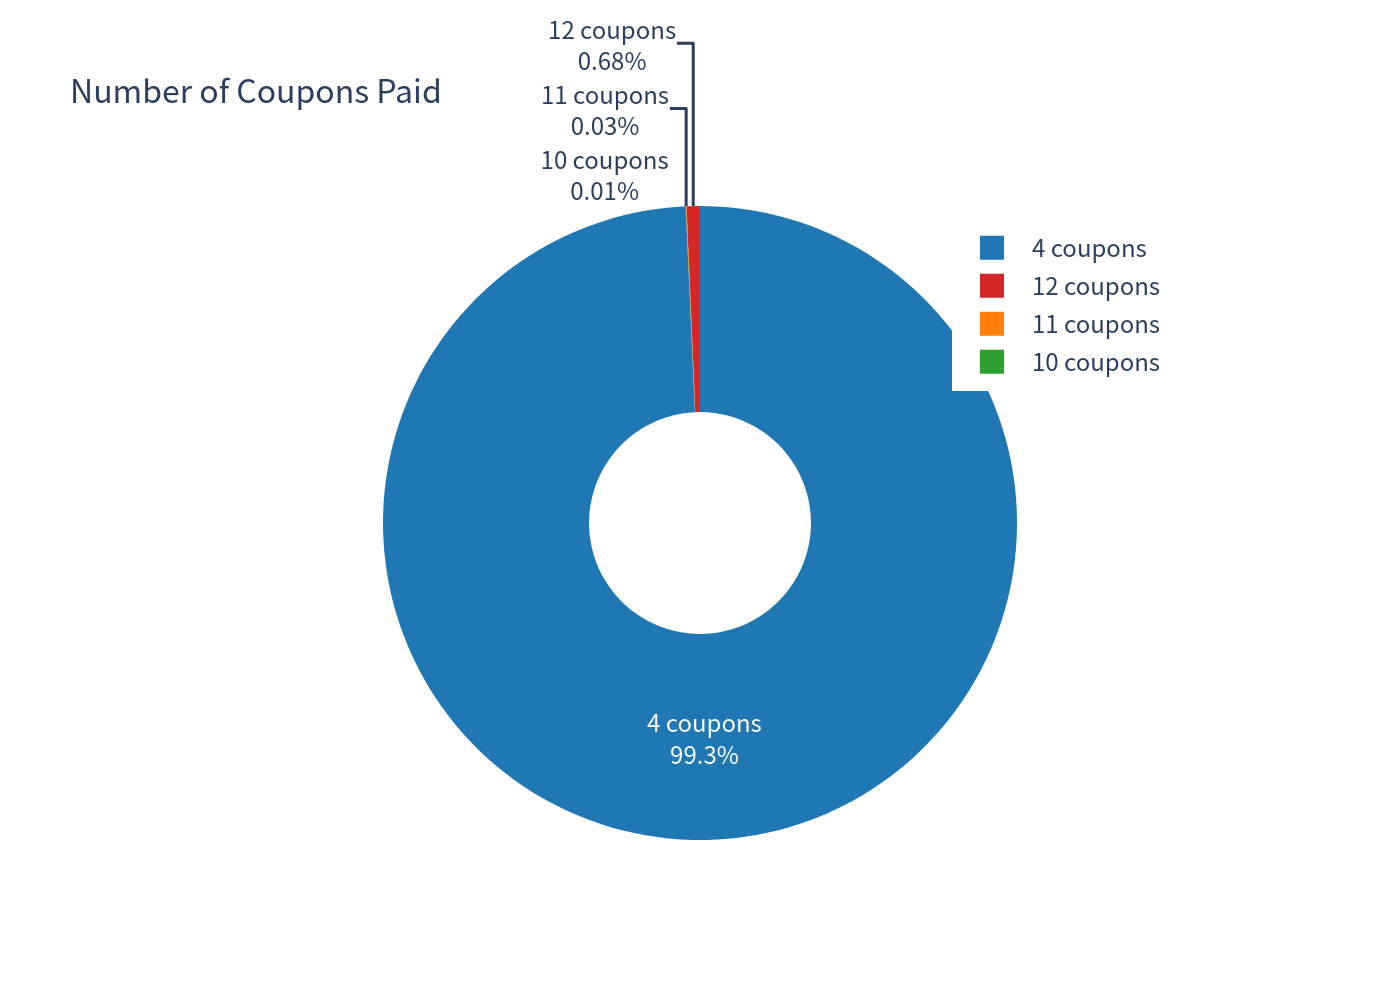
| Called by issuer at ~12 months (4 coupons, par + 7.2%) | 99.28% |
| Ran to maturity (full 3 years, 12 coupons) | 0.68% |
| Barrier event observed at any point (any of the 3 stocks ≤ 59%) | 9.61% |
| Negative total return | 0.60% |
3. Charts
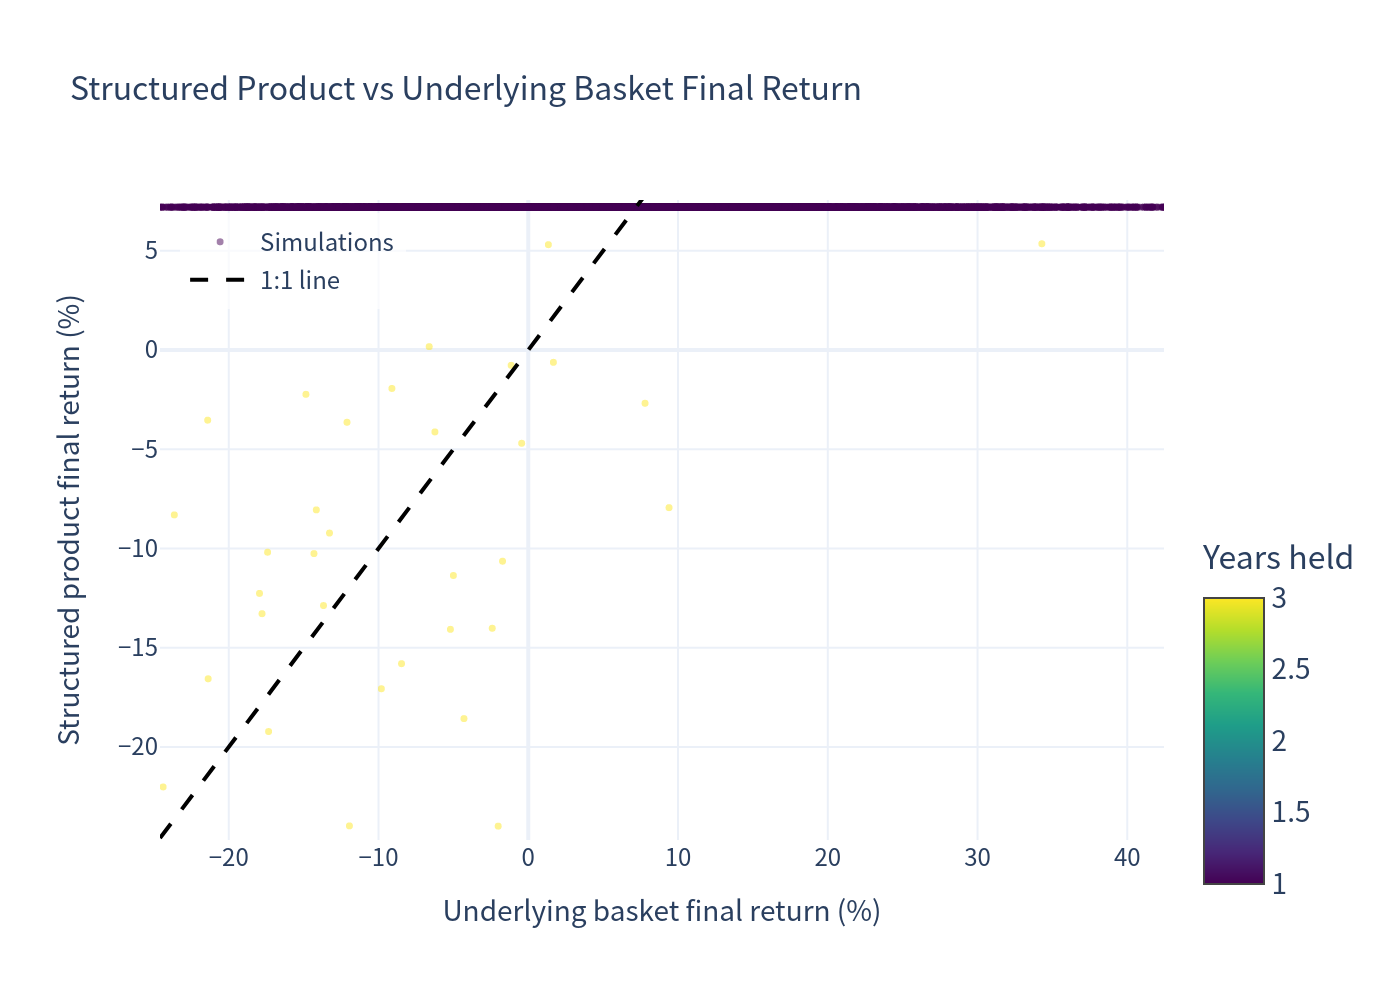
Simulation outcomes: structured product vs underlying basket
Scatter of simulated holding-period outcomes for the structured product versus the equal-weight underlying basket.
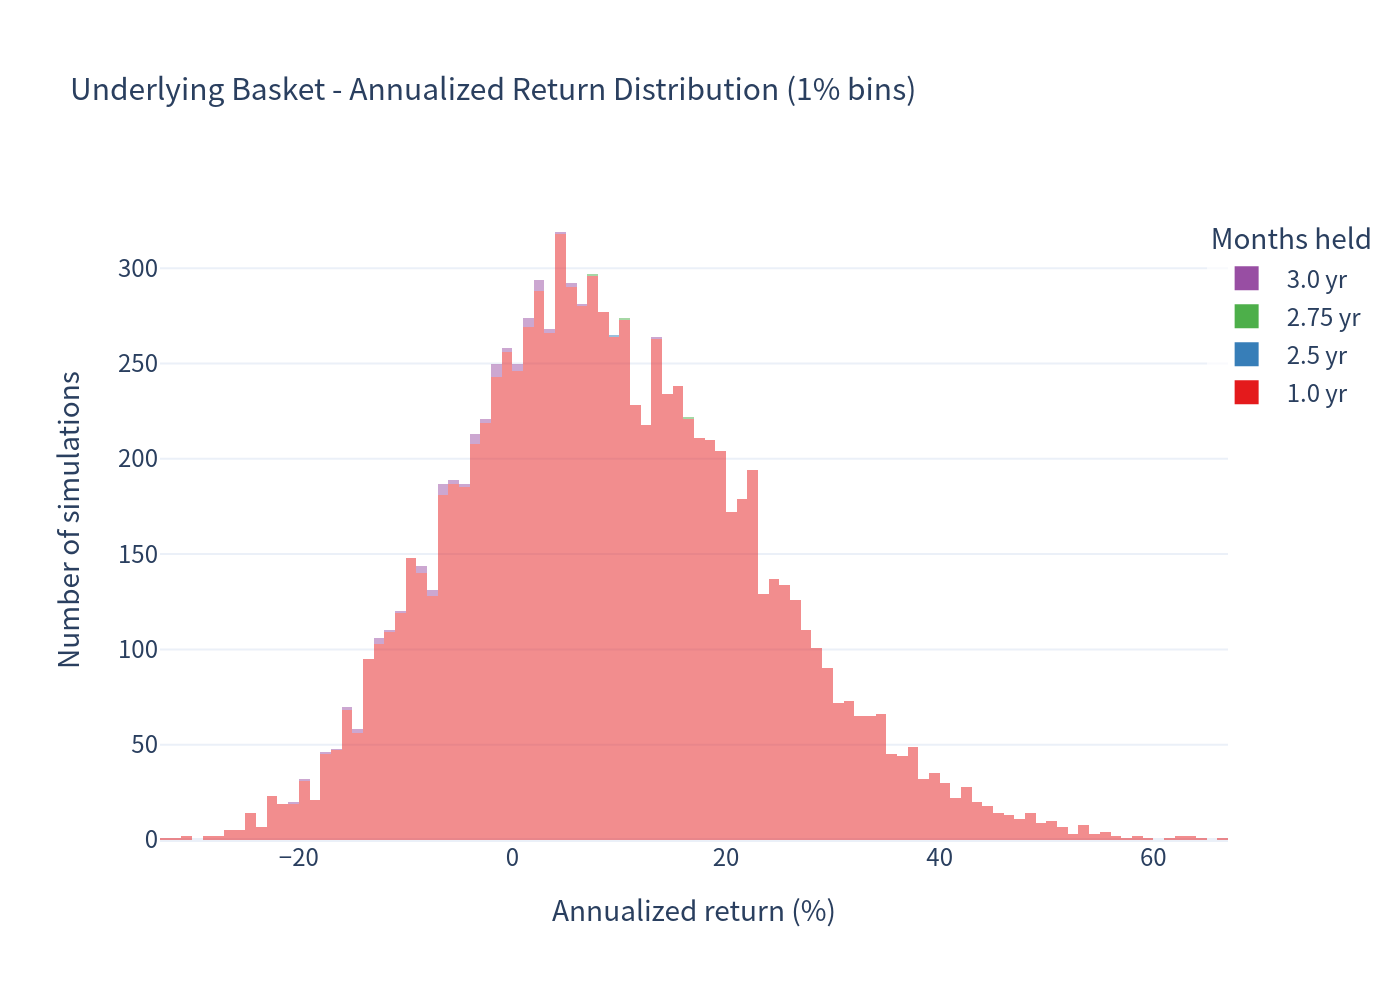
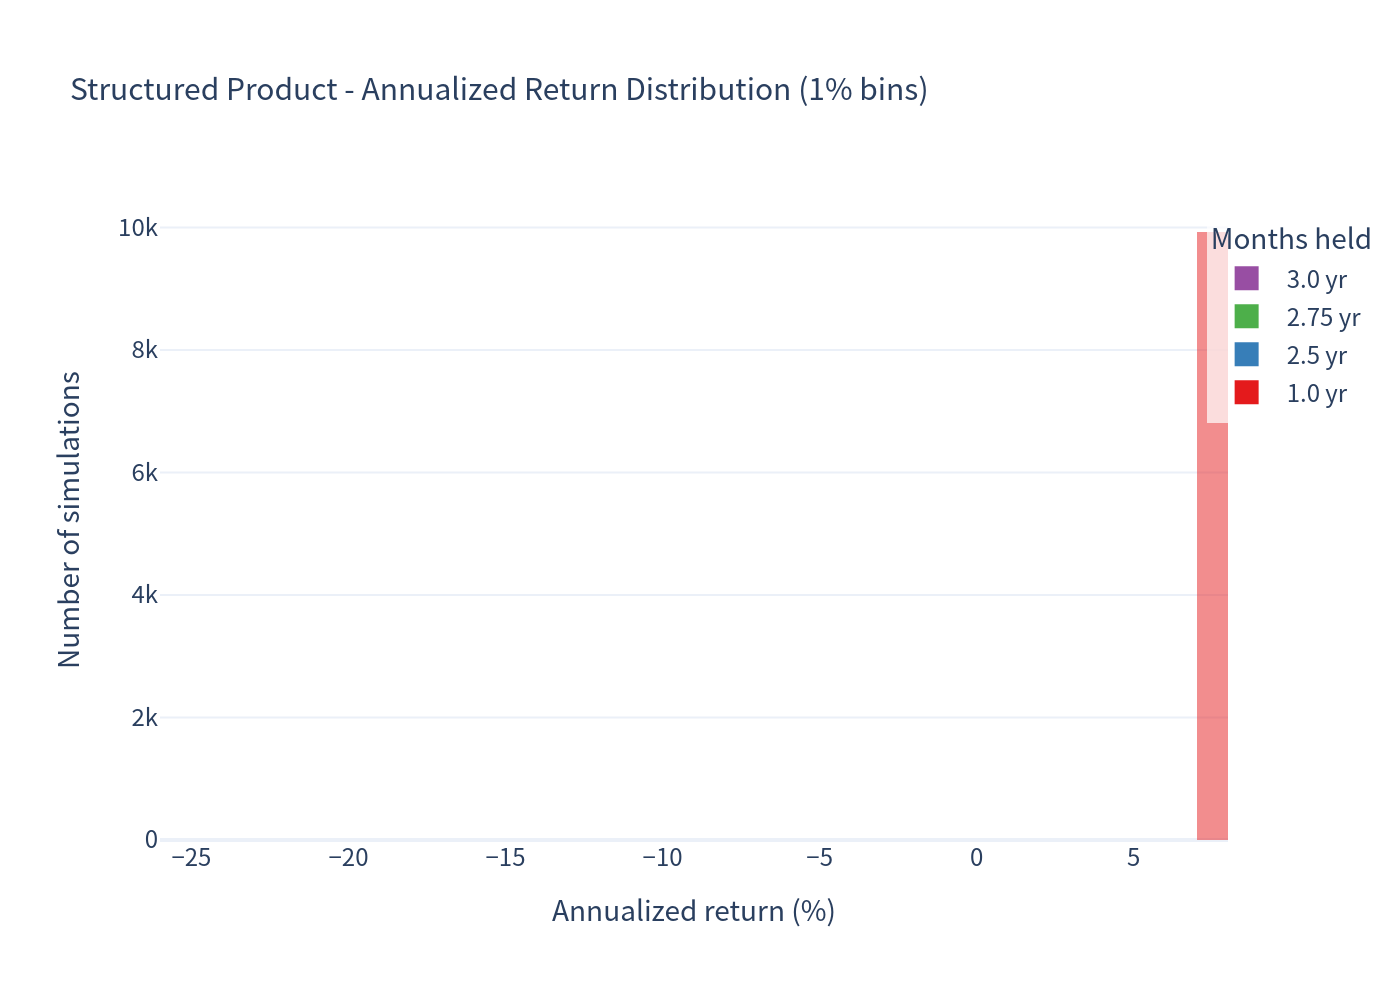
Annualized return distributions (1% bins)
Distribution of simulated annualized returns for the underlying basket.
Distribution of simulated annualized returns for the structured product.
Scenario probabilities
Share of simulated scenarios for each outcome: early call, run to maturity, barrier event, and negative total return.
Risk / return profile
Expected annualized return versus volatility for the structured product and the underlying basket.
Annualized return comparison (box plot)
Box plot comparing the distribution of annualized returns between the structured product and the underlying basket.
Holding period and coupon distributions
Distribution of the realized holding period in years across simulated scenarios.
Distribution of the number of coupons received across simulated scenarios.
4. Investment Commentary
What stands out
- High income relative to risk-free: the 7.20% p.a. coupon is extremely high versus the CHF money-market rate (~-0.05% in this analysis). On a risk-adjusted basis the product offers a substantially higher expected return than cash, with a very high probability of a positive outcome.
- Very low probability of loss in the simulation (0.60%): the 59% barrier is deep relative to the historical behaviour of these defensive Swiss large-caps. Losses only occur when one of the three stocks falls more than ~41% and remains below its initial level at maturity.
- Expected return below the underlying basket: the product converts equity upside into a fixed coupon; over the simulated horizon the equal-weight basket (with dividends) is expected to return ~9.0% p.a., i.e. more than the product's ~7.1% — the cost of the downside protection and capped upside.
- Short expected holding period: in ~99% of scenarios the issuer calls the product after about one year, returning par plus four coupons. Investors should plan for reinvestment risk after ~12 months rather than a 3-year holding period.
Pros
- Fixed coupon paid irrespective of underlying performance — no coupon cancellation risk.
- Conditional downside protection: capital is returned at par as long as no stock breaches 59% of its initial level.
- Expected holding period is short (~1 year), and the annualized return is achieved with very low realized volatility in the vast majority of scenarios.
- 99% of simulated scenarios achieve an annualized return of at least ~7.2%.
Cons
- Upside is capped at the coupon; the product does not participate in any upside of the Swiss equity market.
- Tail risk: if any underlying falls below 59% of its initial level (continuously observed, including intraday) and the worst performer is below its initial level at maturity, the investor receives physical shares worth materially less than par (worst simulated case ≈ -58% total return).
- The issuer is likely to call the product at the first opportunity, limiting the period over which the high coupon is earned (reinvestment risk).
- Issuer credit risk: payments depend on Leonteq Securities AG (rated BBB-).
- Barrier is monitored continuously on all three names ("worst-of" trigger), which is a stricter condition than an end-of-period check.