
tokenengine.ai
Structured Product Evaluator
Multi Barrier Reverse Convertible — Investment Analysis
Product at a glance
| Product | 17.00% p.a. Multi Barrier Reverse Convertible (worst-of), ISIN CH1607593600 |
|---|---|
| Underlyings | Heidelberg Materials AG, Hochtief AG, Siemens Energy AG (worst-of) |
| Issuer / Listing | Leonteq Securities AG, Guernsey Branch / SIX Swiss Exchange |
| Denomination | EUR 1,000 |
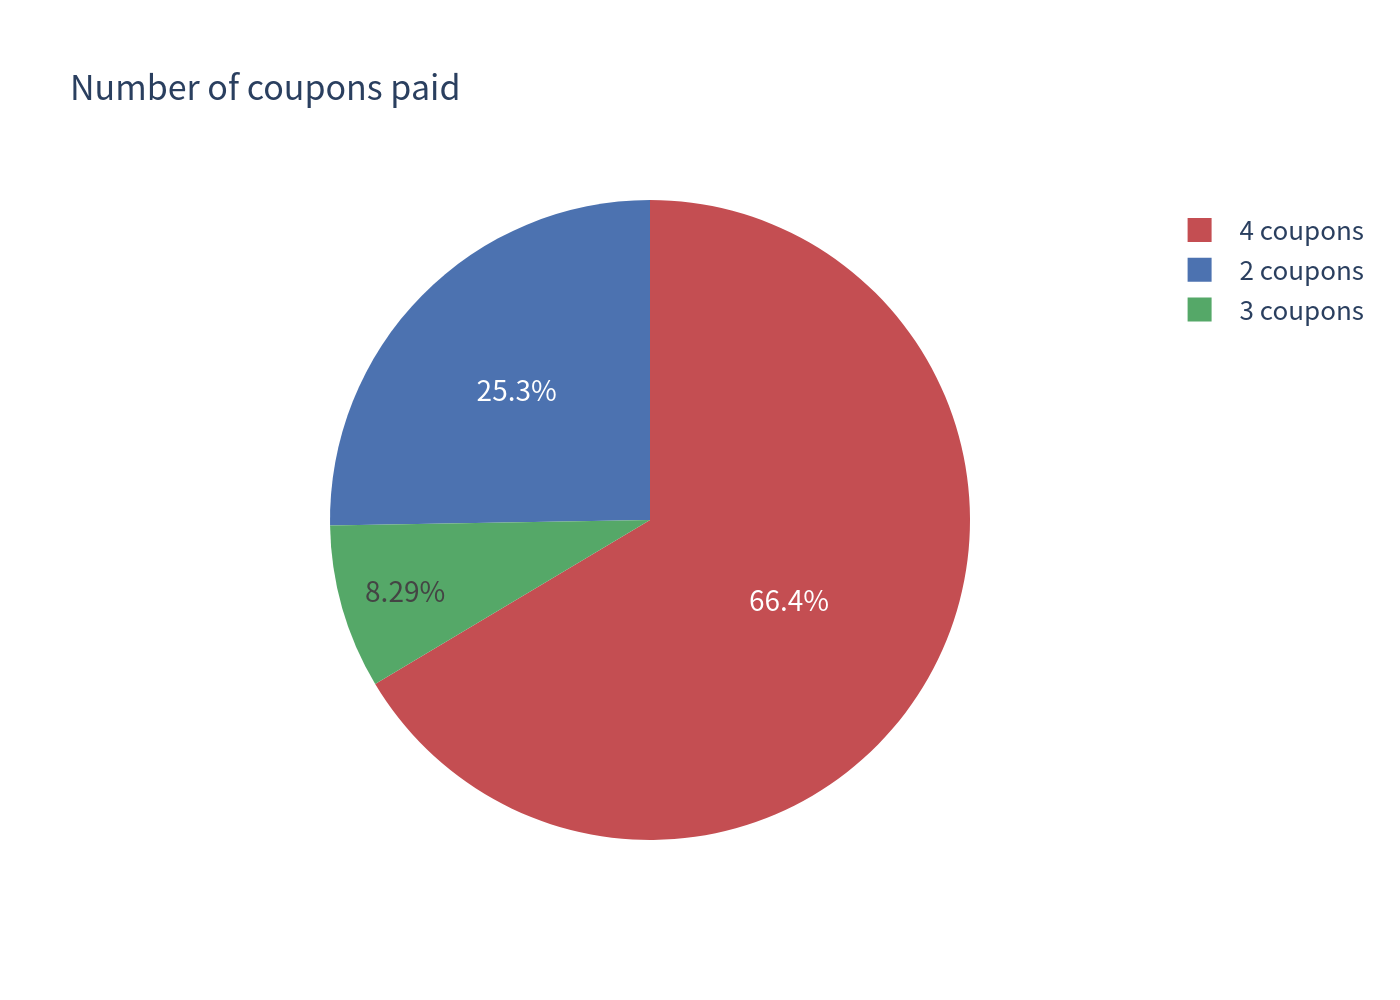
| Coupon | 17.00% p.a. paid quarterly (4.25% per quarter) |
| Barrier | 55% of initial, continuous observation over the whole term |
| Strike | 100% of initial |
| Term / Issuer call | ~12 months; callable by the issuer on two semi-annual dates |
| Base / risk-free rate | EUR; 1-year average euro-area short-term rate 2.04% |
Headline simulation results
How it works (plain language)
You are paid a fixed 17% annual coupon (four quarterly payments of 4.25%) no matter how the three shares perform. In exchange you take downside risk on the worst-performing of the three shares:
- A barrier sits at 55% of each share’s starting level and is watched continuously.
- If none of the shares ever trades at or below 55% during the year, you get your full 100% back at maturity — so you simply keep the coupon.
- If any share touches the 55% barrier, protection is lost. At maturity you then receive the worst-performing share’s final level (capped at par). If that worst share finishes at or above its starting level you still get par; if it finishes below, you take the loss on that share.
- The issuer may call the product early on either observation date (around months 6 and 9), returning par plus the coupon accrued to that date.
Because the redemption amount depends on the worst of three shares and protection only engages if all three stay above 55%, the product is exposed to the weakest name at all times. (The coupon itself is fixed and paid unconditionally.)
Key statistics (simulated, annualized)
| Metric | Structured product | Underlying basket (total return) |
|---|---|---|
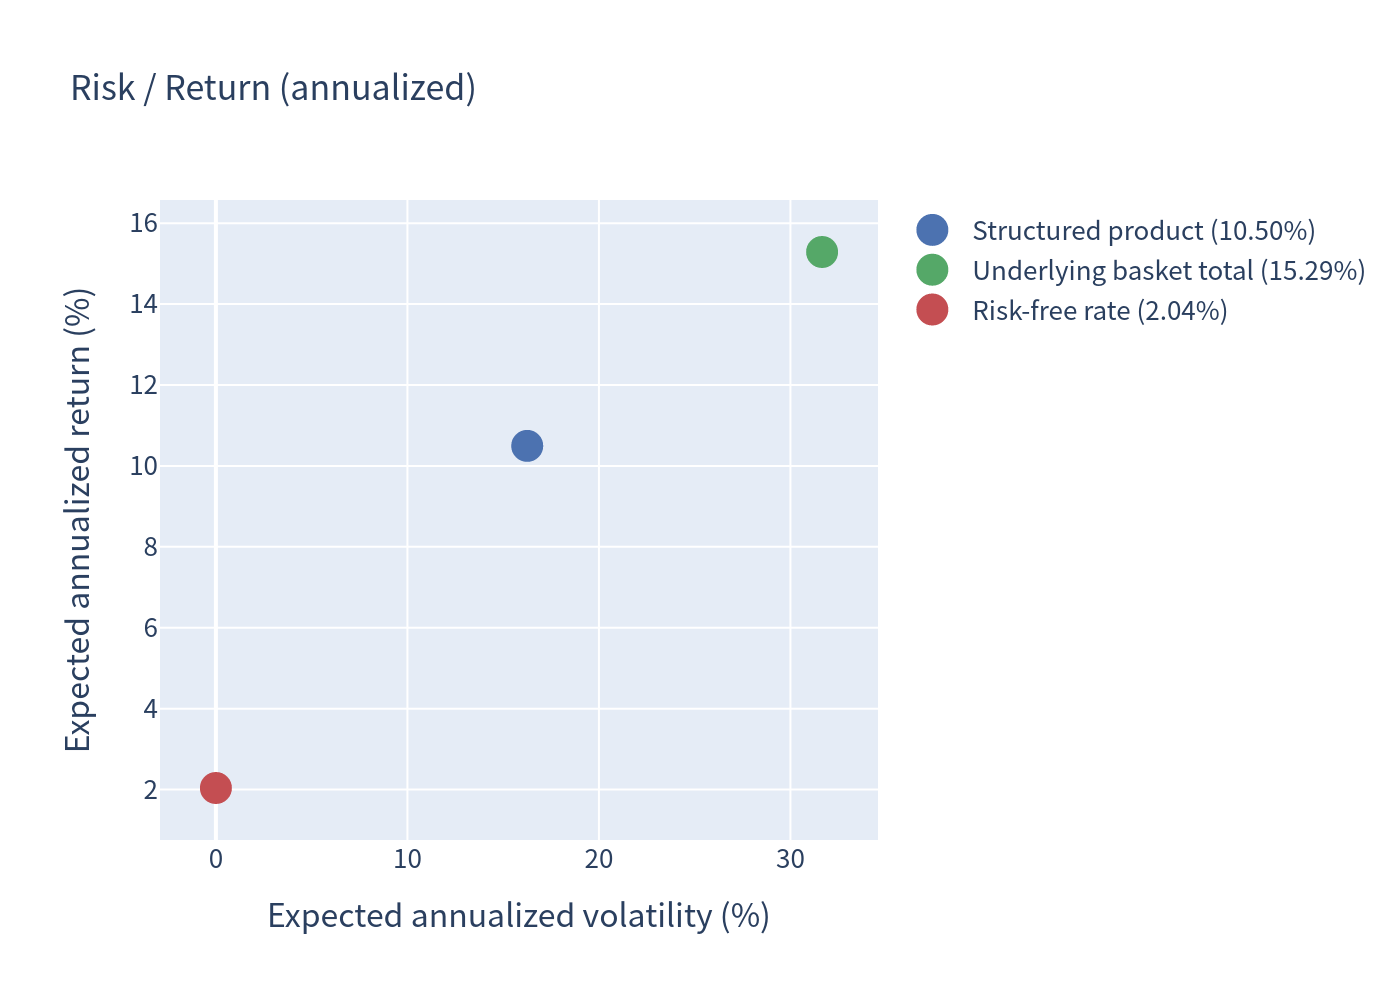
| Expected annualized return | 10.50% | 15.29% |
| Expected annualized volatility | 16.26% | 31.65% |
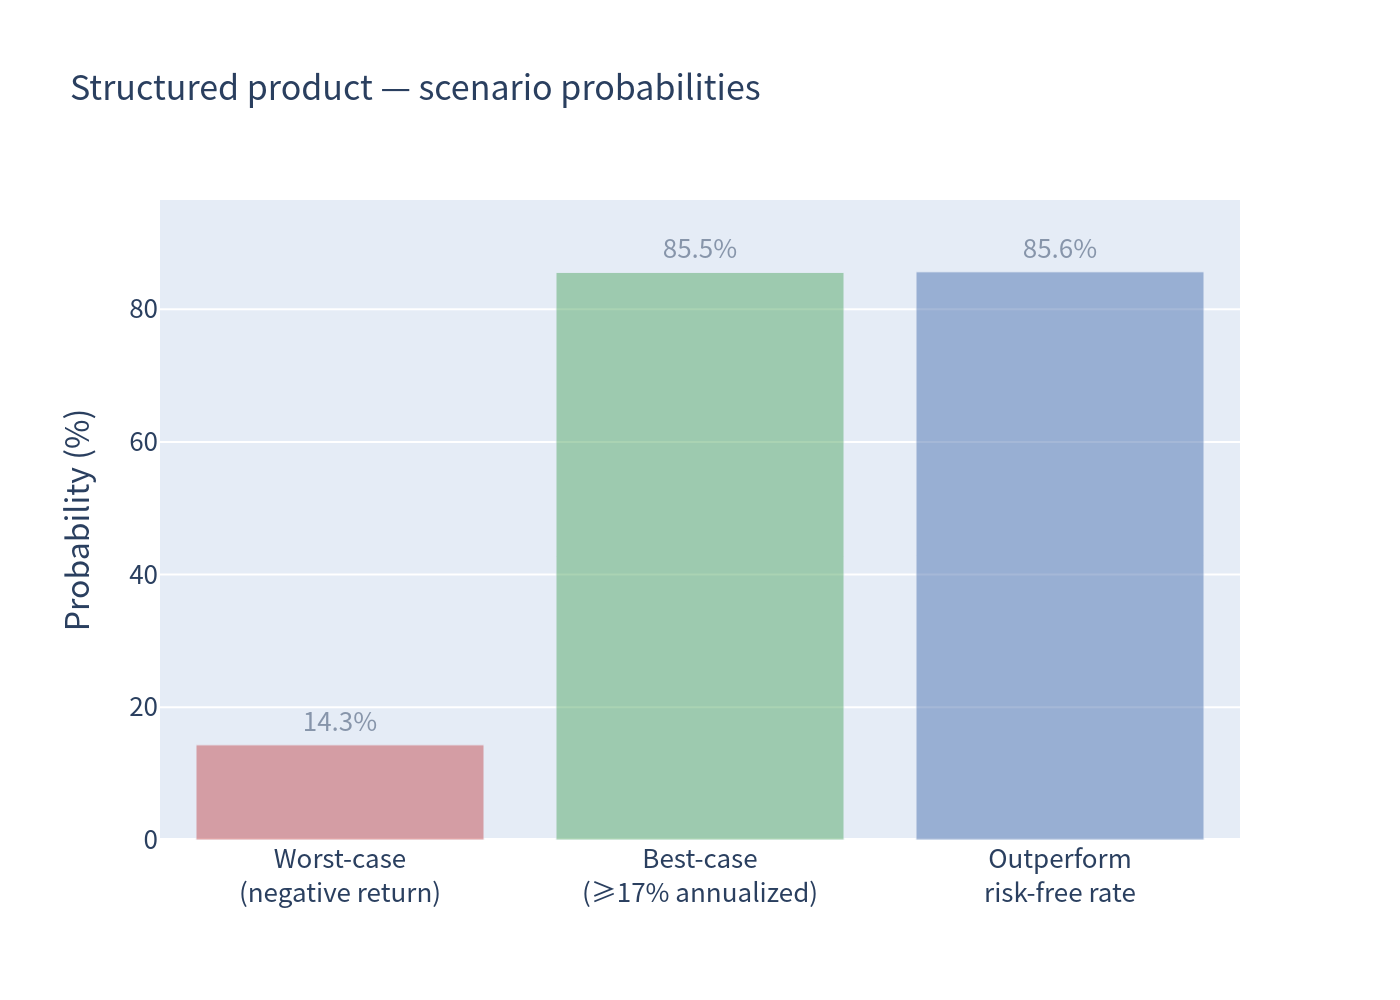
| Probability of loss | 14.34% | 38.15% |
| 99% confidence 1-year VaR | −41.18% | −41.23% |
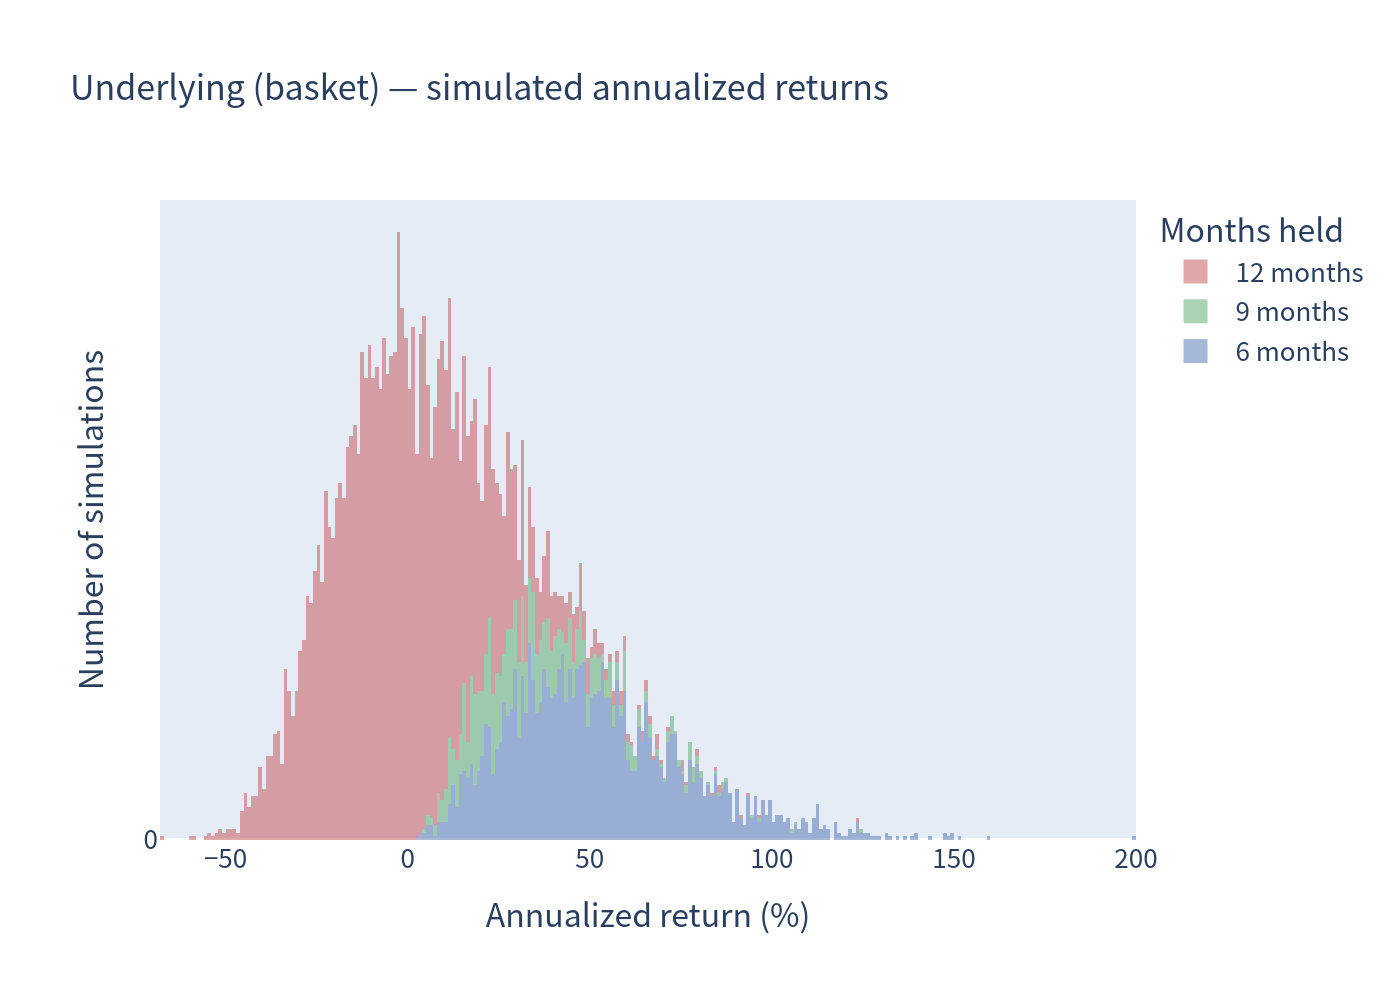
The underlying “basket” is an equal-weighted portfolio of the three shares, measured over the same realised holding periods as the product (including dividends).
Simulation outcomes
Product return vs underlying return
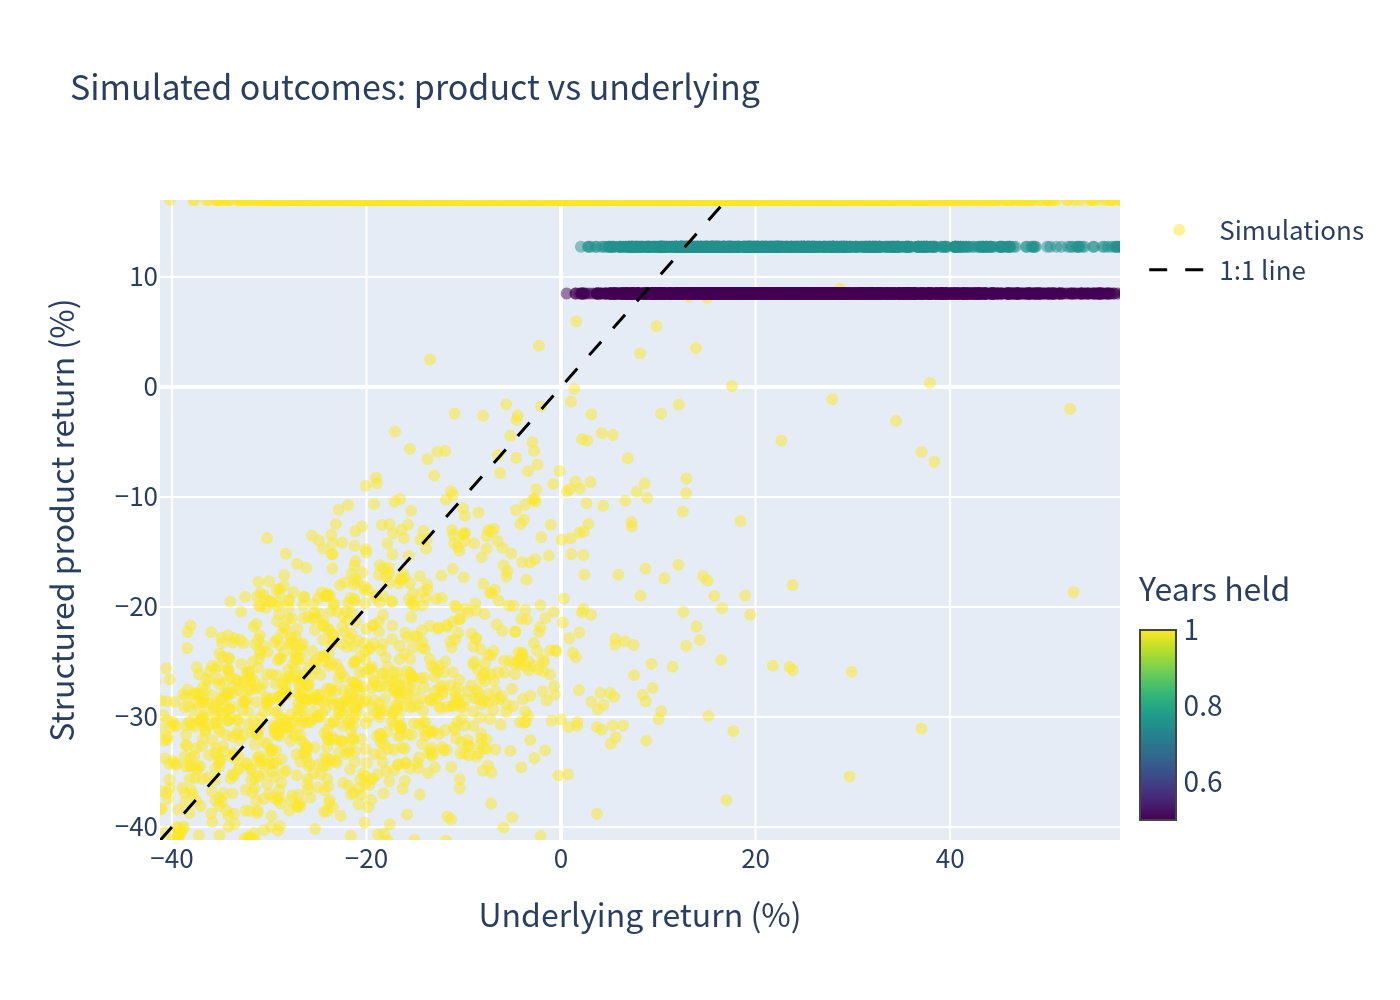
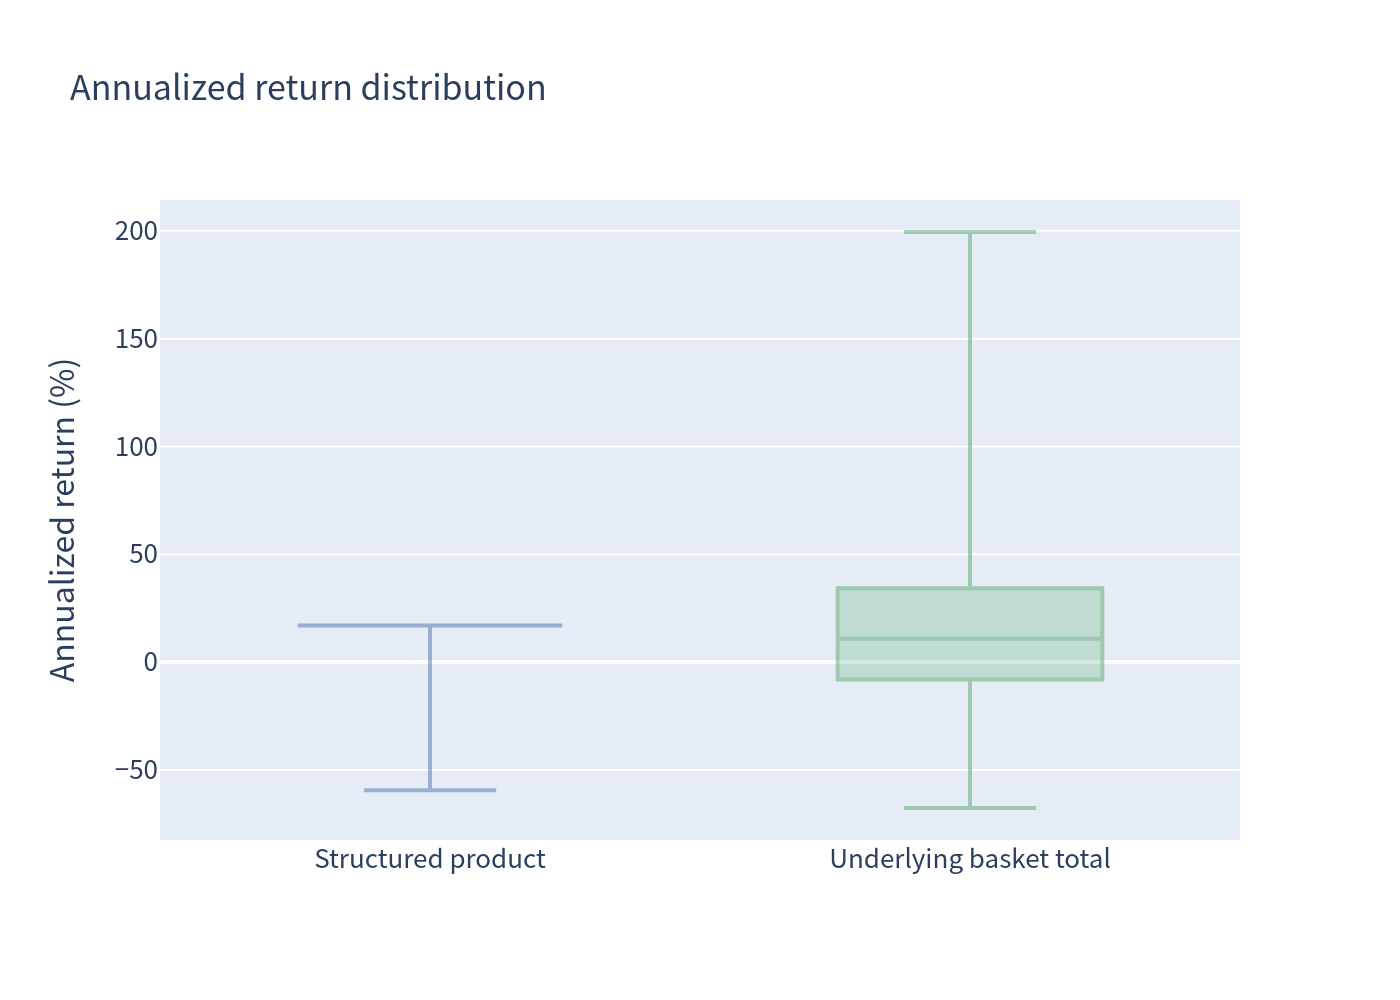
The scatter shows each simulated outcome against the equally-timed underlying return, coloured by holding period. The structured product’s return is capped at about +17% (the profile flattens at the top) while the downside tracks the underlying closely once the barrier is breached.
Distribution of annualized returns
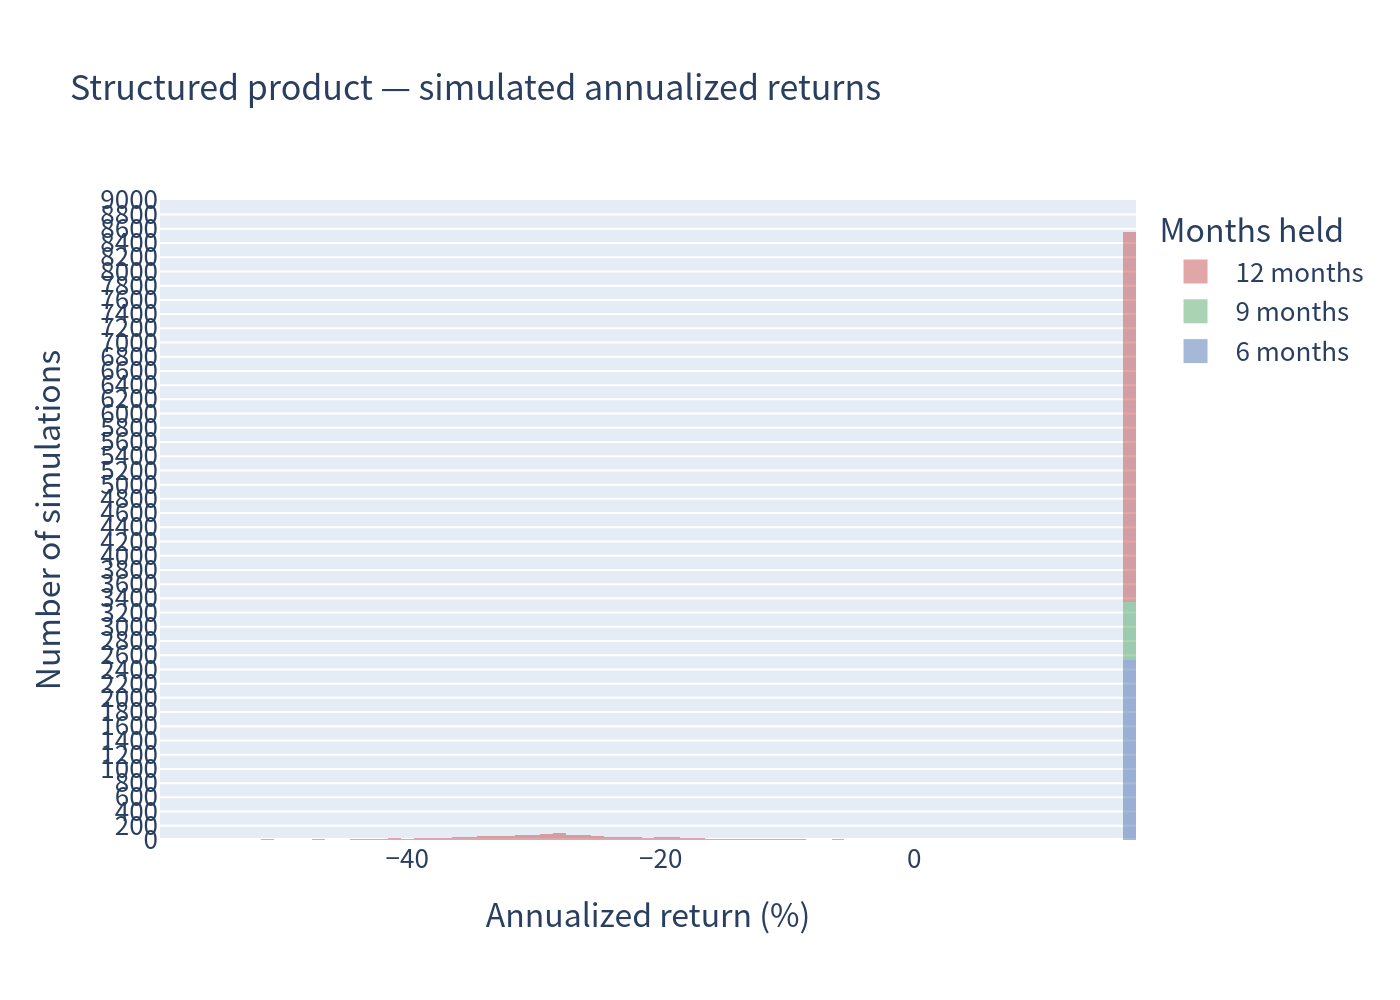
Structured product (stacked by holding period):
Underlying basket (stacked by holding period):
Risk / return profile
Scenario probabilities
Holding-period and coupon distribution
Expected-return breakdown
| Outcome | Probability | Comment |
|---|---|---|
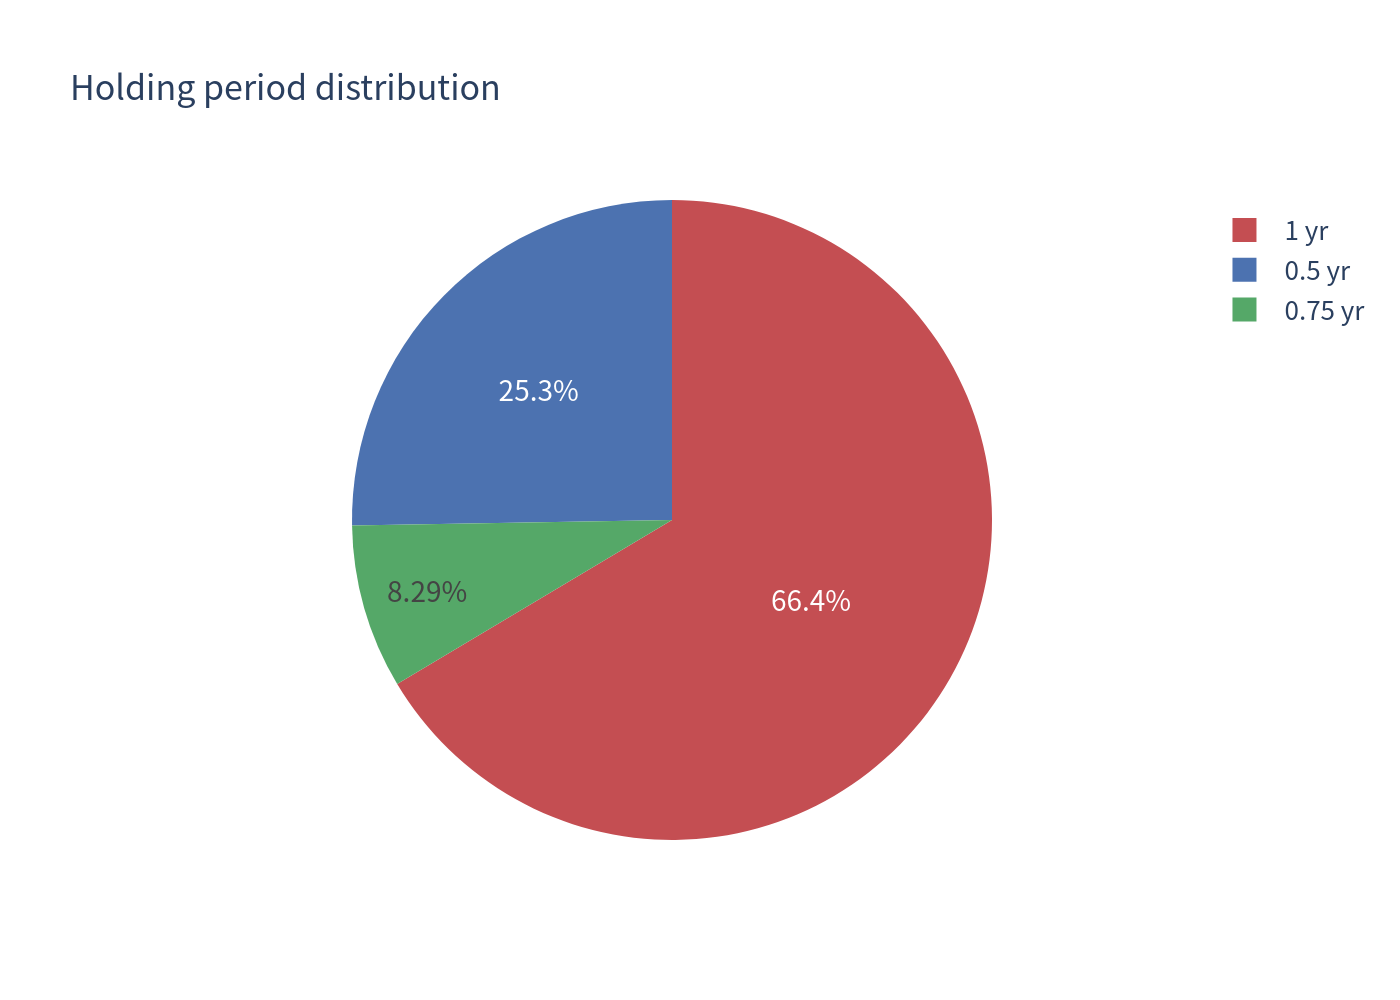
| Called early (month 6 or 9) | 33.6% | Redeemed at par plus accrued coupons |
| Held to maturity | 66.4% | Includes paths where the barrier was breached |
- Probability of a barrier event (continuous, worst-of): ≈ 14.6%.
- Probability of beating the risk-free rate: 85.64%.
- Probability of achieving at least a 17% annualized return: 85.55% (this includes paths redeemed early, where the shorter holding period still annualizes to 17%).
The expected annualized return of 10.50% sits below the headline 17% coupon: early redemptions shorten the coupon stream, and the roughly 15% of paths that breach the barrier suffer capital losses that more than offset the coupons earned.
Investment commentary
Points worth noting (favourable)
- High headline coupon of 17% p.a., paid unconditionally while the product is alive, provides a large cushion — a loss only occurs if the worst share ends below its starting level after the 55% barrier was breached.
- Meaningful buffer before capital risk: the worst share can fall up to 45% before the barrier is even touched, and even then the loss is only realised if it finishes below its start.
- Short ~1-year tenor limits the window of exposure, and the two issuer call dates mean capital is often returned early.
Points to be aware of
- Downside is fully exposed to the worst-performing name once the barrier is breached; the potential loss is limited only by that share falling to zero — the 99% VaR of −41% reflects this left tail.
- The issuer’s call right is one-sided: strong paths are redeemed early (limiting participation to the coupon), while weak paths are held to maturity — the expected return is therefore materially below the coupon.
- As a worst-of structure, a single weak share dictates the payoff even if the other two rise.