
Jump Notes with Auto-Callable Feature — Analysis Report
Headline Simulation Results
Simulation Detail
| Metric | Result |
|---|---|
| Expected annualized return | 12.29% |
| Probability of a negative return | 0.00% |
| 99% confidence VaR (1 year) | 0.00% |
| Expected annualized volatility | 2.37% |
| Expected holding period | ~1.6 years (19.2 months) |
| Expected total return over realized holding period | 17.69% |
| Probability of an automatic early redemption | 96.46% |
Product Overview & How It Works
- Type: Unsecured, fully-guaranteed “Jump Notes with Auto-Callable Feature”; no periodic coupon/interest.
- Issuer / Guarantor: Morgan Stanley Finance LLC / Morgan Stanley.
- Stated principal: $1,000 per note (tracked here as an index of 100 points).
- Underlier: Morgan Stanley Amplitude Index™ — a proprietary index. The proprietary index has no public price history, so it is modelled with the S&P 500 as an equity benchmark proxy.
- Term: ~7 years (issue Nov 17, 2026 → maturity Nov 17, 2033).
- Key levels: Call threshold = 101% of the initial level; Upside participation rate = 100% (upside is uncapped at maturity).
- Principal protection: At maturity the investor receives at least the full stated principal — there is no knock-in/barrier that puts capital at risk.
In plain terms: Each year, on the annual check date, if the index is at or above 101% of where it started, the note “calls away” and pays you a stepped-up amount — roughly a 13% simple return per year held (13% after year 1, 26% after year 2, … up to 78% after year 6). Because the trigger is only 1% above the starting level, the note is very likely to call in year 1 and pay ~13% annualized. If the index never calls, at maturity you keep 100% of principal plus the full upside if the index rose; if the index is down, you simply get your principal back (no loss). The trade-off for that protection is a cap on upside: in practice the annualized return is bounded at about 13% and floored at 0%.
Performance Summary
| Metric | Structured Product | S&P 500 (benchmark, same-horizon total return) |
|---|---|---|
| Expected annualized return | 12.29% | 14.38% |
| Expected annualized volatility | 2.37% | 10.50% |
| Probability of loss | 0.00% | 2.39% |
| 99% confidence VaR (1 year) | 0.00% | −4.14% |
| Median annualized return | 13.00% | 12.52% |
Reading the comparison: The note delivers a return that is slightly lower than the benchmark on an average basis (12.29% vs 14.38%), because the autocall feature converts to cash at ~13% annualized whenever the market is up, forgoing further gains. On a median basis the note (13.00%) actually edges the benchmark (12.52%). The decisive difference is risk: the note has a zero probability of loss and zero VaR, versus a benchmark that can lose money (−4.14% at the 99% level). The note also comfortably exceeds the 3.85% risk-free rate in the vast majority of scenarios.
Simulation Outcomes for Each Path
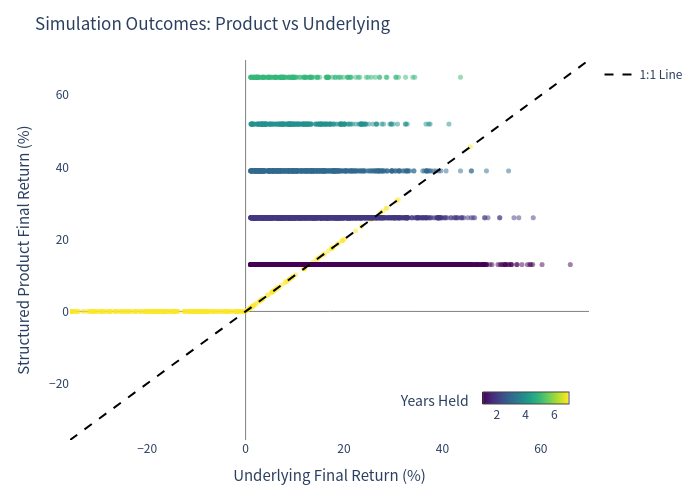
Each dot is one simulation: the horizontal axis is the benchmark's final return and the vertical axis is the note's final return; colour shows how many years the note was held. Points above the dashed 1:1 line are paths where the note beat the benchmark. The chart is the clearest picture of the trade-off: the note hugs a narrow band near +13% (early autocalls) with a floor at 0%, while the benchmark fans out across a much wider range of gains and losses.
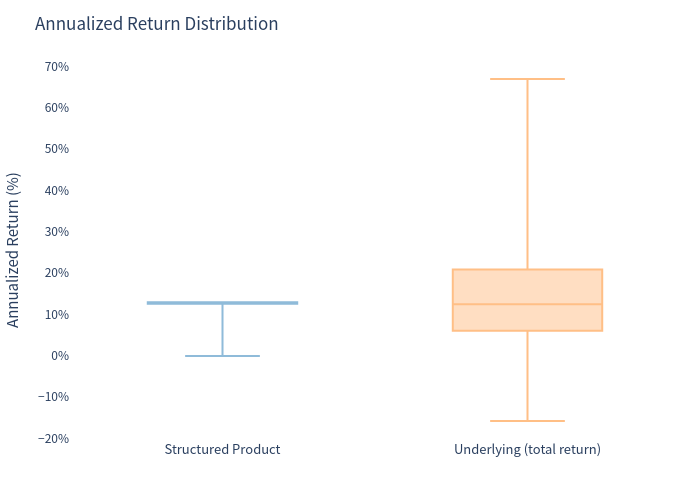
Distributions of Annualized Returns
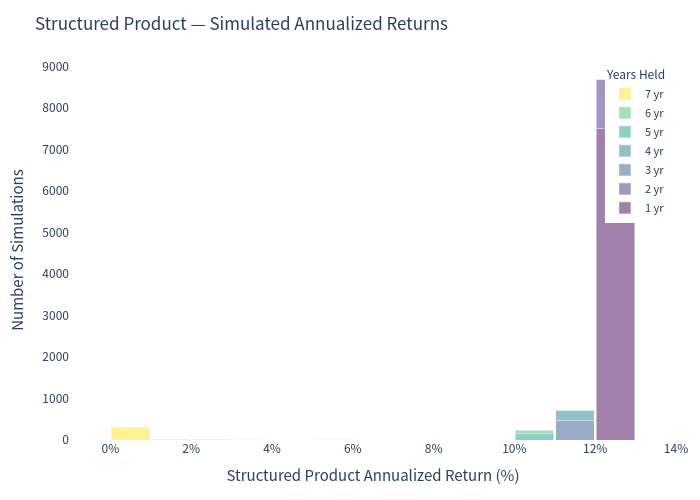
Structured Product
Outcome is highly concentrated: ~75% of paths land at +13.0% (year-1 autocall), with a small tail down to 0% for the ~3% of paths that run to maturity through a weak market.
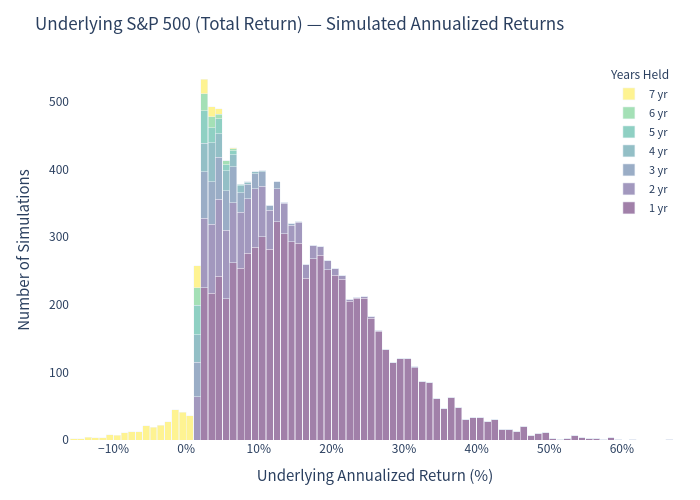
S&P 500 Benchmark (Total Return)
A much wider, right-skewed distribution spanning roughly −16% to +67% annualized, capturing both the strong rallies the note caps out of and the drawdowns the note is protected against.
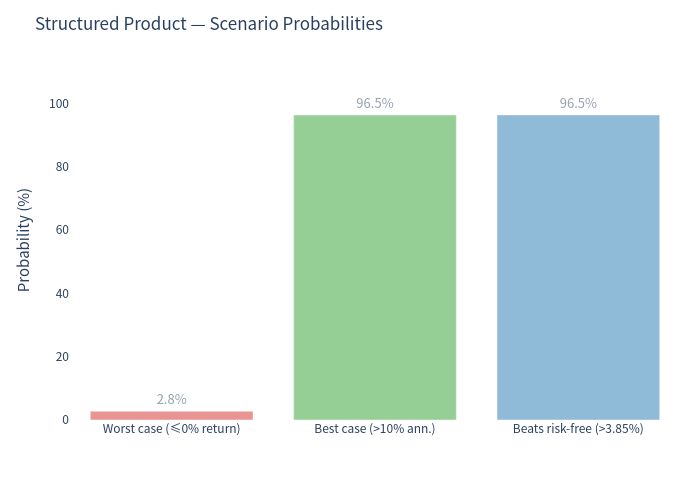
Scenario Probabilities
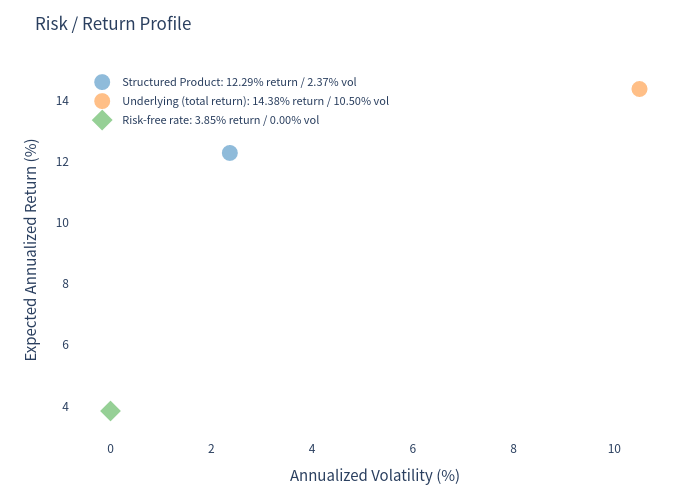
Risk / Return Positioning
The note sits far to the left of the benchmark (very low volatility) at a strong positive expected return, offering a risk-return trade-off that is attractive if the investor values capital certainty over maximum upside.
Holding Period
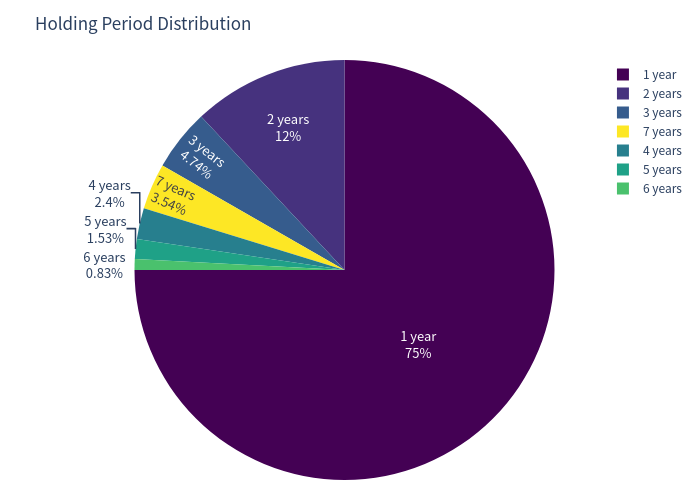
Automatic early redemption dominates: about 75% of paths finish after one year, and ~92% finish within two years. Only ~3.5% of paths run the full seven years to maturity — precisely the scenarios in which the market failed to clear the 101% trigger.
Investment Commentary
Favourable characteristics
- Hard principal protection: The worst simulated outcome is a return of principal (0%); there is no capital-loss scenario in the structure. Probability of loss and 99% VaR are both 0%.
- High, near-certain absolute return: ~96% of paths exceed the 3.85% risk-free rate, with ~75% delivering ~13% in the first year.
- Low volatility, high consistency: A very narrow outcome band (2.37% annualized dispersion) with a median return above the benchmark's median.
- Uncapped maturity upside: If the note is not called and the index finishes above its start, investors keep 100% of the appreciation.
Considerations / limitations
- Upside is effectively capped: Early autocalls lock in ~13% annualized; later calls give progressively less annualized return (≈12.2% year 2, ≈11.6% year 3, down to ≈10.1% year 6) because the stepped cash amounts are simple, not compounded. In a sustained bull market the note will lag a direct index holding.
- Reinvestment risk: Because the note is very likely to call in year 1, the attractive 13% may only last one year, after which proceeds must be re-deployed (possibly at lower rates).
- Return depends on a proprietary index: The actual underlier is the Morgan Stanley Amplitude Index, whose behaviour may differ from the S&P 500 proxy used here; a volatility-controlled index could dampen both the call trigger and maturity upside.
- Credit exposure: All payments depend on the issuer/guarantor (Morgan Stanley) honouring its obligations.
- No income: The note pays no coupon, so there is no cash flow if capital is tied up for the full term.
Annualized figures should be read together with the holding period: because the average life is only ~1.6 years, the headline annualized return is dominated by the strong year-1 autocall outcomes. Numbers rounded to two decimals. All analysis is hypothetical and for illustrative purposes only.