
Callable Jump Notes due February 4, 2031 — Simulation & Risk Report
1. Headline simulation results
| Metric | Structured product | Underlying index |
|---|---|---|
| Expected annualized return | 10.53% | 13.90% |
| Probability of negative return | 0.00% | 6.88% |
| 99% confidence VaR (1 year) | 0.00% | −9.94% |
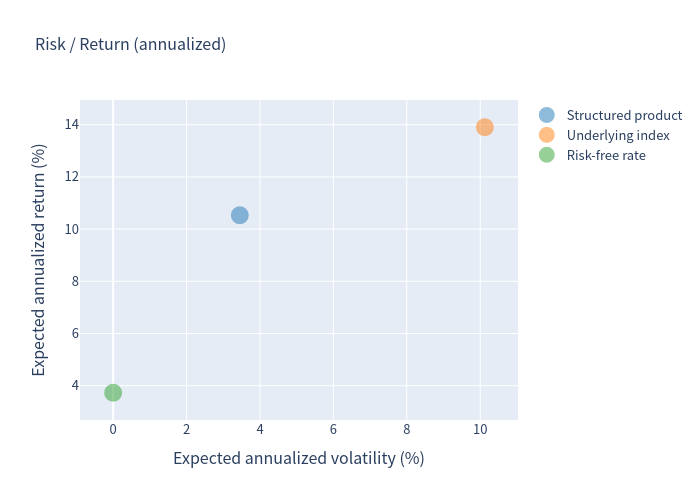
| Expected annualized volatility | 3.45% | 10.13% |
| Probability of beating the risk-free rate (3.73%) | 90.41% | — |
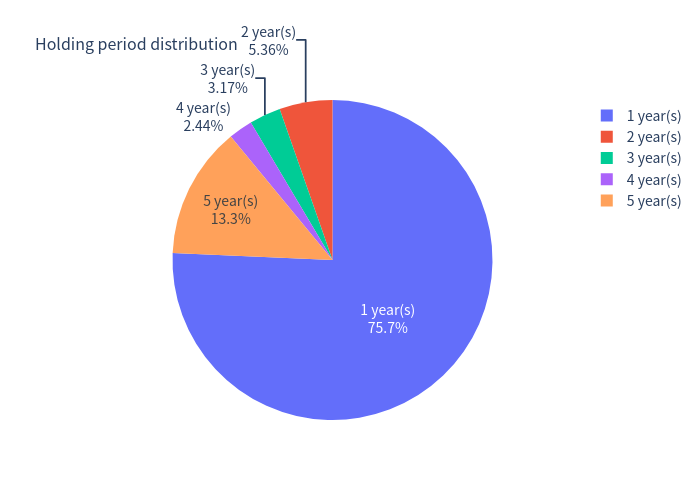
| Expected holding period | 1.82 years (≈ 22 months) | — |
| Expected total return over the realized holding period | 15.63% | 16.51% |
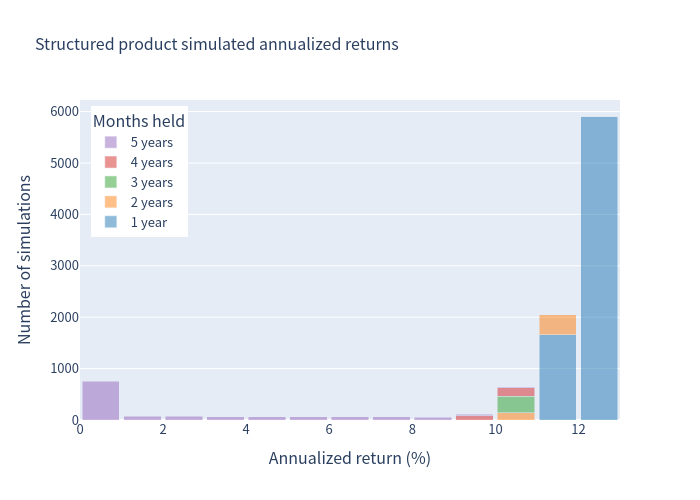
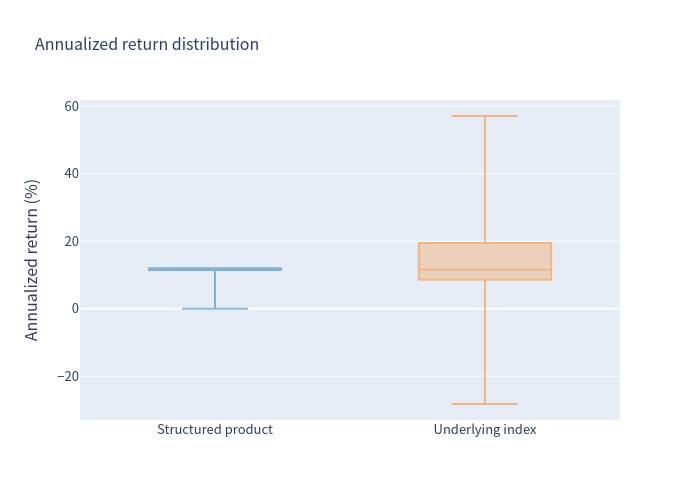
Reading the headline numbers. Because the note is fully principal-protected, its worst simulated outcome is simply the return of principal — so the probability of a negative return and the 1-year VaR are both 0.00% (on a hold-to-redemption basis). The median simulated annualized return is 12.00%, and 86.66% of paths end in an early redemption. The trade-off for that downside protection is a capped upside: strong equity rallies trigger the issuer's call, so the investor earns the fixed 12%-per-year accrual rather than the full equity gain.
2. What this product is — in plain language
This is a principal-protected, callable note. The investor's money is not exposed to losses from the index (principal is returned in full at maturity), but the note gives up regular income and parts of the upside in exchange for (i) a guaranteed repayment of principal and (ii) potential extra return.
- No coupons. The note pays no regular interest.
- If the market rises a lot, the note is called early. Starting 12 months after issue, Morgan Stanley may redeem the note on any monthly date whenever its own valuation model says doing so is "economically rational." A redemption pays a pre-set amount that steps up by $10 (1% of principal) each month — starting at $1,120 on the first redemption date and rising to $1,590 on the last one just before maturity. This is the "jump" feature: ≈12% per year, simple.
- If the note is never called, it runs to maturity. At maturity the investor receives principal plus 160% of the index's gain (the upside is not capped at maturity). If the index is flat or down at maturity, only the principal is returned — never less.
- The issuer's early-redemption right means the investor's upside is effectively capped in strongly rising markets, while keeping participation in steady markets and full protection on the downside.
3. Key statistics
| Expected annualized return | Expected annualized volatility | Probability of loss | 99% VaR (1 year) | |
|---|---|---|---|---|
| Structured product | 10.53% | 3.45% | 0.00% | 0.00% |
| Underlying index (excess-return) | 13.90% | 10.13% | 6.88% | −9.94% |
The underlying index is an excess-return index and does not distribute dividends, so no dividend adjustment applies to the benchmark comparison.
4. Charts
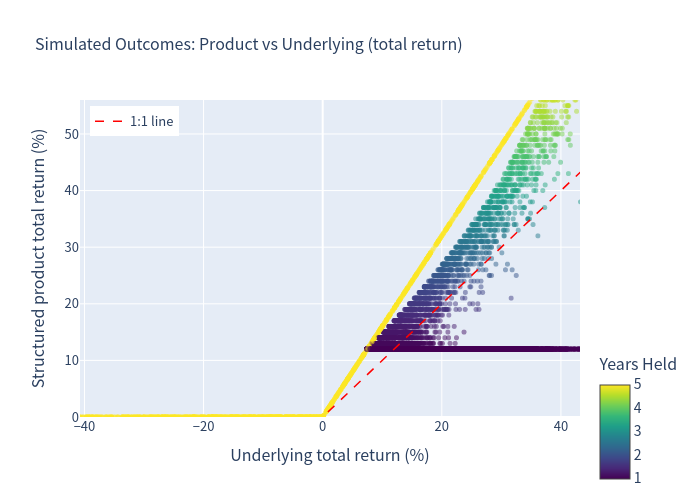
Simulation outcomes — product vs underlying
Each point is one simulated path; the dashed line is the 1-for-1 line. Almost all points sit on or above the 1:1 line on the downside (protection) and below it on the strong-upside side (the call caps gains).
Structured-product annualized-return distribution
Stacked by holding period.
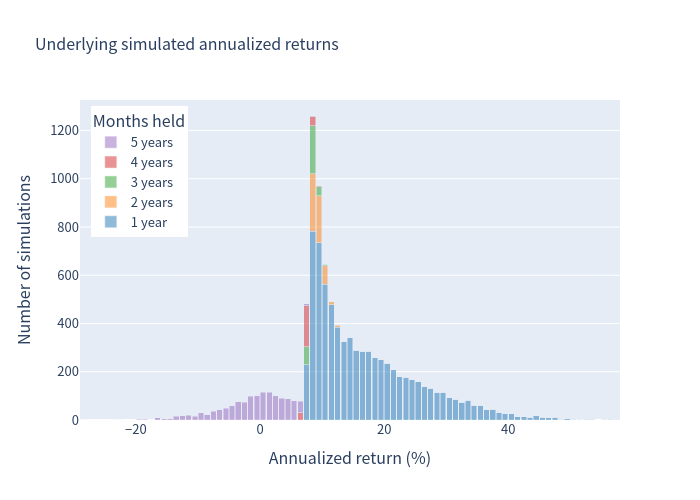
Underlying annualized-return distribution
Stacked by holding period.
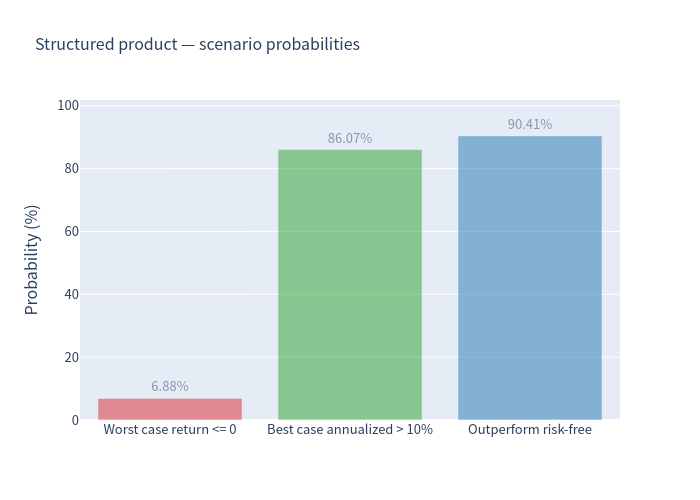
Scenario probabilities
Scenario probabilities for the structured product.
Risk / return comparison
Risk and return positioning of the product versus the underlying index.
Annualized-return distribution (box plot)
Dispersion of simulated annualized returns.
Holding-period distribution
How the simulated holding periods are distributed, driven by early redemption.
5. Investment commentary
Strengths
- Full principal protection. No simulated scenario produces a loss: the note returns at least par at maturity, and VaR is 0%.
- Attractive accrual if called. The redemption amount steps up 1% of principal per month (≈12% p.a., simple), and the note is redeemed early in ~87% of simulations — the median outcome is a clean 12% annualized.
- Retains equity upside when not called. If the index grinds higher without triggering the call, the investor keeps the full 160% participation to the index gain at maturity.
- Favourable risk-adjusted return. The product's expected return (10.53%) is achieved with roughly one-third of the underlying's volatility (3.45% vs 10.13%), and it beats the risk-free rate in 90% of paths.
Considerations
- Capped / uncertain upside. In strong rallies the note is called and the investor receives the fixed accrual rather than the equity gain; the realised return is therefore capped near 12% annualized even when the index does much better.
- Single equity-index exposure. The payoff depends solely on one equity futures index — no diversification.
- Issuer / credit risk. Payments depend on Morgan Stanley's ability to pay (the note is unsecured and only guaranteed by Morgan Stanley).
- Trade-off of protection. As with any principal-protected structure, the embedded protection is paid for through forgone income and capped upside.
This commentary is descriptive of the simulated results and is not investment advice or a suitability assessment.