
Morgan Stanley Market-Linked Notes
due August 30, 2029
| Metric | Value |
|---|---|
| Expected Annualized Return (Product) | 4.33% |
| Expected Total Return over 3-Year Holding Period | 13.73% |
| Expected Holding Period | 3.00 years (fixed, held to maturity) |
| Probability of Negative Return | 0.00% |
| 99% Confidence VaR (1 year) | 0.00% |
| Probability of Receiving Maximum Payment (Cap) | 64.91% |
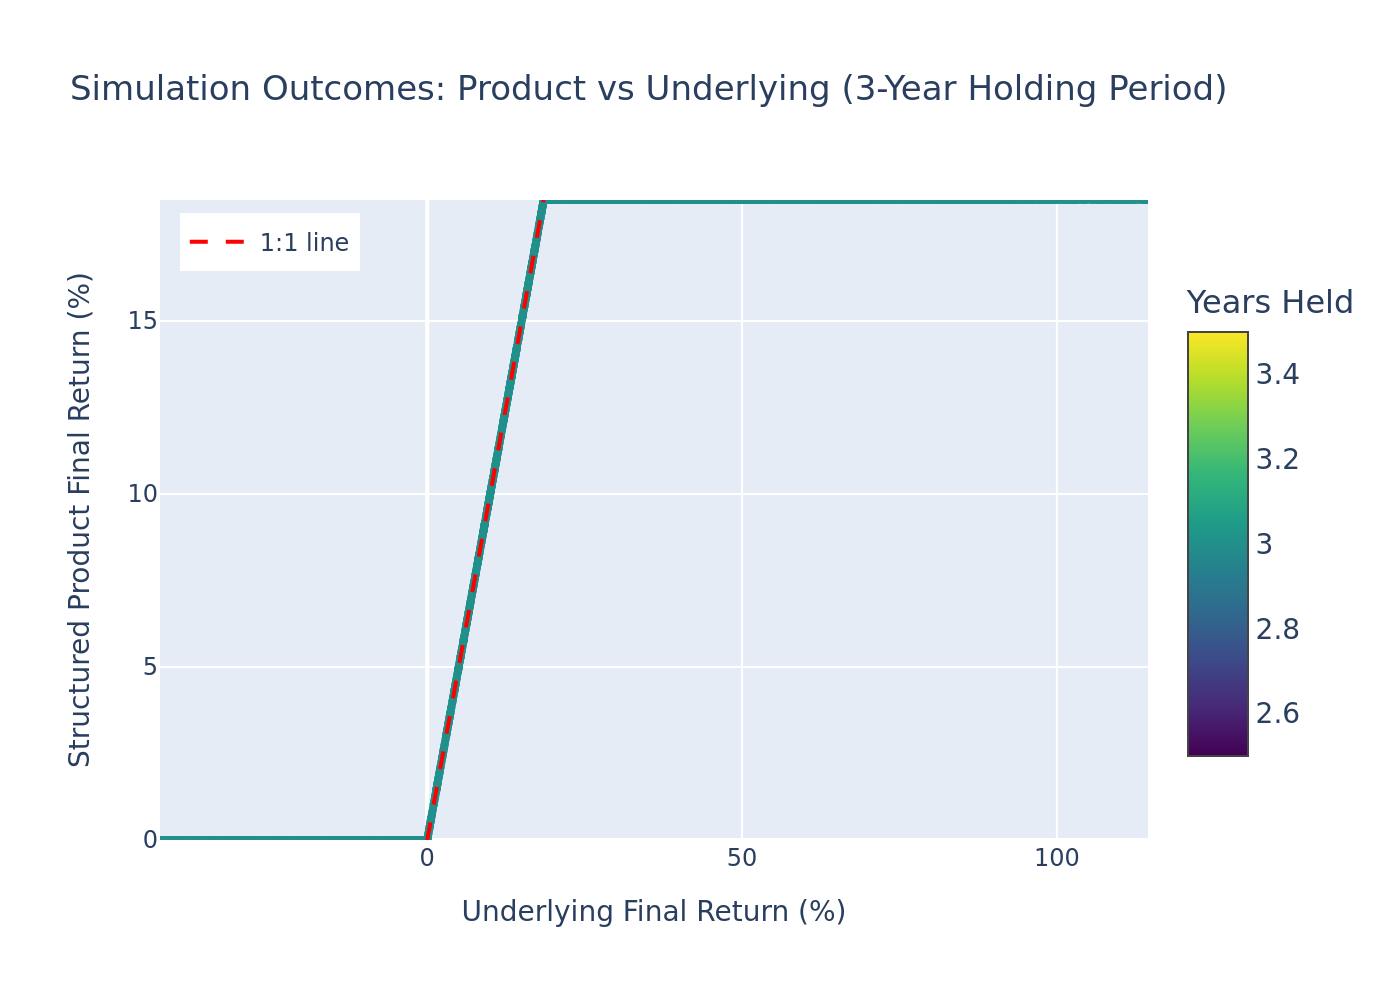
The note offers full principal protection with 100% participation in the S&P 500 Index's upside, capped at 118.50% of the stated principal amount (i.e., a maximum gain of 18.50% over the ~3-year term, or 5.82% annualized). Because the note is always held to maturity (36 months), the annualized figures here are not distorted by short holding periods.
- Issuer / Guarantor: Morgan Stanley Finance LLC (fully and unconditionally guaranteed by Morgan Stanley)
- Product Type: Market-Linked Note — principal-protected with capped upside
- Underlying: S&P 500® Index (single index)
- Stated Principal Amount: $1,000 per note
- Tenor: ~3 years (issued Aug 2026, matures Aug 30, 2029)
- Coupon / Interest: None (the notes pay no interest)
- Early Redemption / Barrier: None (no autocall, no knock-in/out features)
How It Works (Layman Explanation)
At maturity (3 years), the S&P 500 Index's closing level is compared to its initial level:
- If the Index is up: you receive your $1,000 back plus 100% of the Index's gain, but only up to a maximum payment of $1,185 per note (an 18.50% total gain). Any Index gain beyond that is not passed through.
- If the Index is flat or down: you still receive your full $1,000 back — the note never loses principal.
In short, you trade away the upside beyond 18.5% and any dividend income in exchange for guaranteed principal and a share of the Index's gains.
| Metric | Structured Product | Underlying (S&P 500, Total Return) |
|---|---|---|
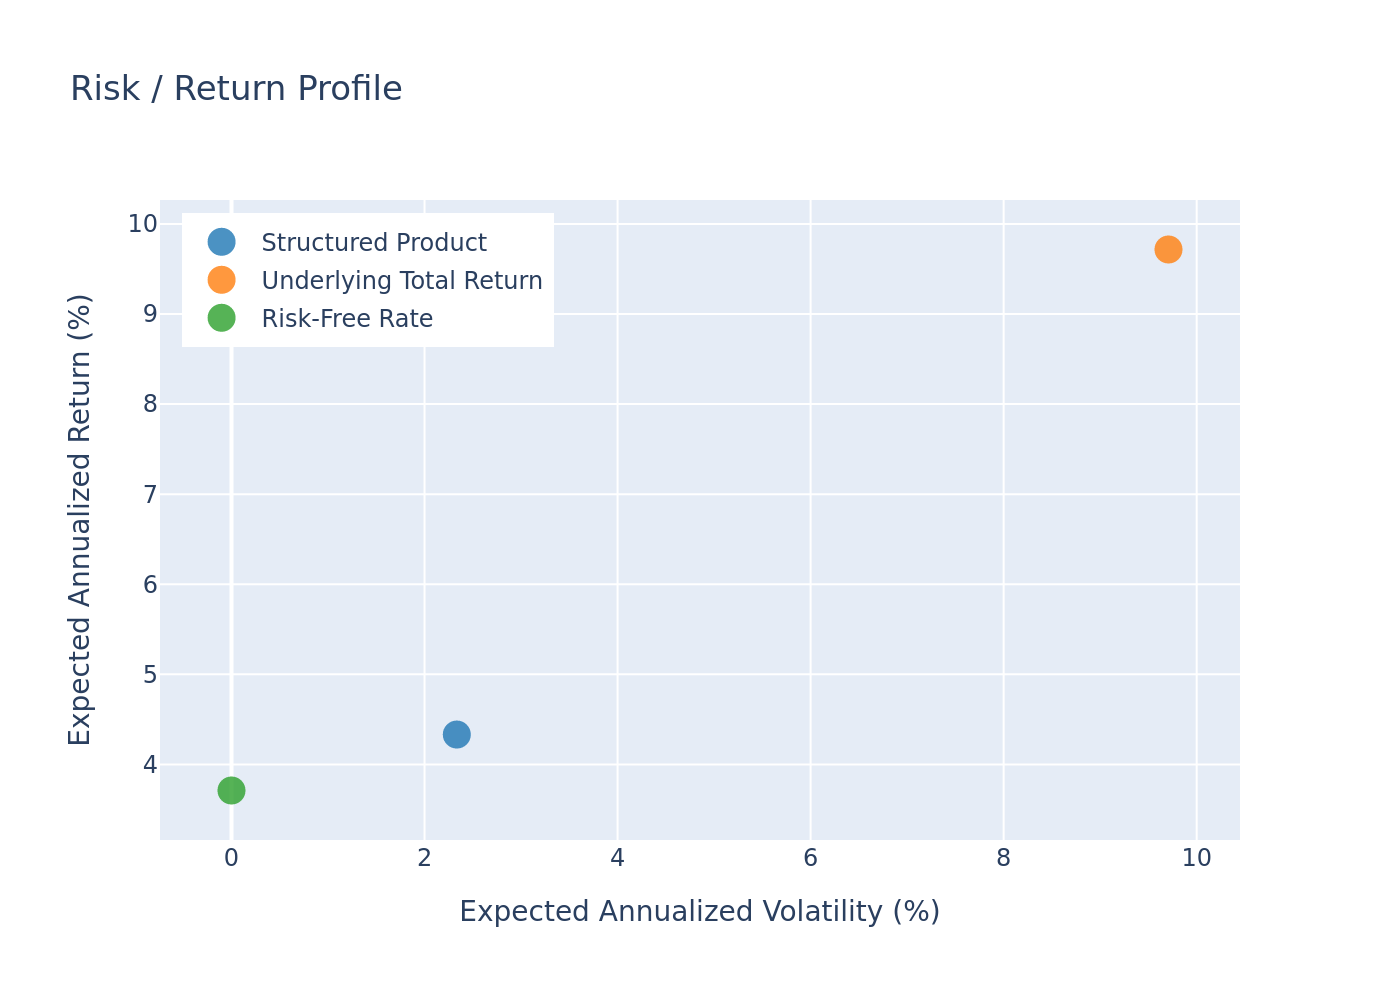
| Expected Annualized Return | 4.33% | 9.72% |
| Expected Annualized Volatility | 2.33% | 9.71% |
| Probability of Loss | 0.00% | 15.27% |
| 99% Confidence VaR (1 year) | 0.00% | -15.81% |
Underlying total return includes an estimated dividend yield of 1.01% (ignoring compounding). Underlying price-only expected annualized return: 8.71%.
Simulation Outcomes: Product vs Underlying (3-Year Return)
Each point represents one simulated 3-year path for the structured product and the underlying index.
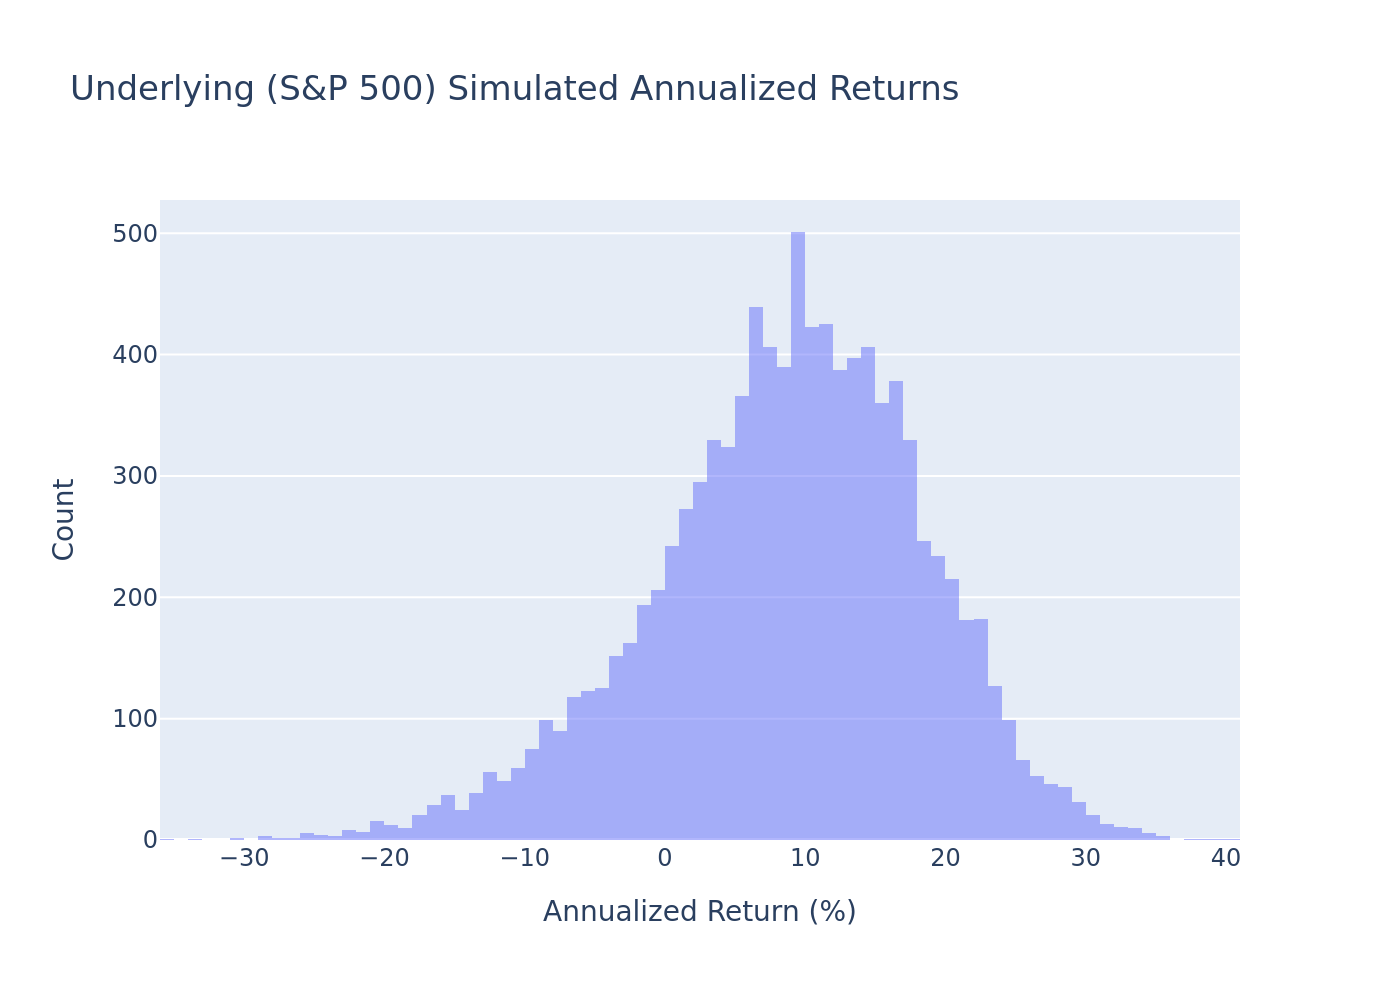
Underlying Simulated Annualized Returns
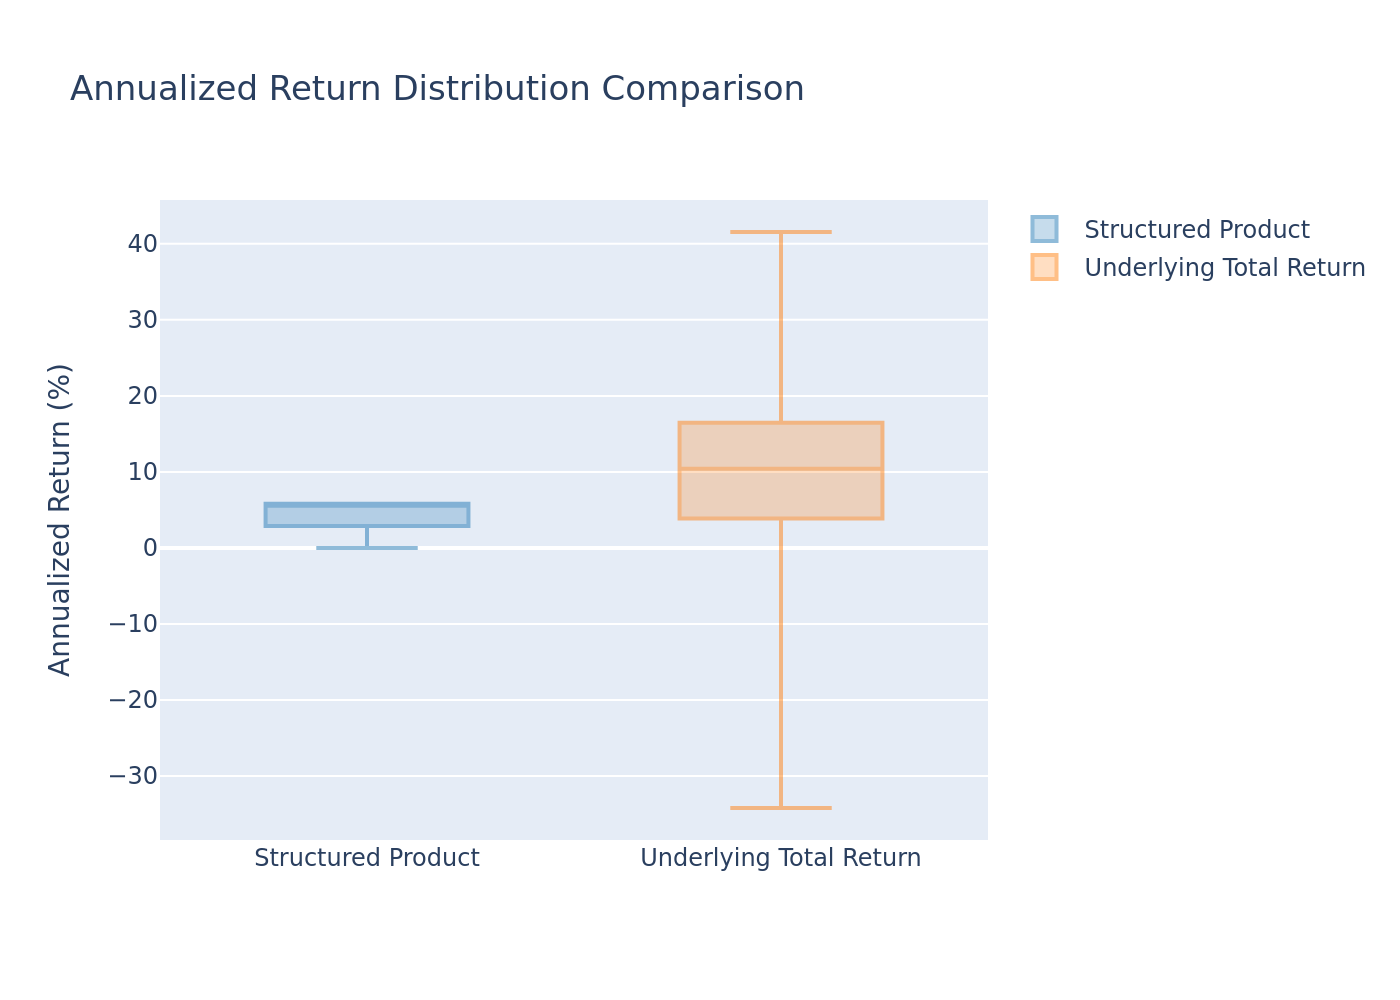
Distribution of simulated annualized returns for the S&P 500 Index (total return basis).
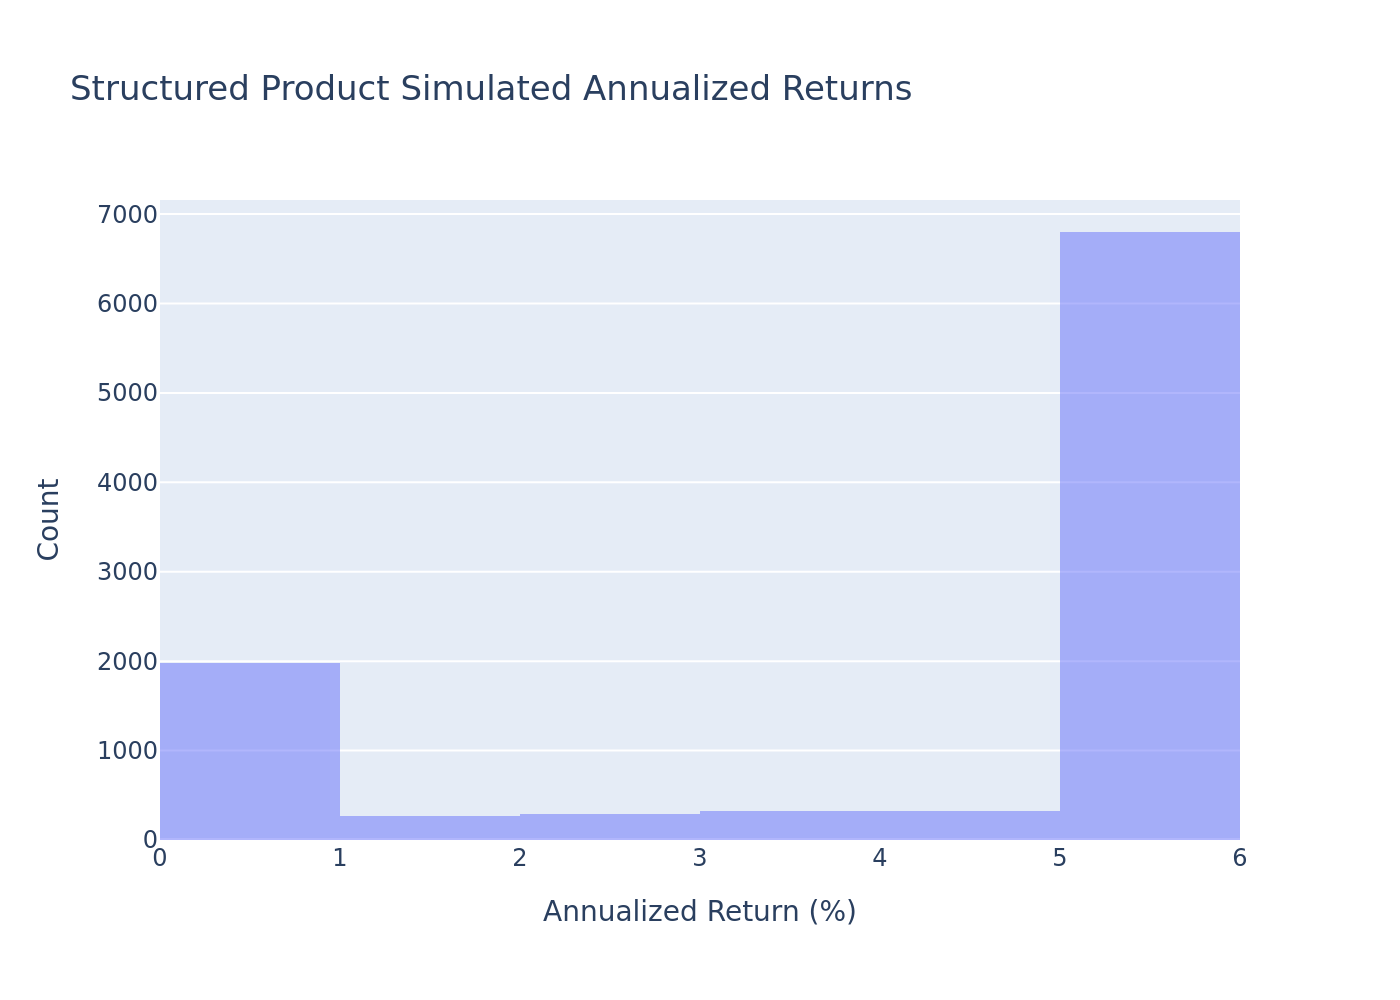
Structured Product Simulated Annualized Returns
Distribution of simulated annualized returns for the structured product, illustrating the capped, principal-protected payoff profile.
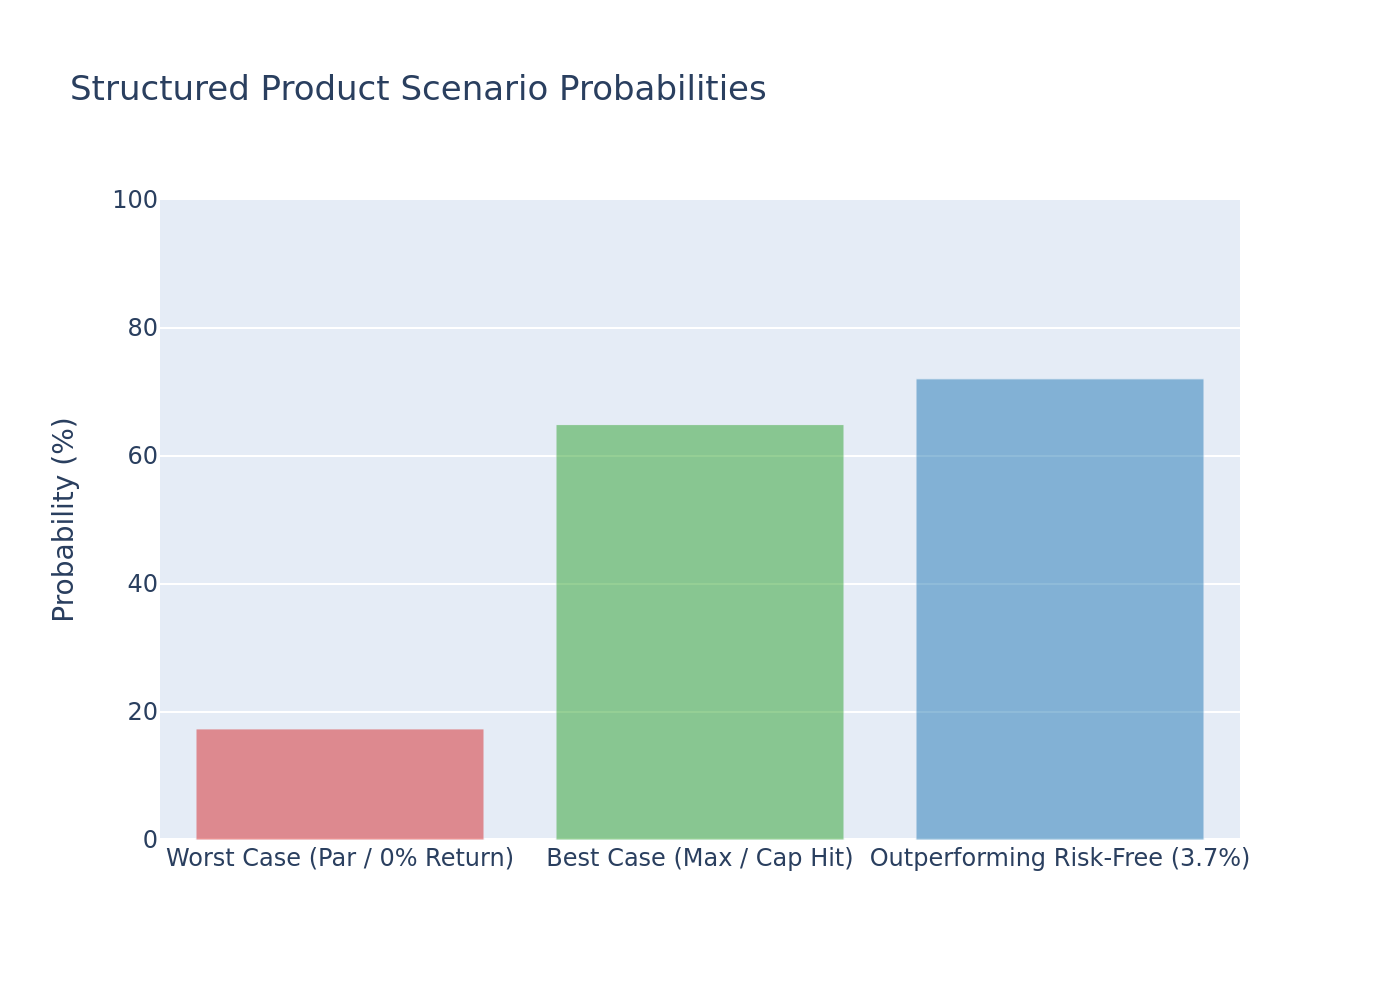
Scenario Probabilities
Probability of key outcome scenarios across the 10,000 simulated paths.
Risk / Return Profile
Positioning of the structured product relative to the underlying on a risk-adjusted basis.
Annualized Return Distribution Comparison
Side-by-side boxplot comparison of simulated annualized return distributions.
Key strengths:
- Full principal protection: Under no scenario (across 10,000 simulations) does the note lose money — probability of loss is 0.00%, and the 99% VaR is 0.00%.
- Meaningful upside capture: The note participates 1-for-1 in S&P 500 gains up to the cap; in 64.91% of simulated scenarios the maximum payment of 118.50% is reached.
- Low volatility profile: Annualized volatility of just 2.33% vs 9.71% for the Index, reflecting the removed downside.
- Positive return in the majority of scenarios: 82.64% of paths produce a positive return, and 72.06% outperform the 3.71% risk-free rate.
Points to weigh:
- Capped upside: The maximum annualized return is 5.82%, so the note forgoes any Index gain beyond +18.50% over the full term.
- No income: The note pays no interest or coupons, and the investor forgoes the S&P 500's dividend yield (about 1.01% per year).
- Opportunity cost: Expected annualized return of 4.33% is below the simulated expected total-return of the Index (9.72% annualized) — the principal protection "costs" the foregone upside and dividends in most strong-market scenarios.
This analysis is for informational purposes only and does not constitute financial advice or a suitability assessment.