
tokenengine.ai
Structured Product Evaluator |
info@tokenengine.ai
Structured Product Analysis Report
SSPA 1230 Yield-Enhancement
Currency: CHF
Term: ~21 months
ISIN: CH1593780799
Headline Simulation Results
3.79%
Expected annualized return
20.23%
Probability of negative return
−27.91%
99% confidence VaR (1-year)
1.63%
Expected total return (realized holding period)
13.23 mo
Expected holding period (≈ 1.10 years)
8.40%
Median annualized return
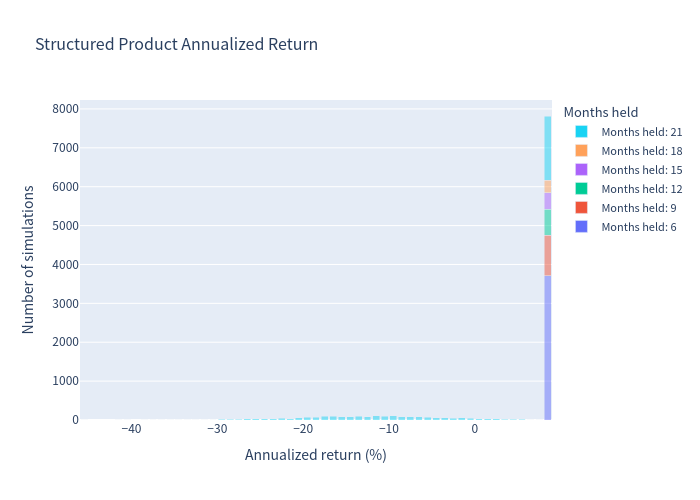
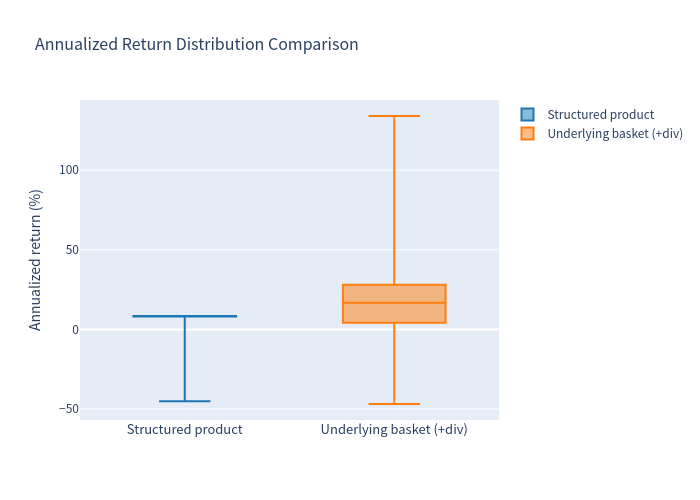
Key insight: The return distribution is strongly bi-modal: roughly
79% of simulations earn close to the full coupon rate (median ≈ 8.4% p.a.), while the
remaining ~20% (barrier breached with the worst-performing stock below its strike at
maturity) incur principal losses averaging about −13.7% p.a. The mean is therefore well
below the median — an important feature of this structure.
Basic Product Information
How it works (in plain terms)
This is a callable multi barrier reverse convertible — a yield-enhancement note referencing the three large Swiss insurers: Swiss Life, Swiss Re and Zurich Insurance.
- The investor pays CHF 5,000 per note (100%) and receives a fixed quarterly coupon of 2.10% (8.40% p.a.) — paid regardless of how the three stocks perform, as long as the note is still alive.
- The issuer can redeem ("call") the note early at the quarterly observation dates, paying back 100% plus that quarter's coupon. After an early redemption, no further coupons are paid.
- Downside protection (the "barrier"): If none of the three stocks ever trades at or below 69% of its starting level (i.e. no decline of 31% or more) during the whole life of the note, the investor gets 100% back at maturity (plus all coupons).
- If the barrier is breached (any one stock trades at or below 69%), the protection is lost: at maturity the repayment depends on the worst-performing stock. If the worst stock is below its starting level (100%), the investor receives shares of that stock (worth less than par); if it recovered to or above 100%, par is returned.
- Upside is capped — there is no participation in stock gains; the maximum outcome is par plus the fixed coupons.
Key modelling assumption (affects results): the term sheet gives the issuer an
unconditional early-redemption right but specifies no trigger. Results above assume the issuer calls on
the first observation date where all three underlyings trade at or above their initial level
(economically rational refinancing of the above-market coupon note). If the issuer never called, the
expected total return would rise to ~5.27% (higher coupon income) but the loss probability would rise
to ~25% (no early exits at par).
Key Statistics — Structured Product vs Underlying
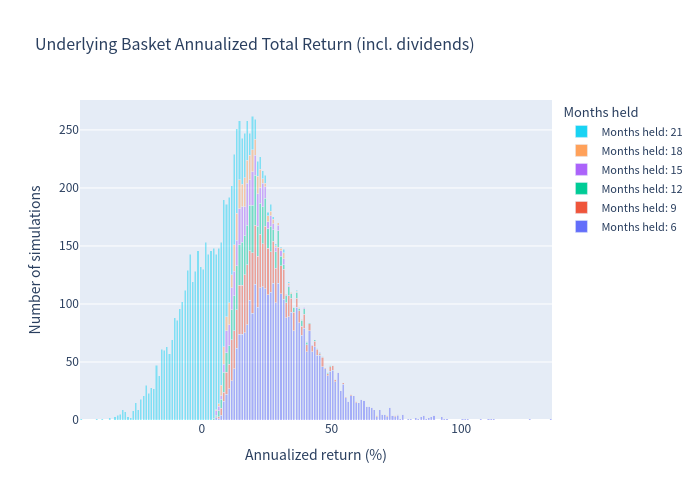
Benchmark = equal-weight basket of the three underlyings (total return, dividends added). Underlying returns are measured over the same (possibly early-exited) horizon as each product simulation.
| Metric | Structured Product | Underlying Basket (total return) |
|---|---|---|
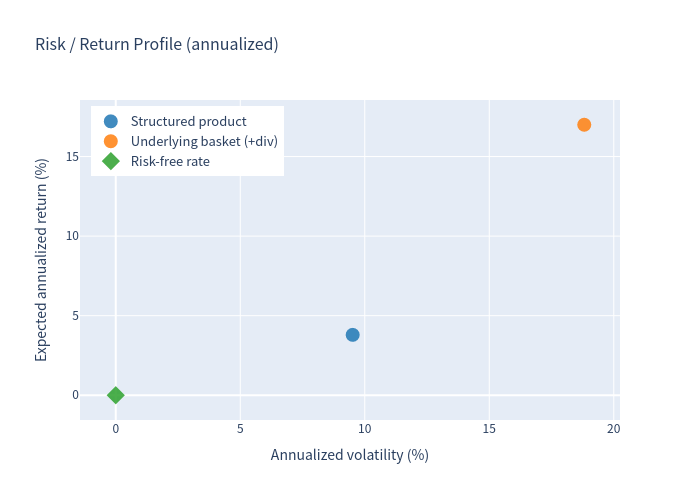
| Expected annualized return | 3.79% | 17.00% |
| Expected annualized volatility | 9.51% | 18.81% |
| Probability of loss | 20.23% | 18.93% |
| 99% VaR (1-year annualized) | −27.91% | −22.52% |
Note on the benchmark: because the product is issuer-callable, it tends to be redeemed
after the basket has rallied (all stocks above initial level). Measuring the underlying at those
same exit dates therefore produces higher average benchmark returns than a simple buy-and-hold Swiss
insurer basket (roughly drift + ~4.4% dividend yield, ~10% p.a.). This highlights that the note
forfeits most of the upside that the basket itself captures.
Charts
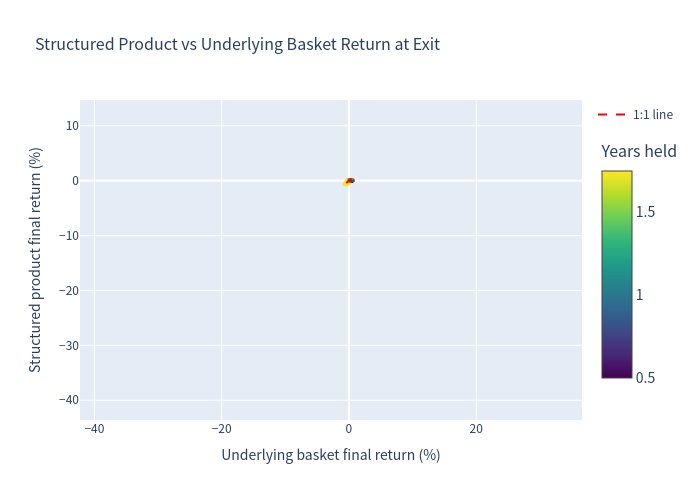
1. Simulation outcomes — product vs underlying return at exit
Colour = years the note was held; dashed red line is the 1:1 line.
2. Underlying basket — annualized total return histogram (1% bins, stacked by holding period)
3. Structured product — annualized return histogram (1% bins, stacked by holding period)
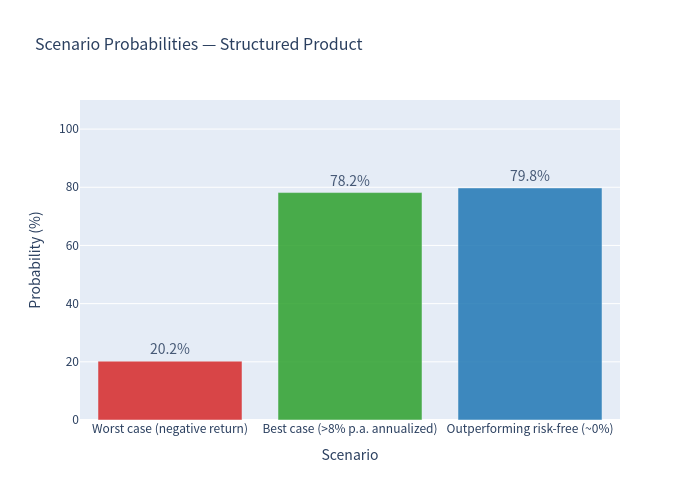
4. Scenario probabilities
5. Risk / return profile
6. Annualized return comparison (box plot)
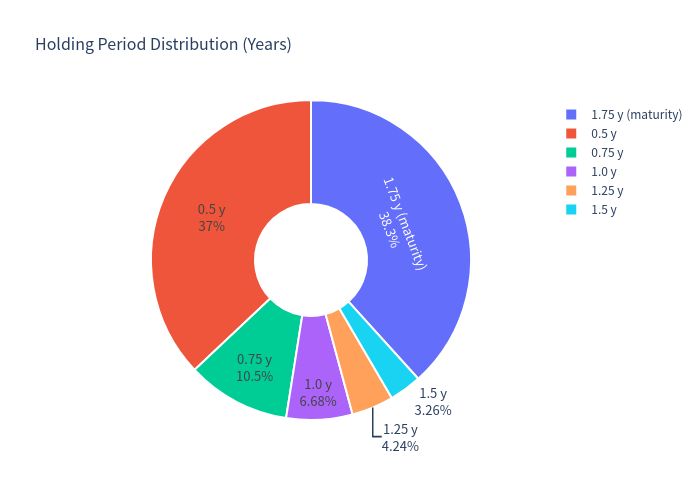
7. Holding-period distribution
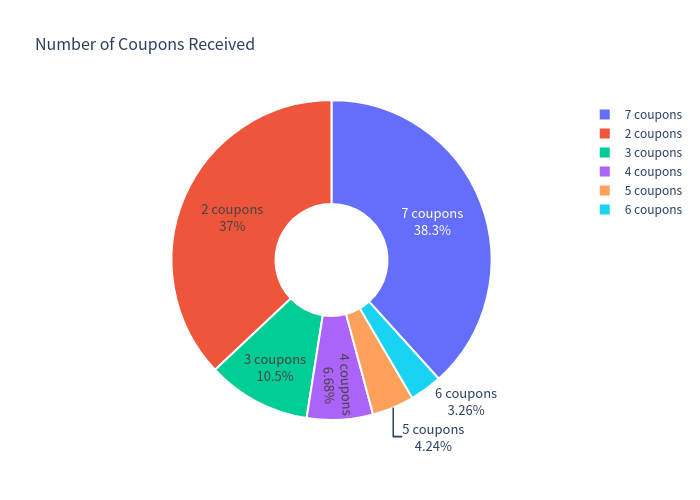
8. Number of coupons received
Investment Commentary
What the simulations show
- Coupon income is reliable but often truncated. In ~62% of simulated paths the issuer redeems early, typically after 6–18 months (37% of all paths end after just 6 months with two coupons = 4.20% total). While an early exit still equates to roughly the 8.4% p.a. coupon rate for the period held, the investor then faces reinvestment risk at much lower prevailing CHF rates.
- The tail, not the coupon, drives expected return. The note's expected annualized return (3.79%) is far below the headline 8.40% because ~20% of paths end with a net loss (after all coupons received). A net loss requires a barrier breach (any stock trading at or below 69% at some point) and a worst stock finishing low enough at maturity that the redemption falls short of the coupons already collected — in practice the worst stock ends well below its starting level. The average net loss among losing paths is ≈ −20% of capital (about −13.7% p.a. annualised).
- Downside is worst-of but trigger is any-of. A single weak stock is enough to switch off the protection; repayment is then driven by whichever of the three performed worst.
Strengths (good points worth mentioning)
- Attractive running income: 8.40% p.a. paid quarterly (2.10% per period), independent of share-price performance and continuing even after the barrier has been breached.
- Genuine conditional downside buffer: the barrier at 69% of initial level means all three stocks can decline (down to 69%, i.e. by up to just under 31%) with full capital returned at maturity, as long as none trades at or below 69% (simulated barrier-breach frequency ≈ 28%).
- No upside participation required: for investors seeking income rather than equity upside, the note converts stock-market uncertainty into a defined coupon stream.
- Diversified reference basket: three large, established Swiss insurers rather than a single name.
- Median outcome near the coupon rate: most simulated paths return 8.2–8.4% p.a., and ~80% of paths outperform the (≈0%) CHF risk-free rate.
Key risks to be aware of
- Issuer call shortens the coupon stream: in rising markets the note tends to be redeemed early, capping total income (e.g. 4.2% total after a 6-month call) and forcing reinvestment at lower rates.
- Principal risk on barrier breach: a net loss of capital is possible (up to a large portion of the note) if any stock trades at or below 69% and the worst stock finishes low enough at maturity; note the barrier is observed continuously (any time on any business day), not just at maturity.
- Worst-of exposure: the maturity payoff depends on the weakest of the three stocks.
- Credit risk of the issuer/guarantor (debt instrument, not a protected deposit).
This report is an independent quantitative analysis of the product's simulated return/risk profile.
It does not constitute financial advice or a suitability assessment.