
13.00% p.a. Multi Barrier Reverse Convertible
Roche Holding · Sandoz Group · VAT Group | Continuous Multi Barrier Observation | Callable
| Metric | Structured Product | Underlying Basket (w/ dividends) |
|---|---|---|
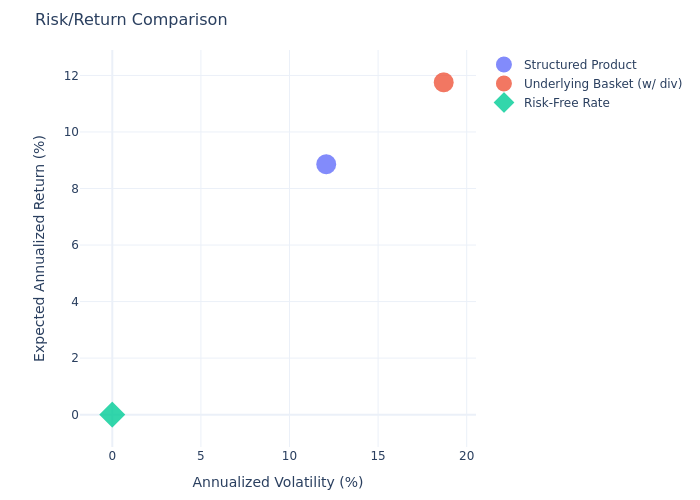
| Expected Annualized Return | 8.86% | 11.76% |
| Expected Annualized Volatility | 12.07% | 18.70% |
| Probability of Negative Total Return | 10.36% | 33.32% |
| 99% Confidence VaR (1 Year) | −36.11% | −20.26% |
| Expected Total Return (over holding period) | 8.91% | 6.93% |
| Average Holding Period | 12.75 months | 12.75 months |
How It Works
This is a Multi Barrier Reverse Convertible linked to three Swiss stocks: Roche Holding, Sandoz Group, and VAT Group. The product pays a fixed coupon of 13.00% p.a. (paid quarterly as CHF 32.50 per CHF 1,000 denomination) regardless of the underlying performance, subject to a conditional downside protection feature.
Key Mechanics:
- The investor receives a fixed coupon of CHF 32.50 per quarter (total of 5 coupons if held to maturity = CHF 162.50)
- The issuer has the right to call the product early on specified observation dates (month 6, 9, or 12) — modeled as calling when all underlyings trade above initial level
- A barrier at 55% of the initial level protects against losses: if no underlying ever falls below this level, the investor receives full par value at maturity
- If the barrier is breached AND the worst-performing underlying finishes below the initial level at maturity, the investor receives physical shares (or cash equivalent) of the worst performer, potentially incurring a capital loss
- The product's upside is capped: maximum return equals the total coupons received (up to 16.25%)
Issuer: Leonteq Securities AG Fitch: BBB−
Underlying Assets (Price Index = 100 at Initial Fixing)
| Underlying | Dividend Yield | Historical Annualized Volatility |
|---|---|---|
| Roche Holding AG | 2.99% | 20.99% |
| Sandoz Group AG | 1.23% | 32.16% |
| VAT Group AG | 1.20% | 35.30% |
Simulation Statistics (50,000 paths)
| Metric | Value |
|---|---|
| Barrier breach probability | 10.64% |
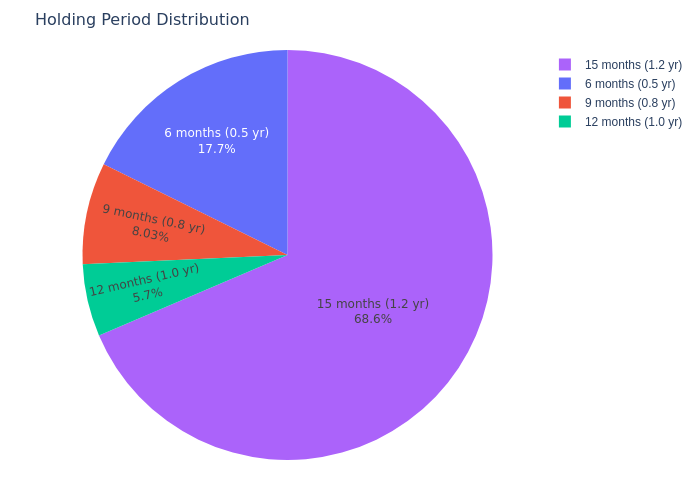
| Product called early by issuer | 31.42% |
| Held to maturity (15 months) | 68.58% |
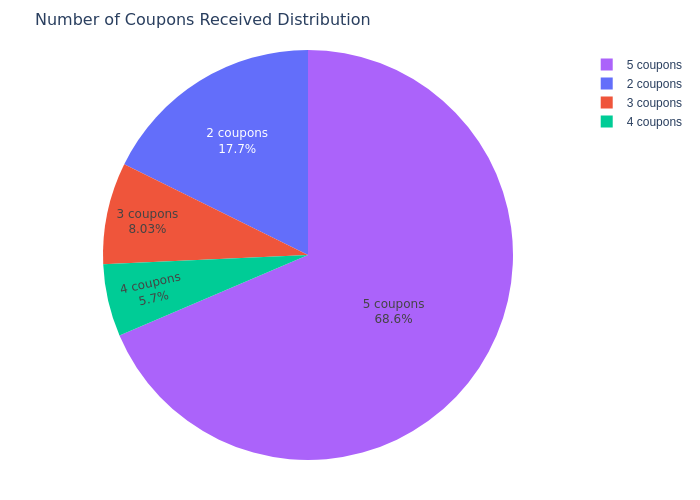
| Average coupons received | 4.25 out of 5 |
| Average total coupon income | 13.82 index points |
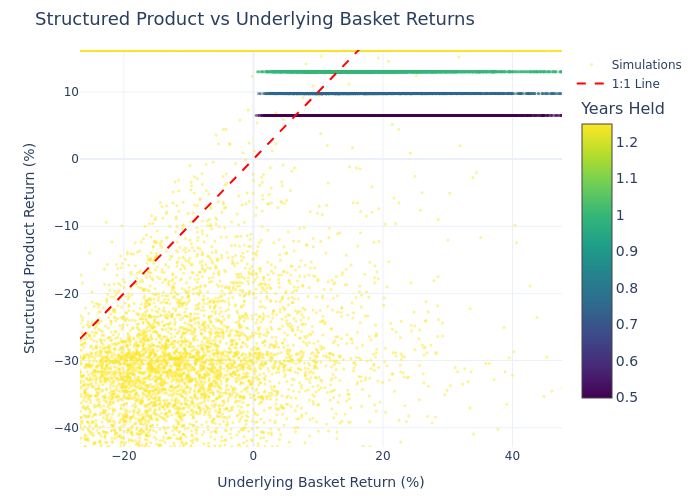
Scatter Plot: Structured Product vs Underlying Basket Returns
Each point represents one simulated outcome. The red dashed line is the 1:1 line. Points above the line indicate the structured product outperformed the underlying basket. Color indicates the holding period in years.
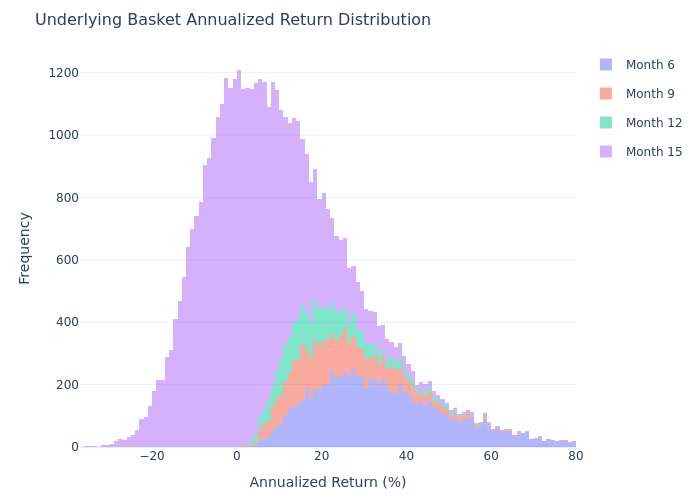
Annualized Return Distribution – Underlying Basket
Distribution of annualized returns for the equal-weight underlying basket (including dividends). Stacked bars show holding period breakdown.
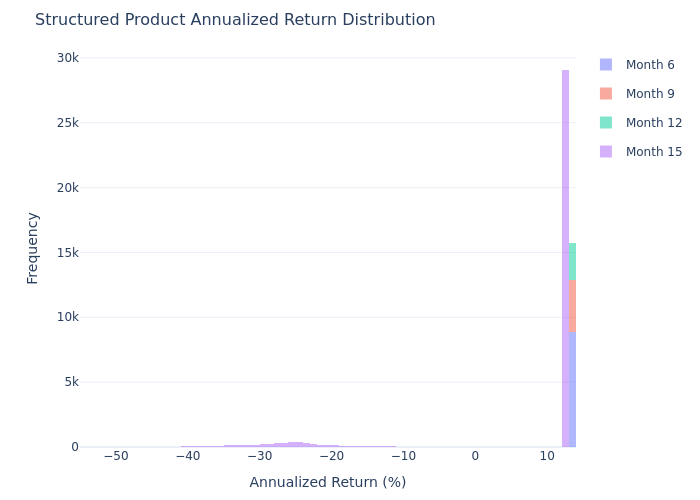
Annualized Return Distribution – Structured Product
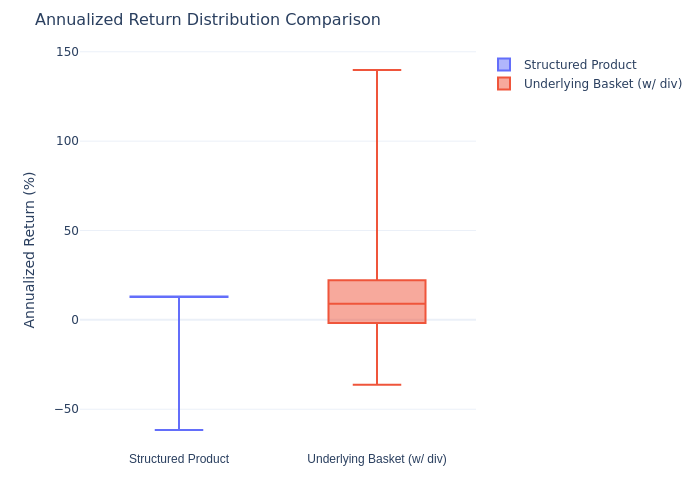
Distribution of annualized returns for the structured product. Note the concentration around positive returns (coupon income) with a left tail from barrier breach scenarios.
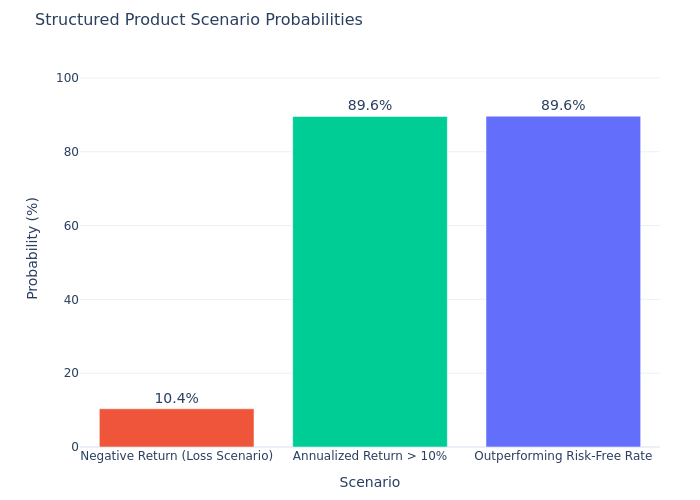
Scenario Probability Bar Chart
Probability of various outcome scenarios for the structured product.
Risk/Return Comparison
Comparison of expected annualized return vs annualized volatility for the structured product, the underlying basket (with dividends), and the risk-free rate.
Box Plot Comparison
Box plot comparing the distribution of annualized returns for the structured product vs the underlying basket (with dividends).
Holding Period Distribution
Distribution of how long the product is held before early redemption or maturity.
Coupon Distribution
Distribution of the number of coupon payments received per simulation.
Pros
- High coupon income: 13.00% p.a. fixed coupon provides attractive regular income
- Downside buffer: Barrier at 55% provides significant protection against moderate market declines (~89% of simulations avoid barrier breach)
- Lower volatility: The structured product exhibits lower annualized volatility (12.07%) compared to the underlying basket (18.70%)
- Lower probability of loss: Only 10.36% probability of negative total return, versus 33.32% for the underlying basket
Cons
- Capped upside: Maximum return is limited to the coupon income (16.25% total), even if underlying stocks rally significantly
- Tail risk: In barrier breach scenarios, capital losses can be severe (99% VaR of −36.11%), worse than the underlying basket's VaR of −20.26%
- Issuer call risk: The issuer can call the product early (31.42% probability), reducing the total coupon income
- Worst-of structure: The barrier and final payoff both depend on the worst-performing underlying, increasing risk
- Credit risk: The product is unsecured debt of Leonteq Securities AG (BBB− rating)