Headline Simulation Results
Basic Product Information
How it works (layman's explanation)
This is a 3-year, USD-denominated structured note issued by Morgan Stanley Finance LLC and guaranteed by Morgan Stanley. It tracks the worst performing of three global equity indices: the Dow Jones Industrial Average (US), the EURO STOXX 50 (Eurozone) and the Russell 2000 (US small caps).
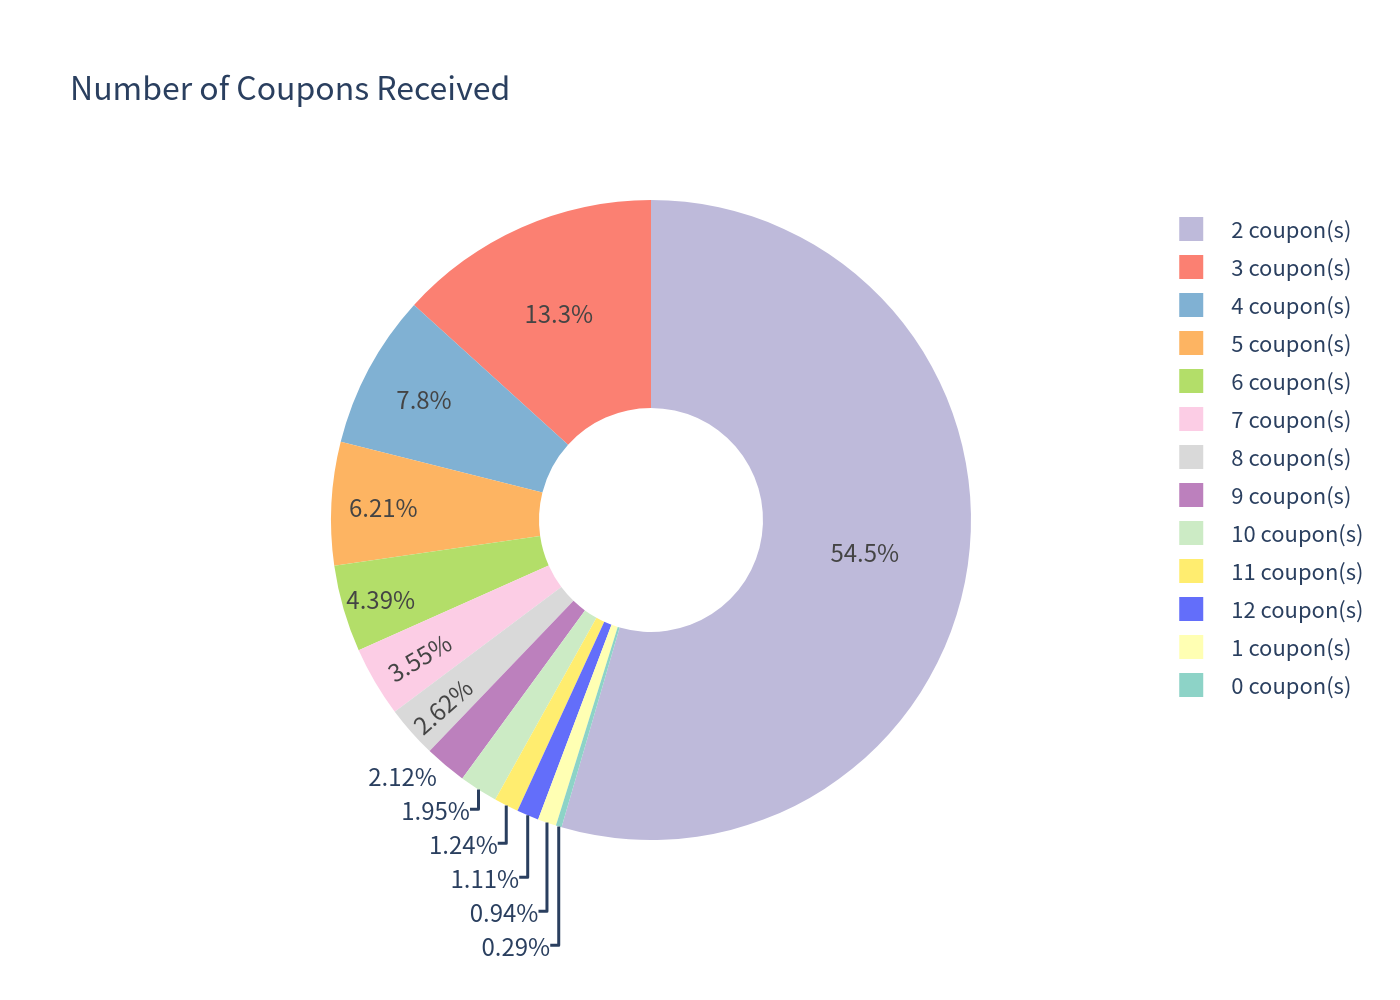
- Contingent income: the note pays a quarterly coupon of 2.875 points (11.50% annual, midpoint of the 11.00%–12.00% range) on each coupon date only if all three indices close at or above 80% of their starting level on that observation date. If any index is below 80%, that quarter's coupon is skipped (no make-up).
- Early redemption (autocall): from month 6 onward, if all three indices close at or above 100% of their starting level on a quarterly observation date, the note is automatically redeemed at par plus that quarter's coupon. After redemption, no further payments are made.
- Principal at maturity: if not auto-called, the investor receives par if all three indices finish at or above 70% of their starting level. If any index finishes below 70%, the investor loses 1% of principal for every 1% decline of the worst-performing index — principal can fall substantially and even reach zero.
- No upside participation: the investor does not share in any index appreciation; the return is capped at the coupon stream.
Key terms: $1,000 principal per security | CUSIP 61781DEX2 | Coupon barrier 80% | Autocall threshold 100% | Downside threshold 70% | Coupon 11.00%–12.00% p.a. (assumed 11.50%) | Quarterly observation.
Key Statistics — Structured Product vs Underlying Basket
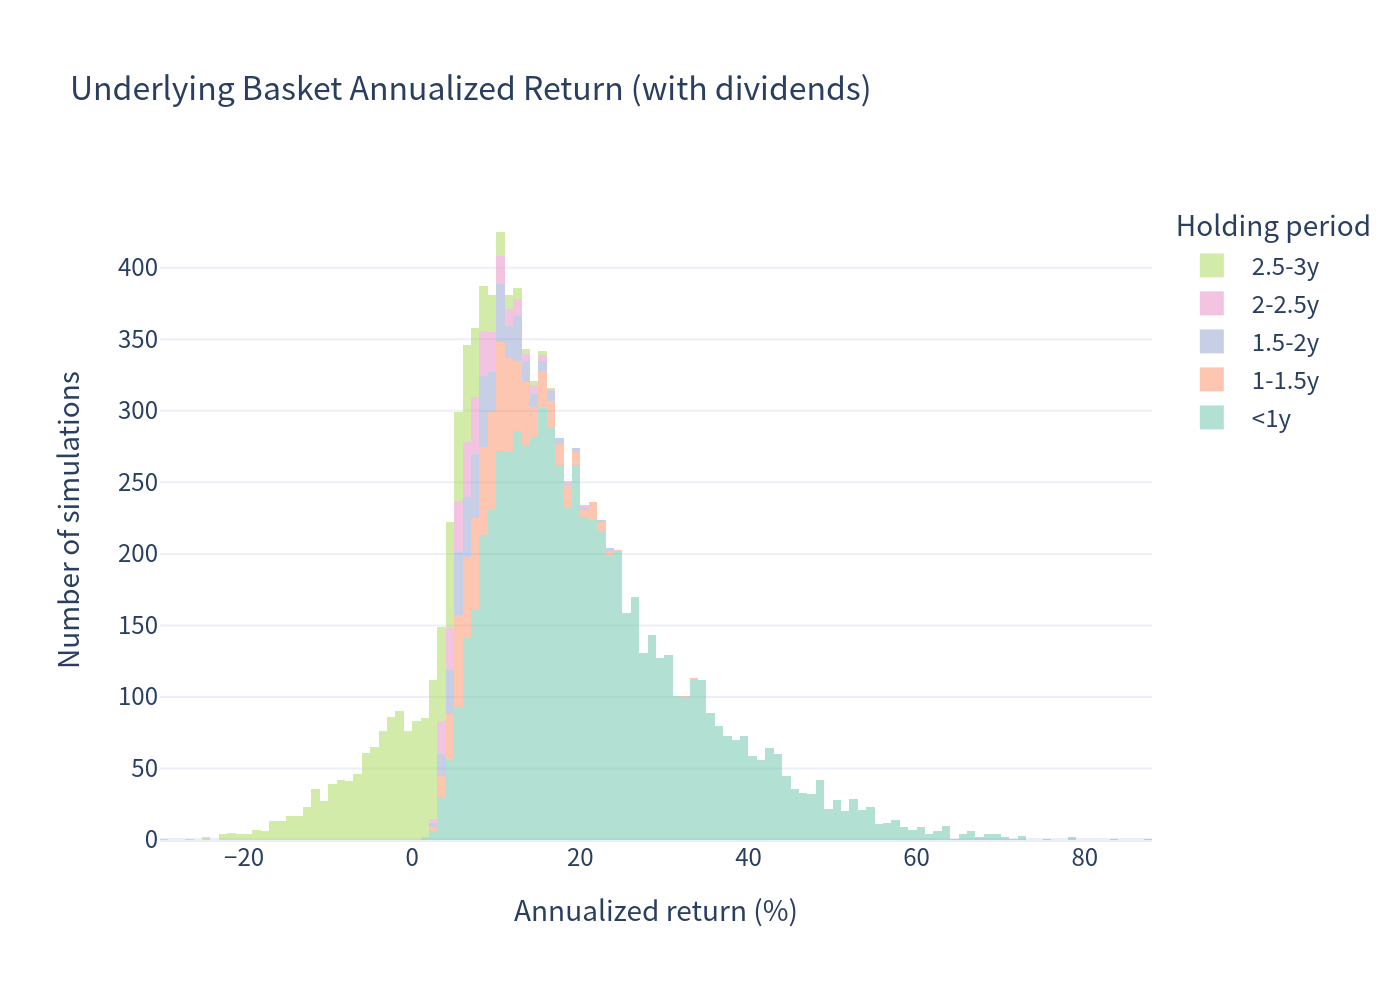
Underlying benchmark = equal-weight basket of the three price indices; benchmark returns include an average dividend yield of 1.61% p.a.
| Metric | Structured Product | Underlying Basket (Total Return) |
|---|---|---|
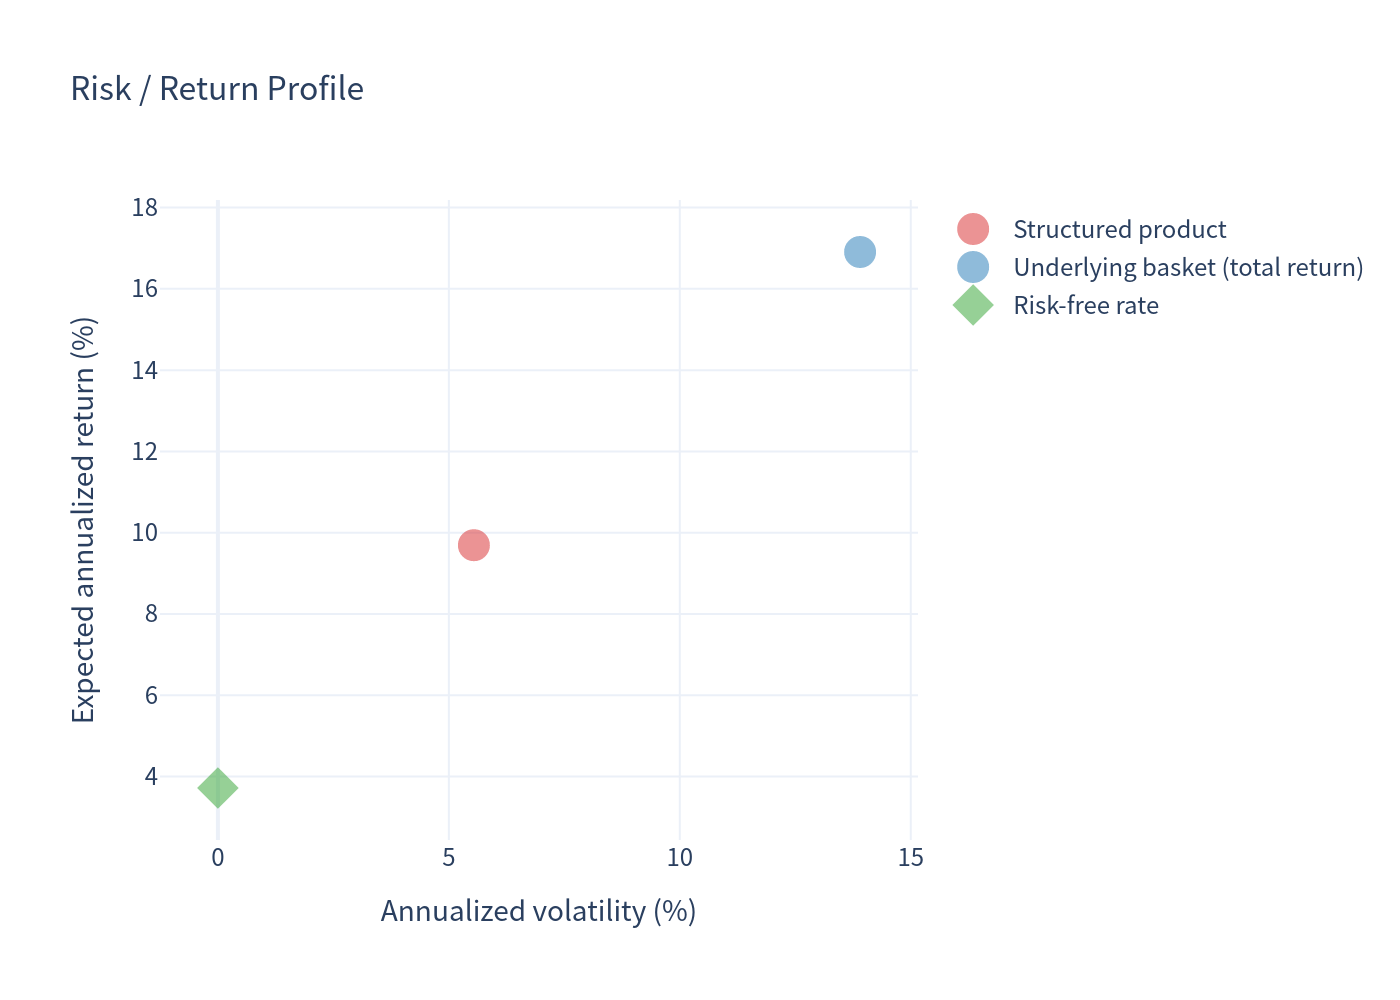
| Expected annualized return | 9.69% | 16.91% |
| Expected annualized volatility | 5.54% | 13.90% |
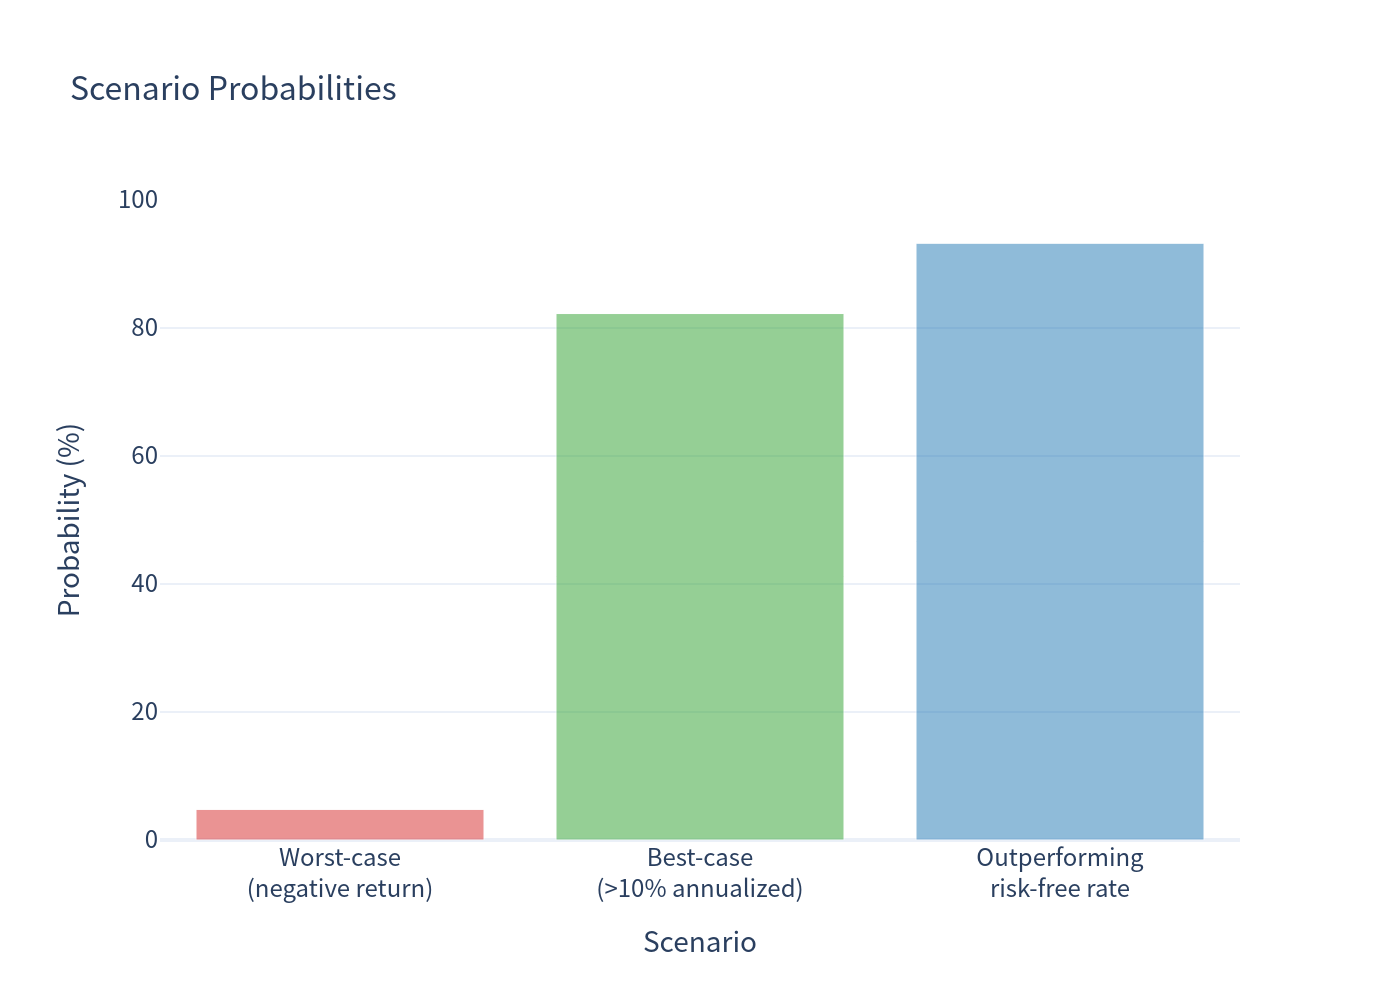
| Probability of loss | 4.78% | 8.02% |
| 99% confidence VaR (1-year) | -17.63% | -12.75% |
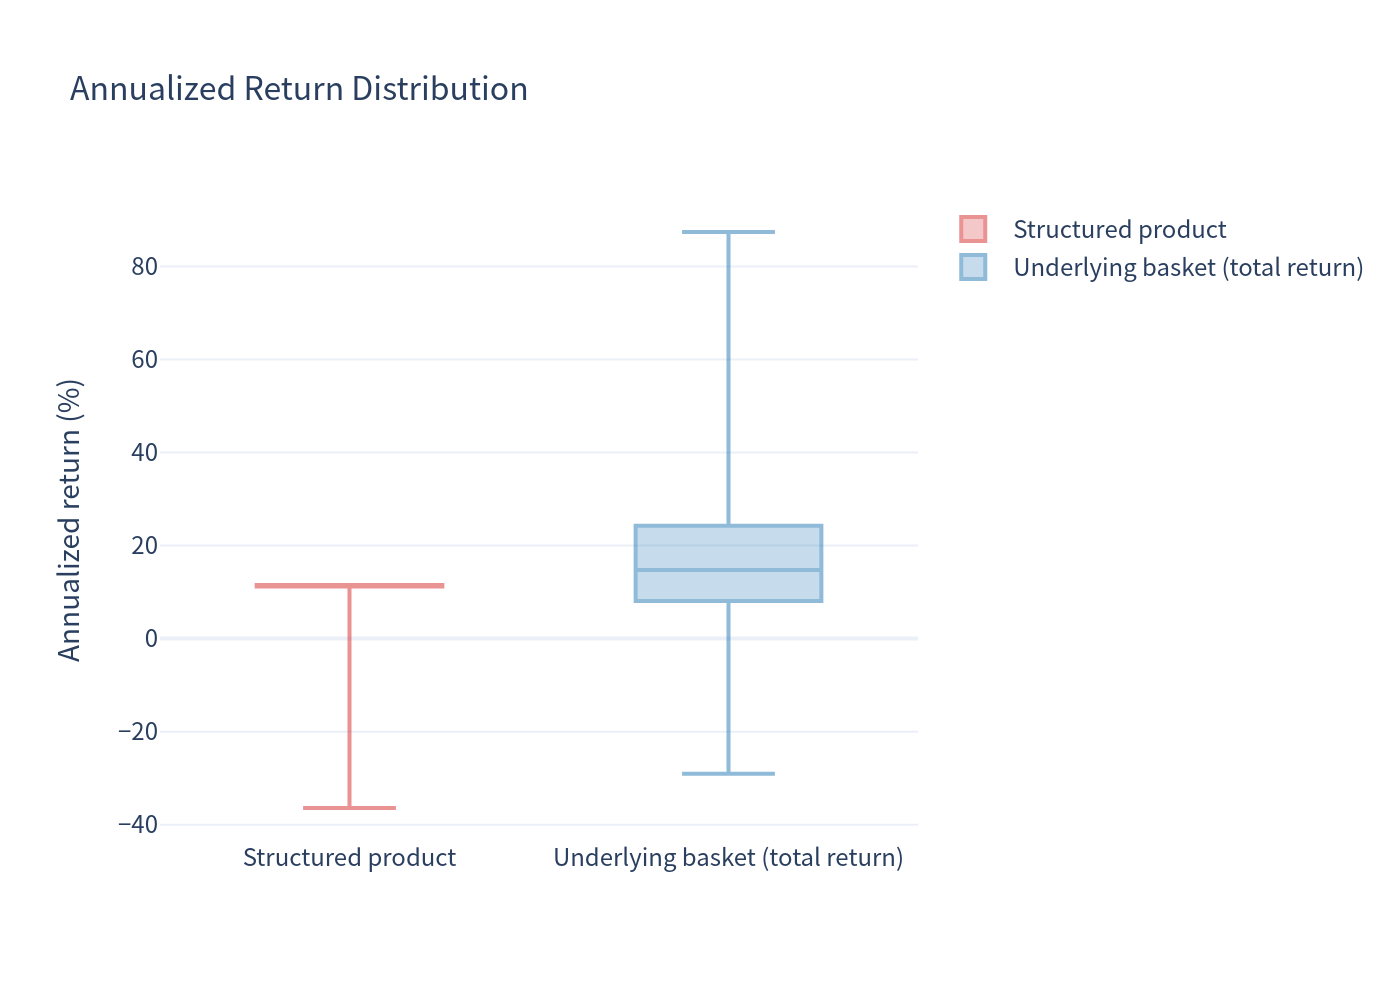
| 99% VaR (total return, full horizon) | -44.11% | -37.20% |
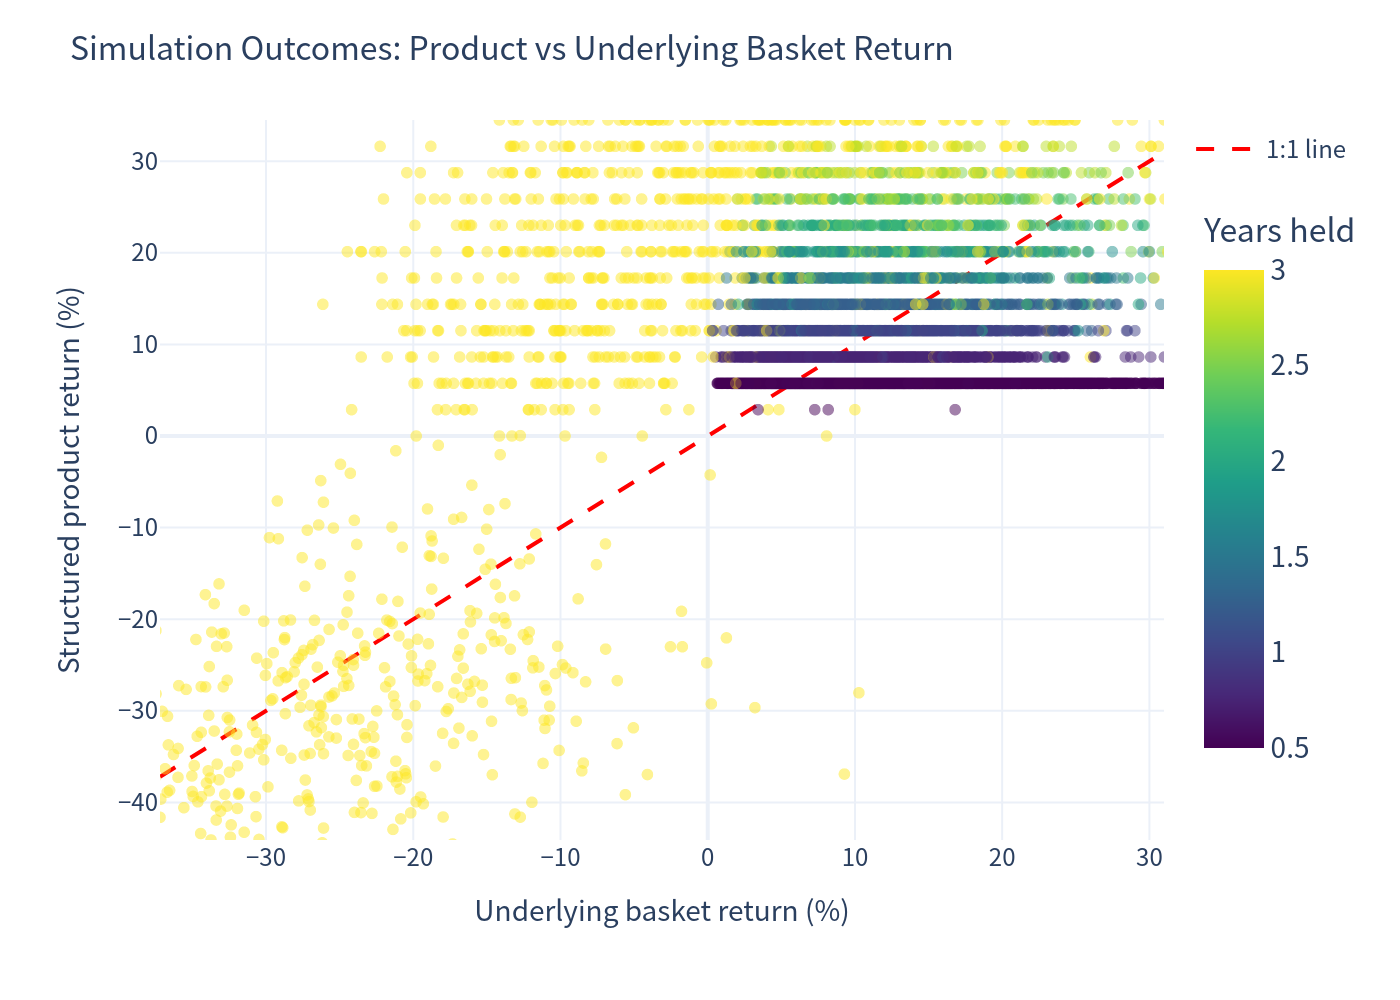
Interpretation: the structured product delivers a lower expected return than the fully-invested index basket but with roughly one-third of the volatility. Its probability of loss is lower (4.78% vs 8.02%) thanks to the coupon cushion and the 70% downside buffer. However, its tail risk (99% VaR) is deeper than the basket's because, in stress scenarios, the product can lose principal on a 1:1 basis with the worst index while earning no compensating coupons.
Note: the benchmark's expected annualized return is measured over the same (short, autocall-driven) holding periods as the product. Because the product only auto-calls when all indices are above their start levels, the benchmark return at those exit points benefits from positive selection; this makes the basket's annualized figure look higher than a simple 3-year buy-and-hold expectation.
Charts
Investment Commentary
What works well
- High income potential: the 11.50% annual contingent coupon is well above the 3.72% 1-year risk-free rate, and the note outperforms the risk-free rate in ~93% of simulated scenarios.
- Low probability of loss (~4.8%) thanks to the 80% coupon barrier, 70% downside buffer and the coupon cushion.
- Reduced volatility vs the underlying basket (5.54% vs 13.90% annualized).
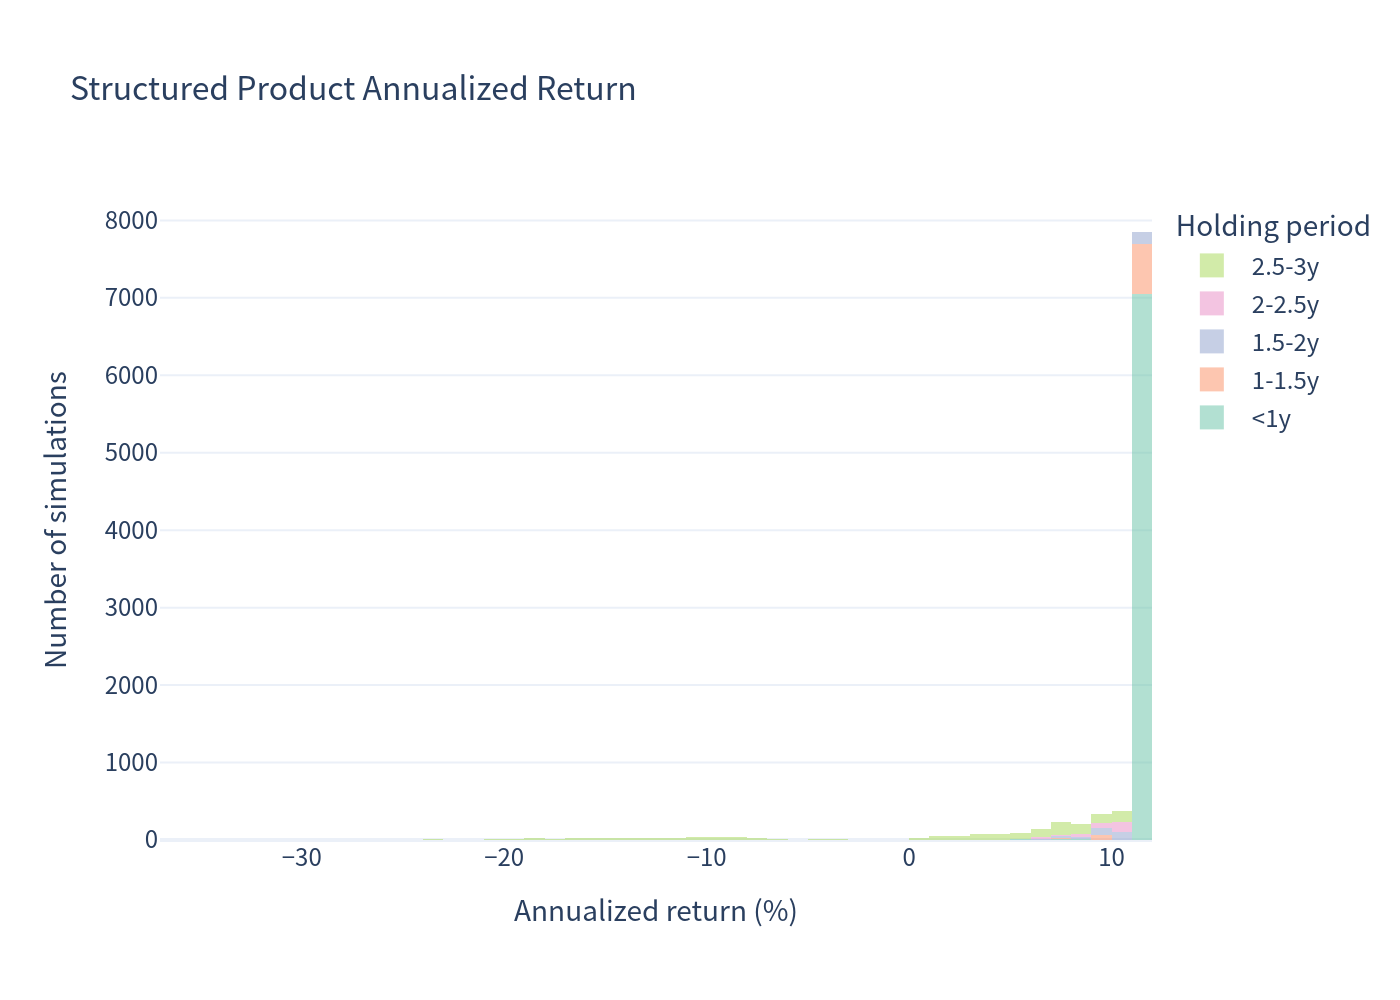
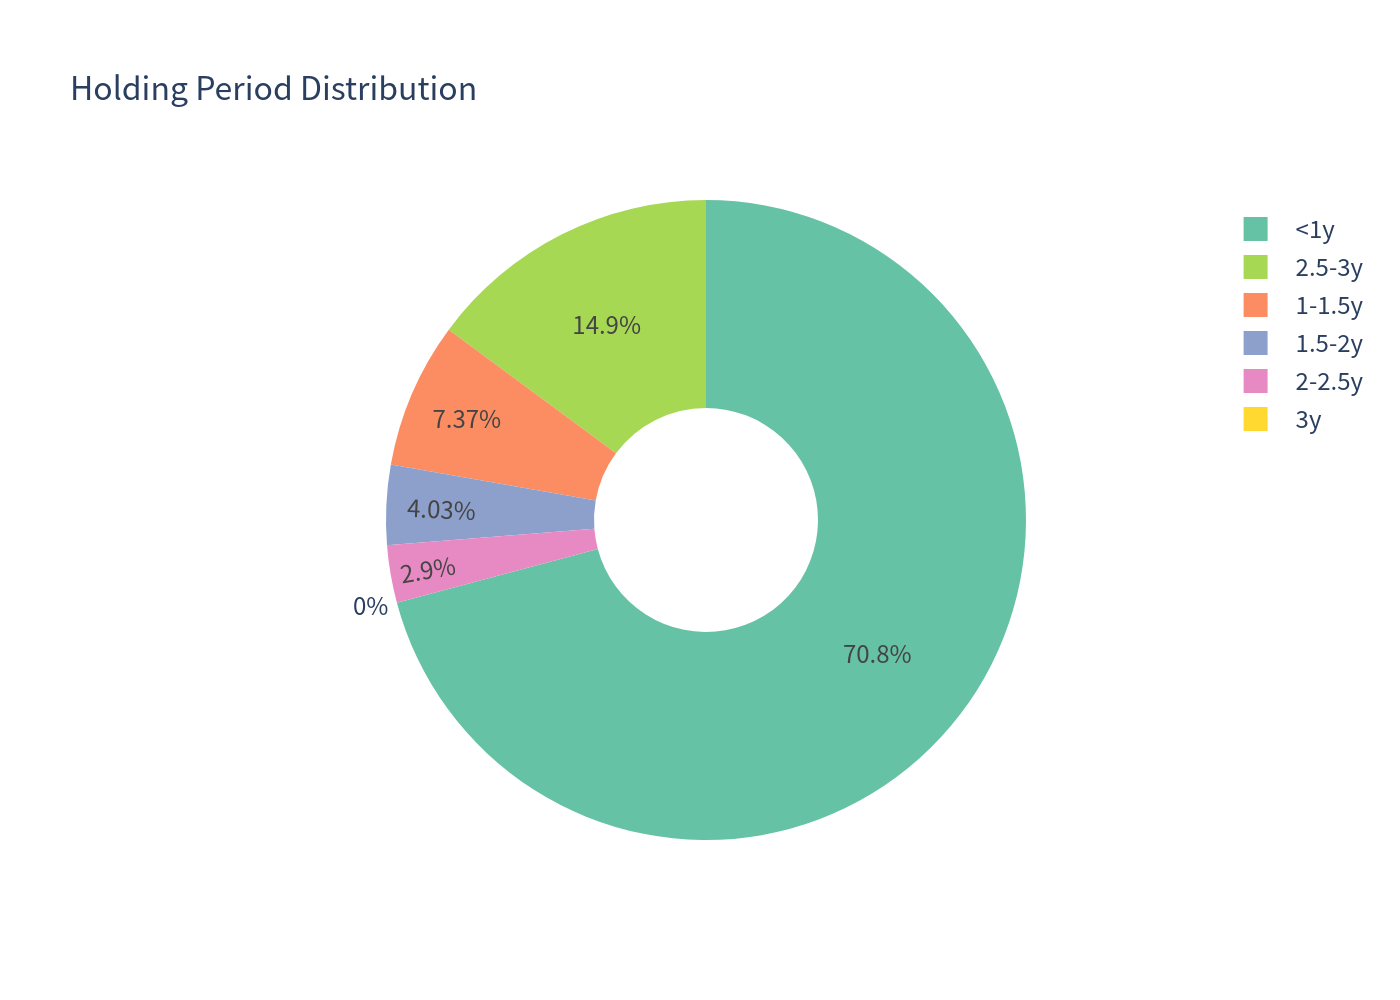
- High early-redemption rate (~86%), which shortens the average holding period to about 13 months.
What to keep in mind
- Returns are capped: no participation in index appreciation; maximum annualized return is around 11.50%.
- Coupons are contingent and can be skipped if any index is below 80% of its start level on an observation date.
- Tail risk: in stress scenarios the note can lose a significant portion (up to all) of principal on a 1:1 basis with the worst-performing index, with a 99% 1-year VaR of about -17.6%.
- Worst-of structure: because the payoff depends on the worst of three indices, a decline in any single index (e.g., US small caps) hurts the note even if the other two rise.
*This analysis is for information only and does not constitute investment advice or a suitability assessment.*