14.40% p.a. Multi Barrier Reverse Convertible
| Metric | Structured Product | Worst-of Underlying (with dividends) | XLE Energy ETF (with dividends) |
|---|---|---|---|
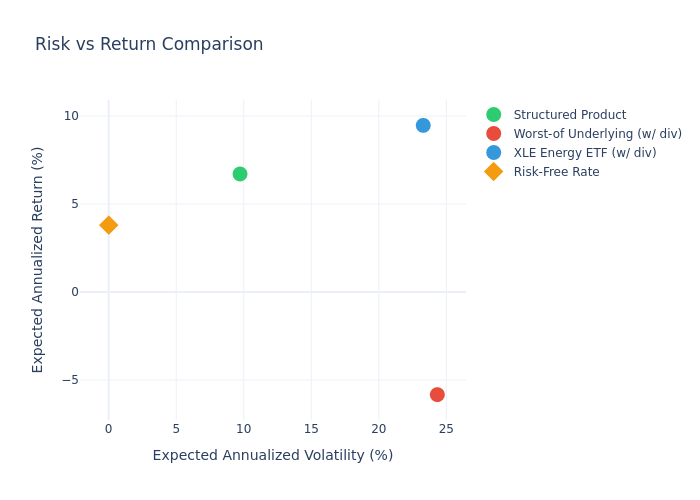
| Expected Annualized Return | 6.71% | -5.84% | 9.47% |
| Expected Annualized Volatility | 9.72% | 24.33% | 23.29% |
| Probability of Negative Return | 12.00% | 64.64% | 38.38% |
| 99% Confidence VaR (1 year) | -28.98% | -50.99% | -44.59% |
| Expected Holding Period | 7.49 months | — | — |
Basic Information
- Product Type: SSPA 1230 – Multi Barrier Reverse Convertible (Issuer Callable)
- Underlyings: Chevron (CVX), Exxon Mobil (XOM), Occidental Petroleum (OXY), SLB Limited (SLB)
- Coupon Rate: 14.40% p.a., paid quarterly (USD 36.00 per USD 1,000 denomination)
- Barrier Level: 55% of Initial Fixing Level (continuous observation)
- Strike Level: 100% of Initial Fixing Level
- Term: 18 months (May 2026 – November 2027)
- Currency: USD
- Denomination: USD 1,000
How It Works
This structured product offers a high quarterly coupon of 14.40% per annum, paid regardless of the underlying stocks' performance. The product has two key risk features:
- Issuer Call: The issuer has the right to call (redeem early) the product on quarterly observation dates. In our simulation, the issuer calls when all underlying stocks remain above the 55% barrier level, as continuing to pay the high coupon would be suboptimal.
- Conditional Downside Protection: If none of the 4 energy stocks ever falls below 55% of its initial level during the entire observation period, investors receive their full principal back at maturity. However, if any stock breaches this barrier, the downside protection is removed, and at maturity:
- If the worst-performing stock is below its initial level (strike = 100%), investors receive physical shares of that worst performer, incurring a loss equal to the decline.
- If the worst performer is at or above its initial level, investors still receive full principal.
Key Statistics
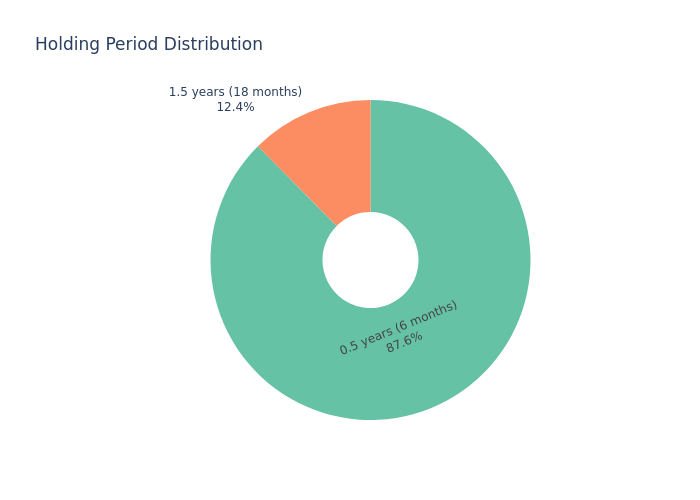
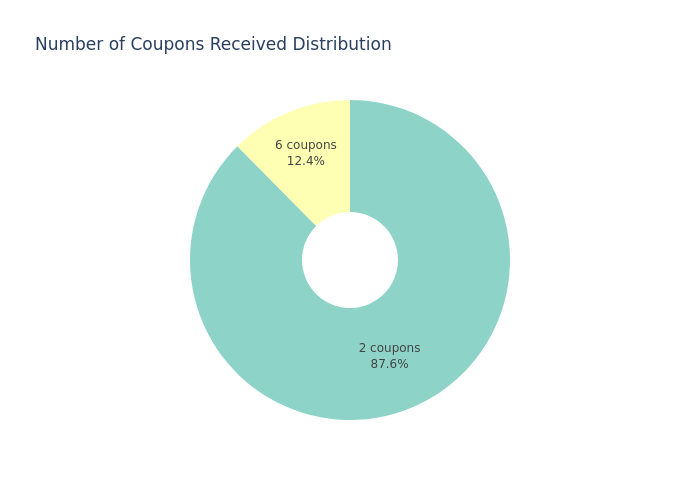
In 87.58% of simulated scenarios, the issuer calls the product at the first observation date (6 months), resulting in:
- 2 coupon payments received (7.2 index points total)
- Total return: +7.20%
- Annualized return: +10.18%
In 12.42% of scenarios (when a barrier event occurs), the product runs to full maturity (18 months):
- 6 coupon payments received (21.6 index points total)
- Maturity payoff depends on the worst-performing stock's final level
- Average annualized return: -17.81% for these paths
- Some scenarios experience significant losses if the worst stock falls far below its initial level
Holding Period Analysis
Since 87.58% of products are called at 6 months, the expected holding period is only 7.49 months. The high annualized return of 6.71% is driven largely by these short-duration scenarios. Investors should note that annualized figures can appear elevated for short holding periods.
Total Return vs Annualized Return
- Expected total return over realized holding period: +3.18% (mean of per-simulation total returns)
- Expected annualized return: +6.71% (mean of per-simulation CAGR)
- The total return of +3.18% over ~7.5 months is the more relevant figure for actual investor experience
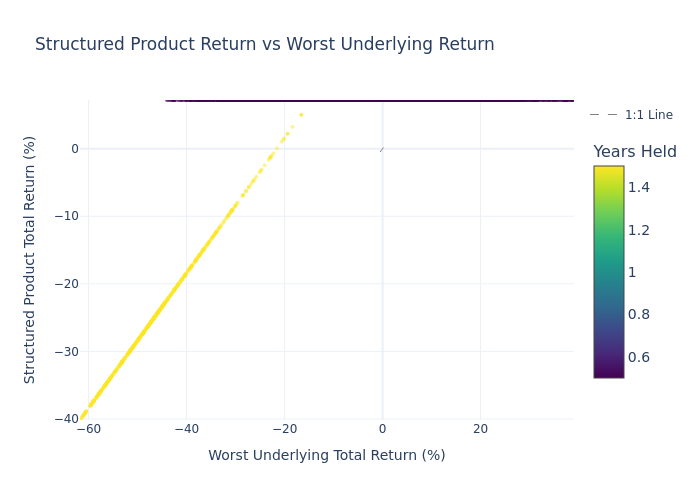
Scatter Plot: Product Return vs Worst Underlying Return
Each point represents one simulated scenario. The product's asymmetric payoff structure is clearly visible — capped upside but downside participation below the barrier.
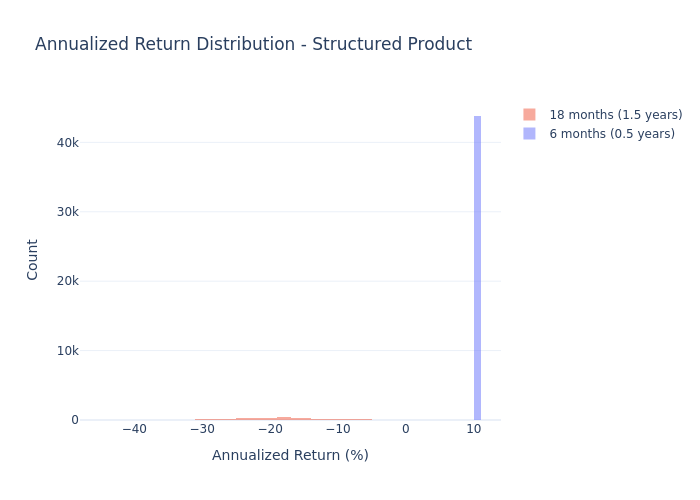
Annualized Return Histogram – Structured Product
The distribution of simulated annualized returns for the structured product. Note the concentration around +10% (called scenarios) and the left tail representing barrier-event scenarios.
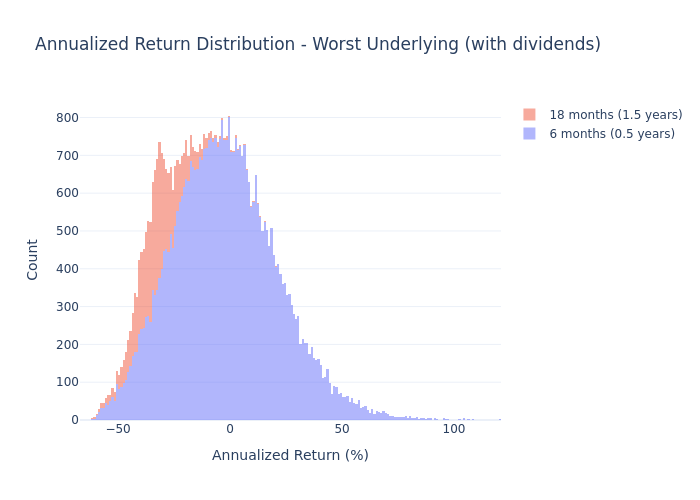
Annualized Return Histogram – Worst Underlying (with dividends)
The distribution of simulated annualized returns for the worst-performing underlying stock, shown for comparison.
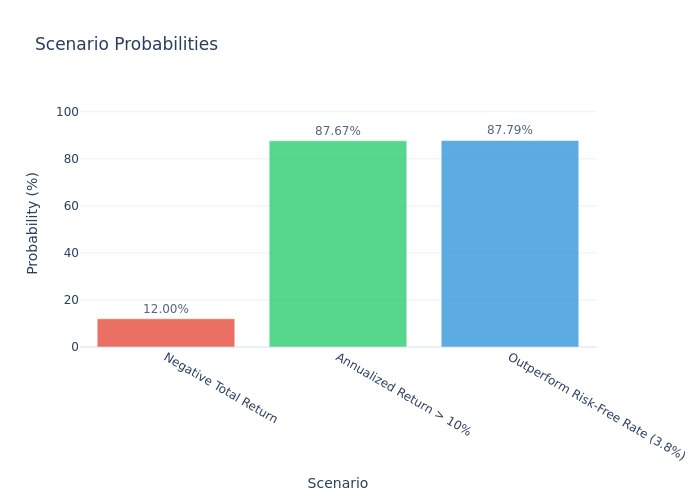
Scenario Probability Bar Chart
Breakdown of simulation outcomes by scenario type — called at 6 months, full maturity with barrier breached, etc.
Risk vs Return Comparison
Comparing the structured product, the worst-of underlying, and the XLE Energy ETF on a risk-return basis.
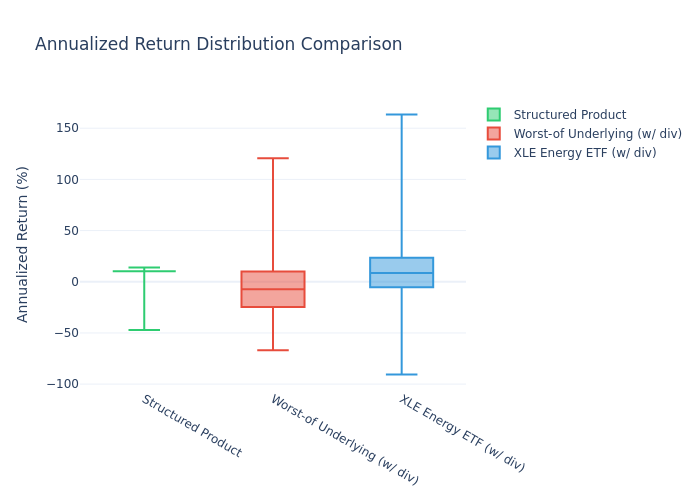
Box Plot Comparison
Distribution comparison across the structured product, worst-of underlying, and XLE Energy ETF.
Holding Period Distribution
Pie chart showing the proportion of scenarios by holding period length.
Coupon Distribution
Pie chart showing the number of coupon payments received across simulated scenarios.
Pros
- High coupon rate: 14.40% p.a. quarterly coupon is very attractive compared to current risk-free rates (~3.8%)
- Strong downside protection: 55% barrier provides a significant cushion before capital is at risk
- Favorable risk-adjusted returns: The product offers a higher expected return (6.71%) than the risk-free rate, with much lower volatility (9.72%) than the underlying stocks (24.33%)
- Low probability of loss: Only 12.00% of scenarios result in a negative total return
- Short expected holding period: 87.58% of scenarios are called at 6 months, providing rapid return of capital
Cons
- Issuer call risk: The product is likely to be called early (6 months), limiting the total absolute return
- Barrier risk: If any of the 4 energy stocks falls below 55% of its initial level, the capital protection is lost
- Worst-of structure: The payoff depends on the weakest-performing stock, creating concentration risk in the worst name
- Credit risk: Investor is exposed to the creditworthiness of the issuer (Leonteq Securities AG, rated BBB-)
Important Notes
- This analysis is based on Monte Carlo simulations using GJR-GARCH(1,1) models calibrated to 20 years of historical data
- The issuer call strategy is modeled assuming the issuer calls when no barrier event has occurred
- Results are shown before fees and taxes
- Past performance and historical volatility are not guarantees of future results