
9.00% p.a. Multi Barrier Reverse Convertible on Alcon, Roche & Swiss Re
CHF-denominated, worst-of three Swiss large caps, continuous 59% barrier, issuer-callable, final fixing 19/06/2028 (ISIN CH1555867683)
Key Metrics at a Glance
Headline Simulation Results
Based on 10,000 Monte-Carlo simulations of the three underlyings:
| Metric | Structured Product | Underlying basket (total return) |
|---|---|---|
| Expected annualized return | 5.45% | 13.14% |
| Probability of a negative return | 13.64% | 20.48% |
| 99% confidence VaR (1 year) | -25.79% | -15.48% |
| Expected annualized volatility | 8.84% | 15.83% |
| Expected holding period | 15.7 months | – |
| Expected total return over the realized holding period | 6.02% (median 9.00%) | 10.38% |
The note is expected to return about 5.45% per year with roughly half the volatility of holding the underlying basket directly, but it carries a thicker downside tail: in the worst 1% of scenarios the investor loses about 25.8% on an annualized basis (versus ~15.5% for the basket). A negative outcome occurs in about 1 in 7 paths (13.64%), and there is an 86.4% chance of beating the CHF cash rate.
Because the product is often redeemed early, and many paths finish within 6–9 months, the annualized figure is flattered by very short holding periods; it is best read together with the expected total return of 6.02% over an average holding period of ~15.7 months.
What This Product Is (in plain terms)
This is a yield-enhancement note (a "reverse convertible" on three stocks). The investor lends CHF 1,000 and is promised a fixed 9.00% per year coupon (CHF 22.50 each quarter) no matter what the shares do. In exchange, the investor sells protection on the worst-performing of three Swiss shares – Alcon, Roche (participation certificate) and Swiss Re.
- If none of the three shares ever trades at or below 59% of its starting level during the ~21-month life, the investor simply gets the CHF 1,000 back plus all coupons.
- If the 59% barrier is breached (continuously monitored) and, at maturity, the worst share is below its starting level, the capital protection is lost: the investor is exposed to the worst performer (delivered as shares or a cash equivalent), i.e. suffers that share's decline.
- If the barrier is breached but the worst share has recovered above its start level at maturity, the investor still receives par.
Upside is capped: the most the note can ever pay is par plus the coupons – there is no participation in equity gains. The issuer may also call the note early on any of five quarterly dates at par plus the accrued coupon, which truncates how many coupons the investor can collect.
Key Statistics
| Strategy | Expected annualized return | Expected annualized volatility | Probability of loss | 99% VaR (1 year) |
|---|---|---|---|---|
| Structured Product | 5.45% | 8.84% | 13.64% | -25.79% |
| Underlying equal-weight basket (total return) | 13.14% | 15.83% | 20.48% | -15.48% |
| Underlying equal-weight basket (price only) | 10.52% | 15.83% | 27.23% | -18.10% |
| CHF risk-free rate (1-year average) | -0.05% | 0.00% | – | -0.05% |
Basket return uses the equal-weighted price return of the three underlyings plus an average dividend yield of ~2.62%.
Simulation Outcomes
Outcome Scatter vs. Underlying Basket
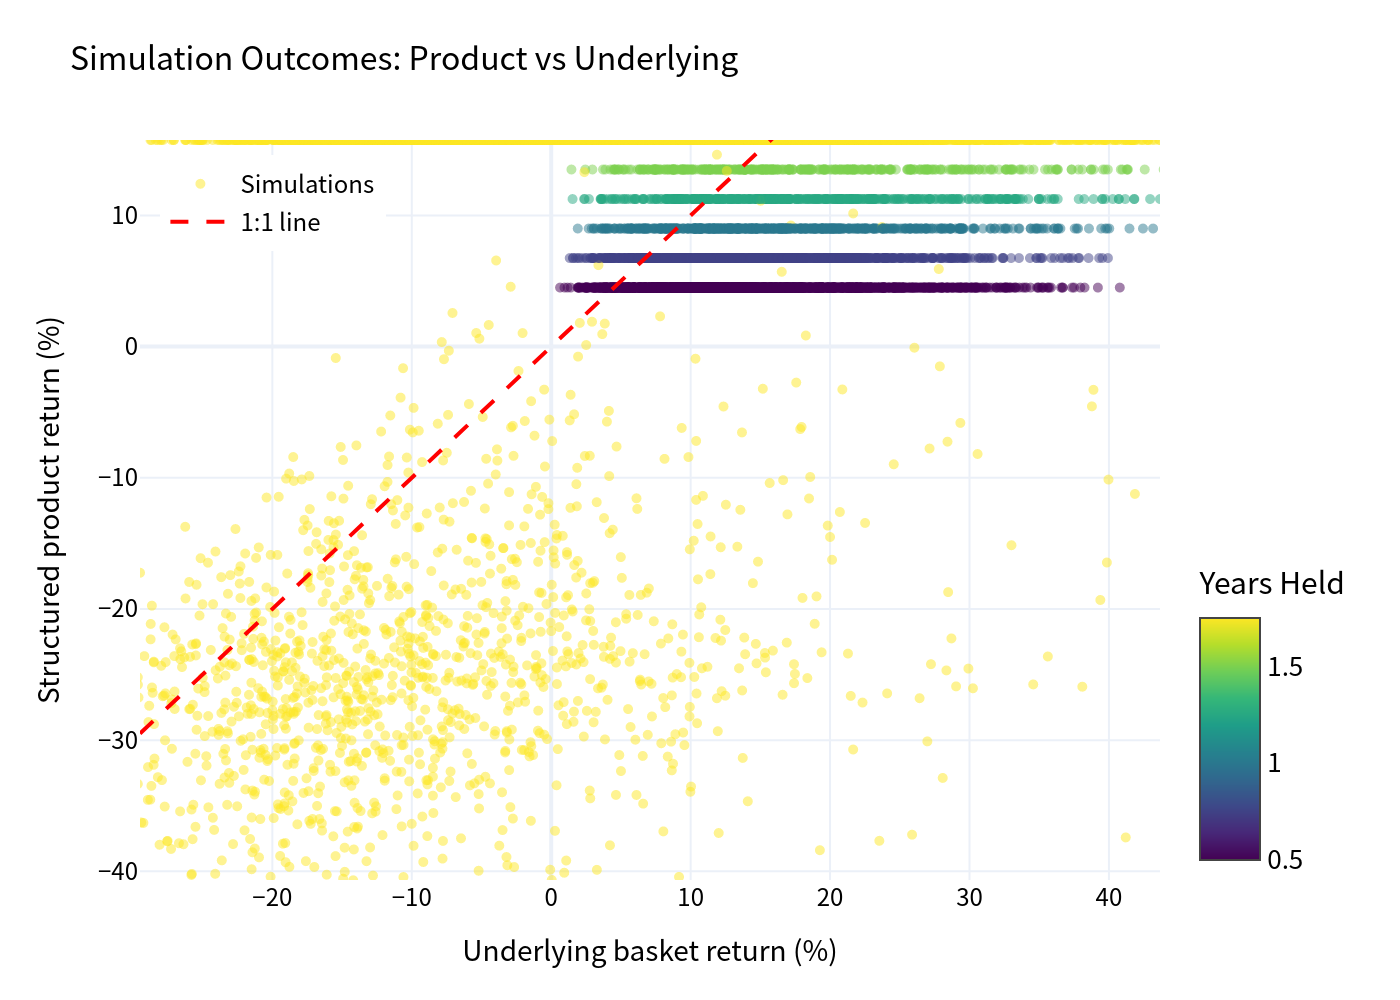
The scatter of 10,000 outcomes against the underlying basket (with a 1:1 reference line) shows the note's signature profile: capped upside (returns top out around +15.75% over the life) combined with meaningful downside when the barrier is breached.
Return Distributions
Underlying Basket – Annualized Returns
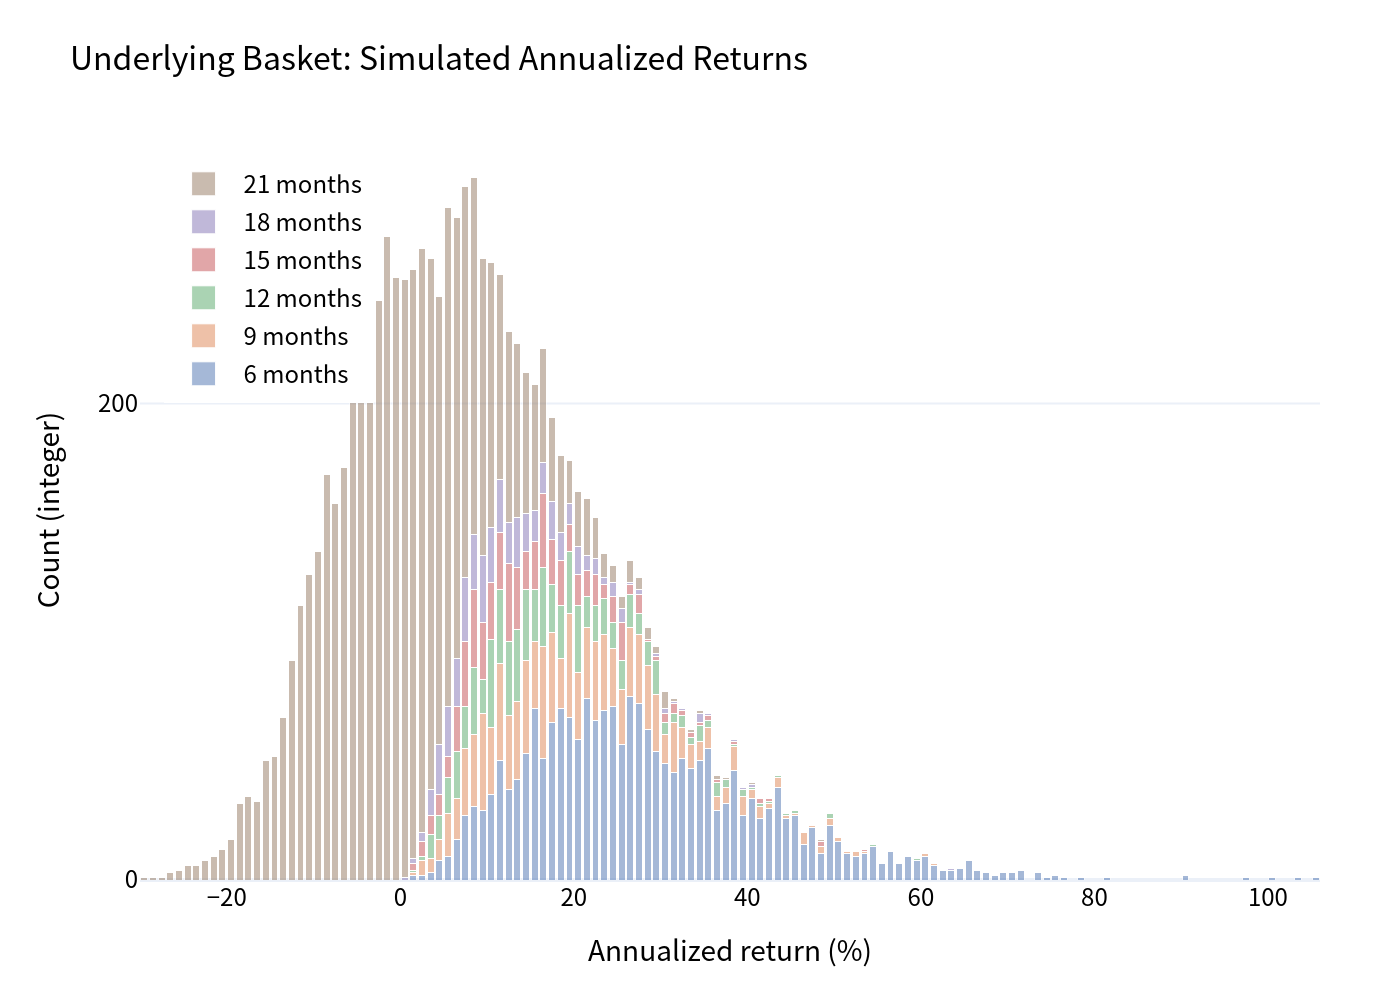
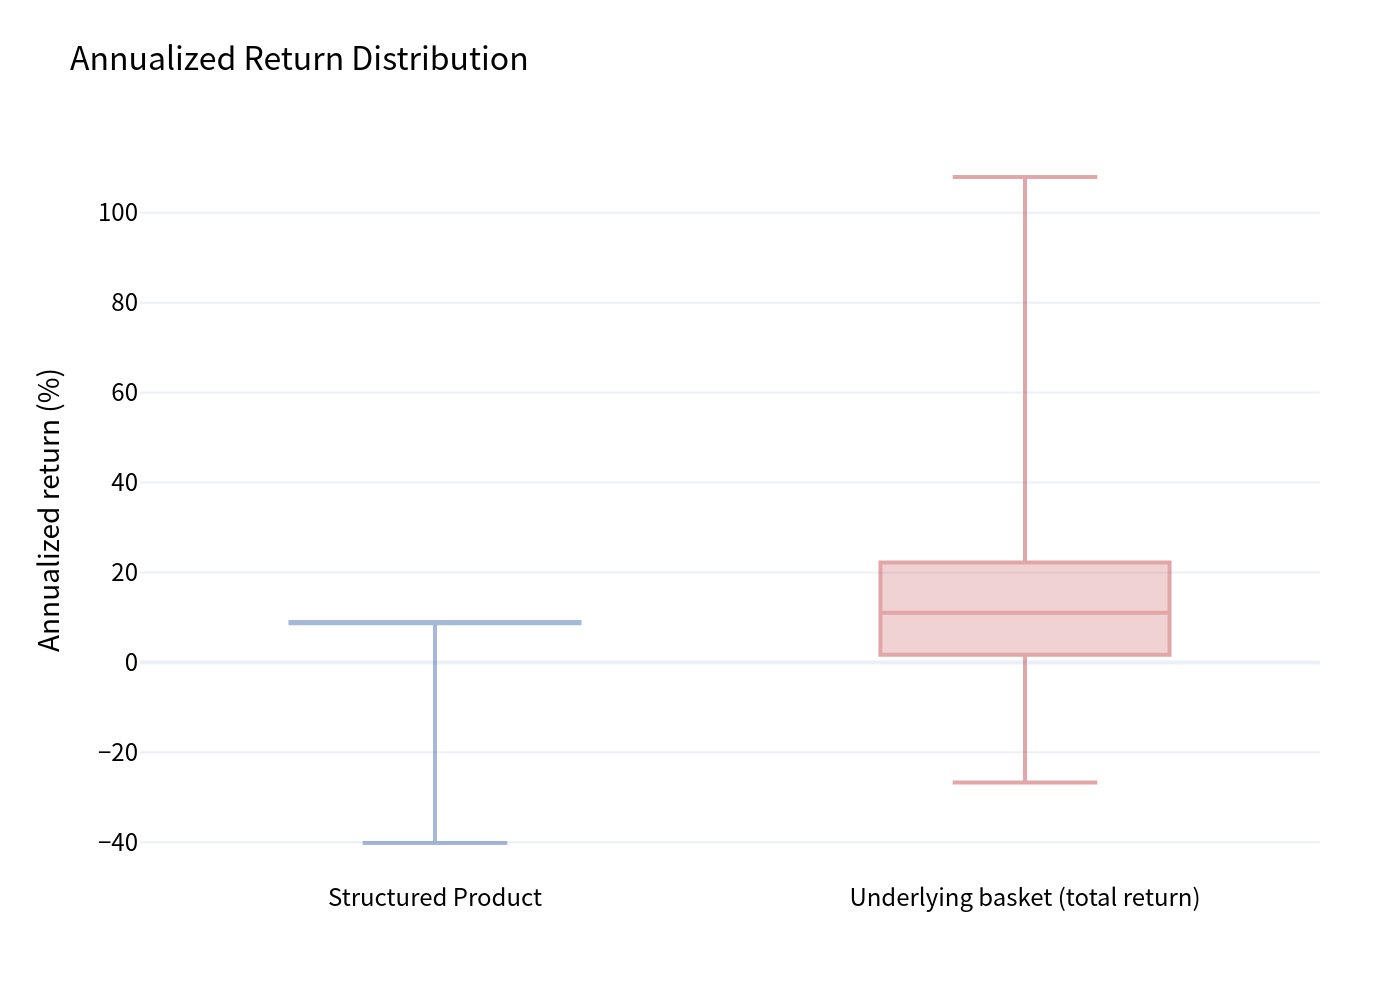
The underlying basket's annualized returns are wide and roughly symmetric, spanning roughly -30% to +100% (short holding periods annualize to large magnitudes):
Structured Product – Annualized Returns
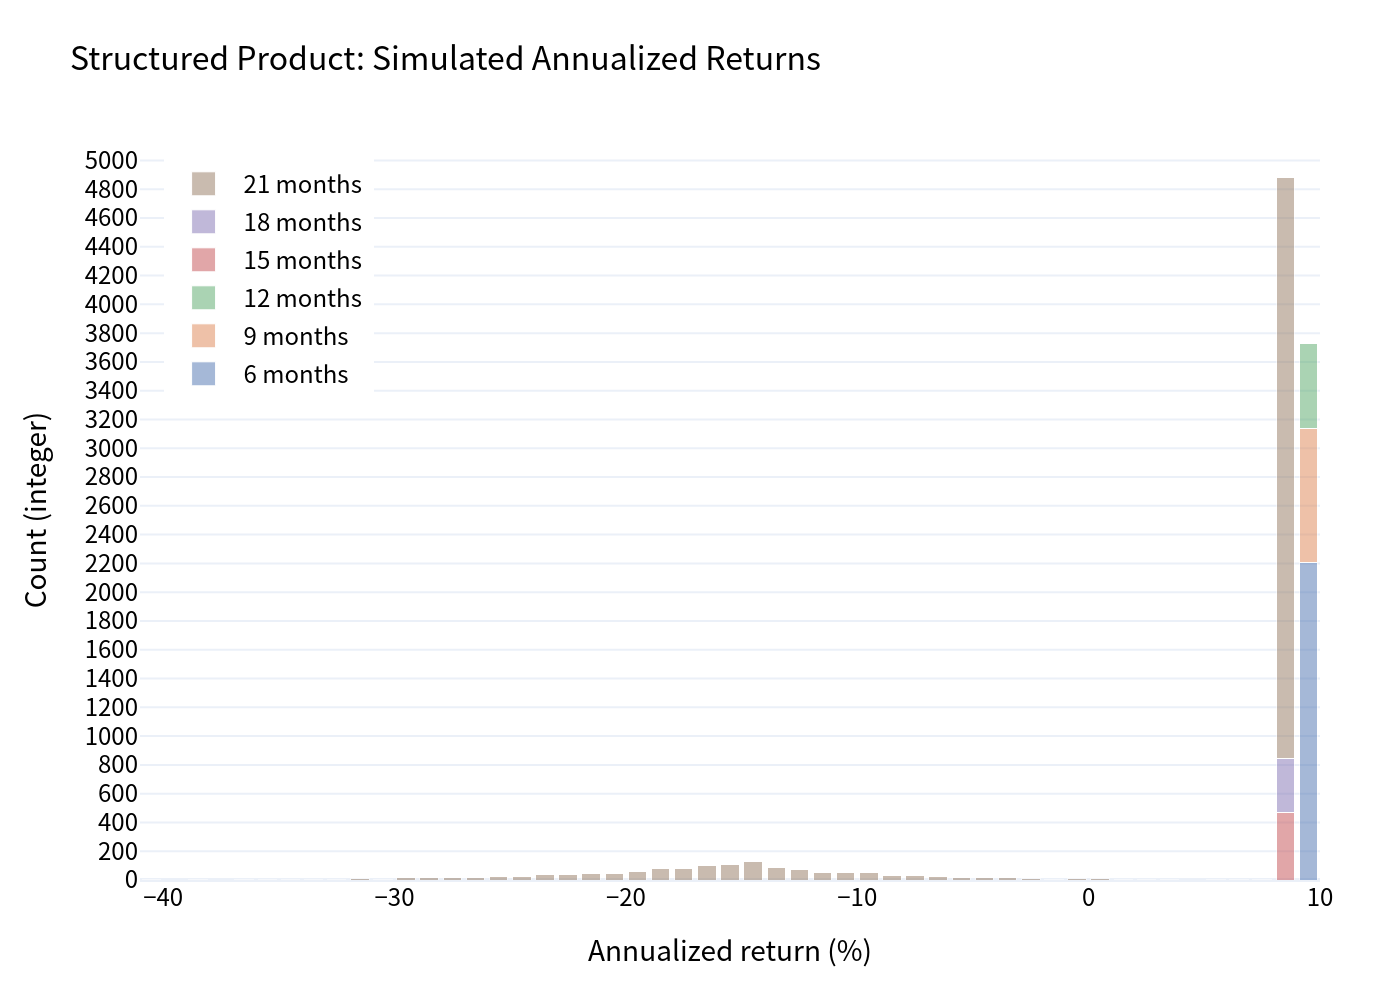
The structured product's annualized returns are tightly clustered near the coupon (roughly -40% to +10%), with a large spike of paths that ran to maturity and collected all seven coupons:
Scenario Probabilities
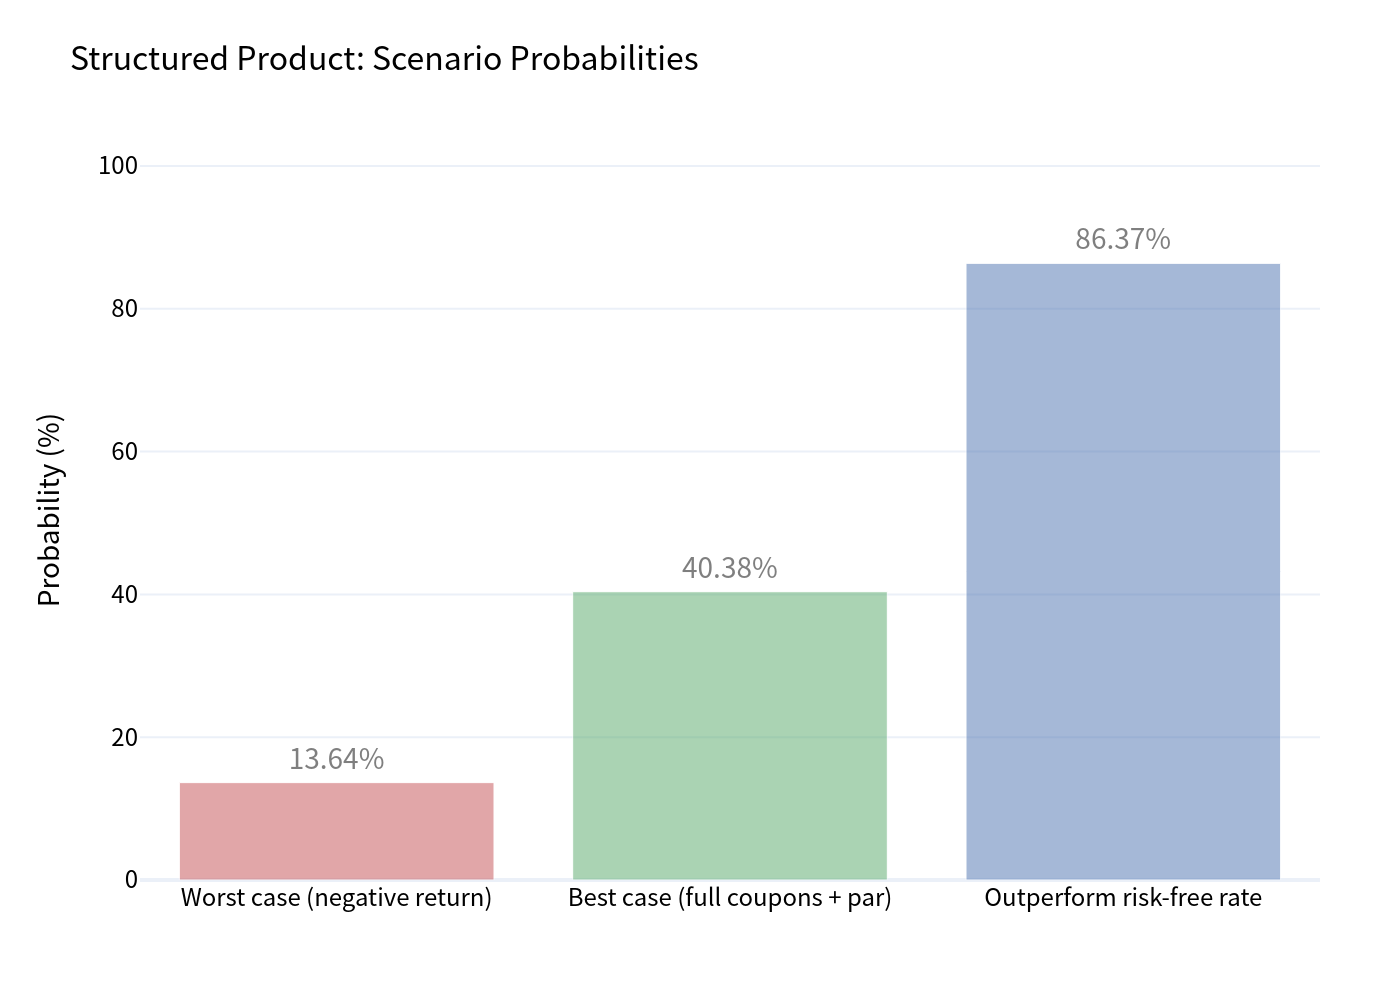
- Worst case (negative return) 13.64%
- Best case (all seven coupons + par) 40.38%
- Outperform the risk-free rate 86.37%
Risk vs Return
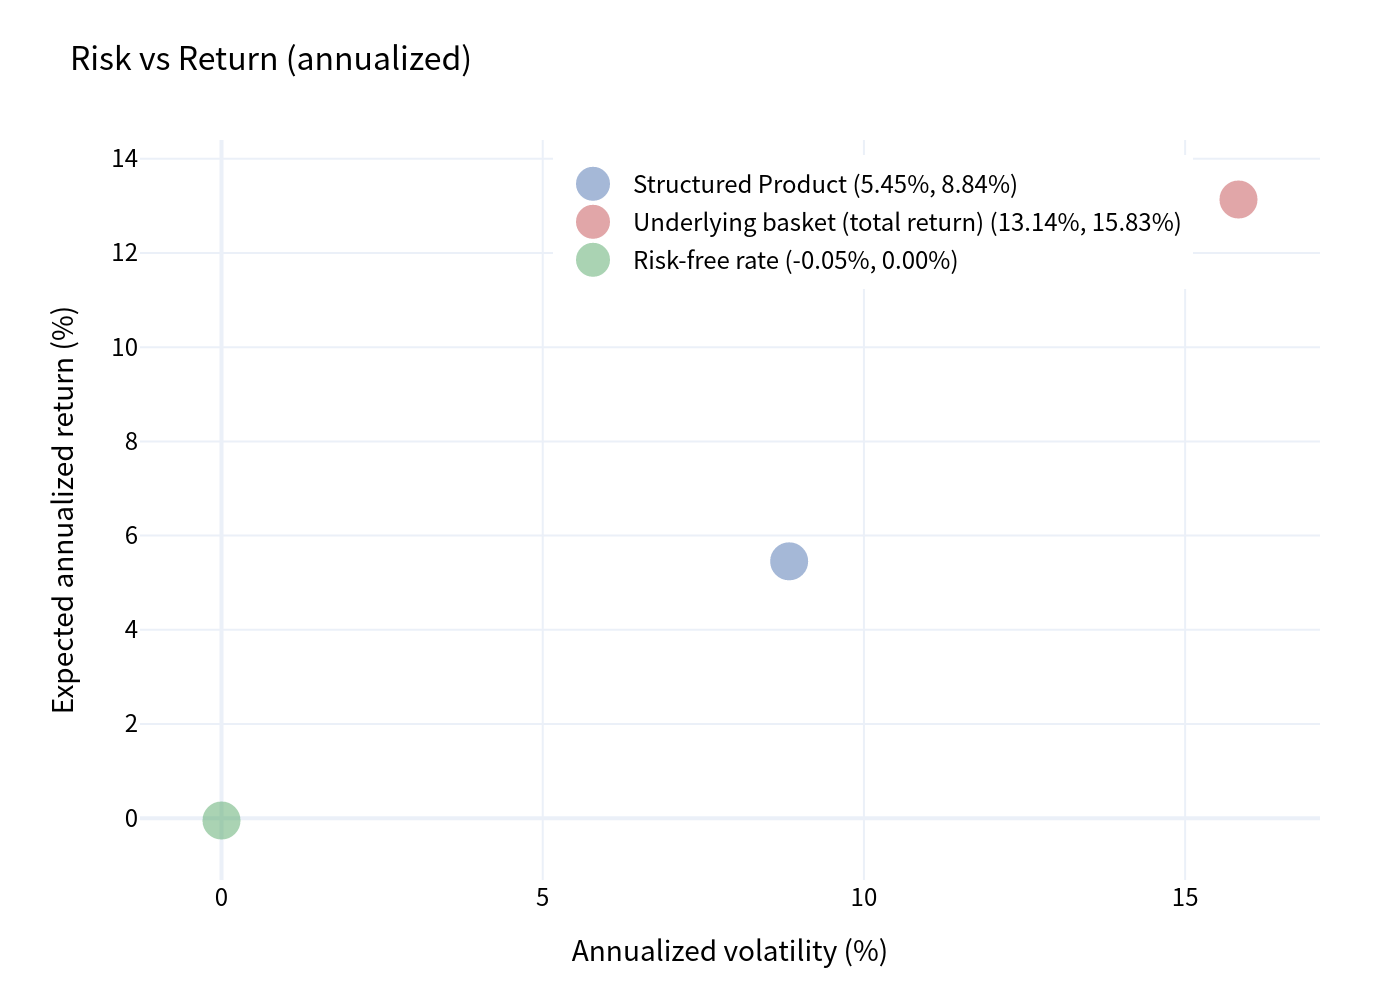
Relative to the underlying basket the note sits lower and to the left – less return, much less volatility, but a worse worst-case, consistent with a yield-enhancement payoff:
Holding Period and Coupons
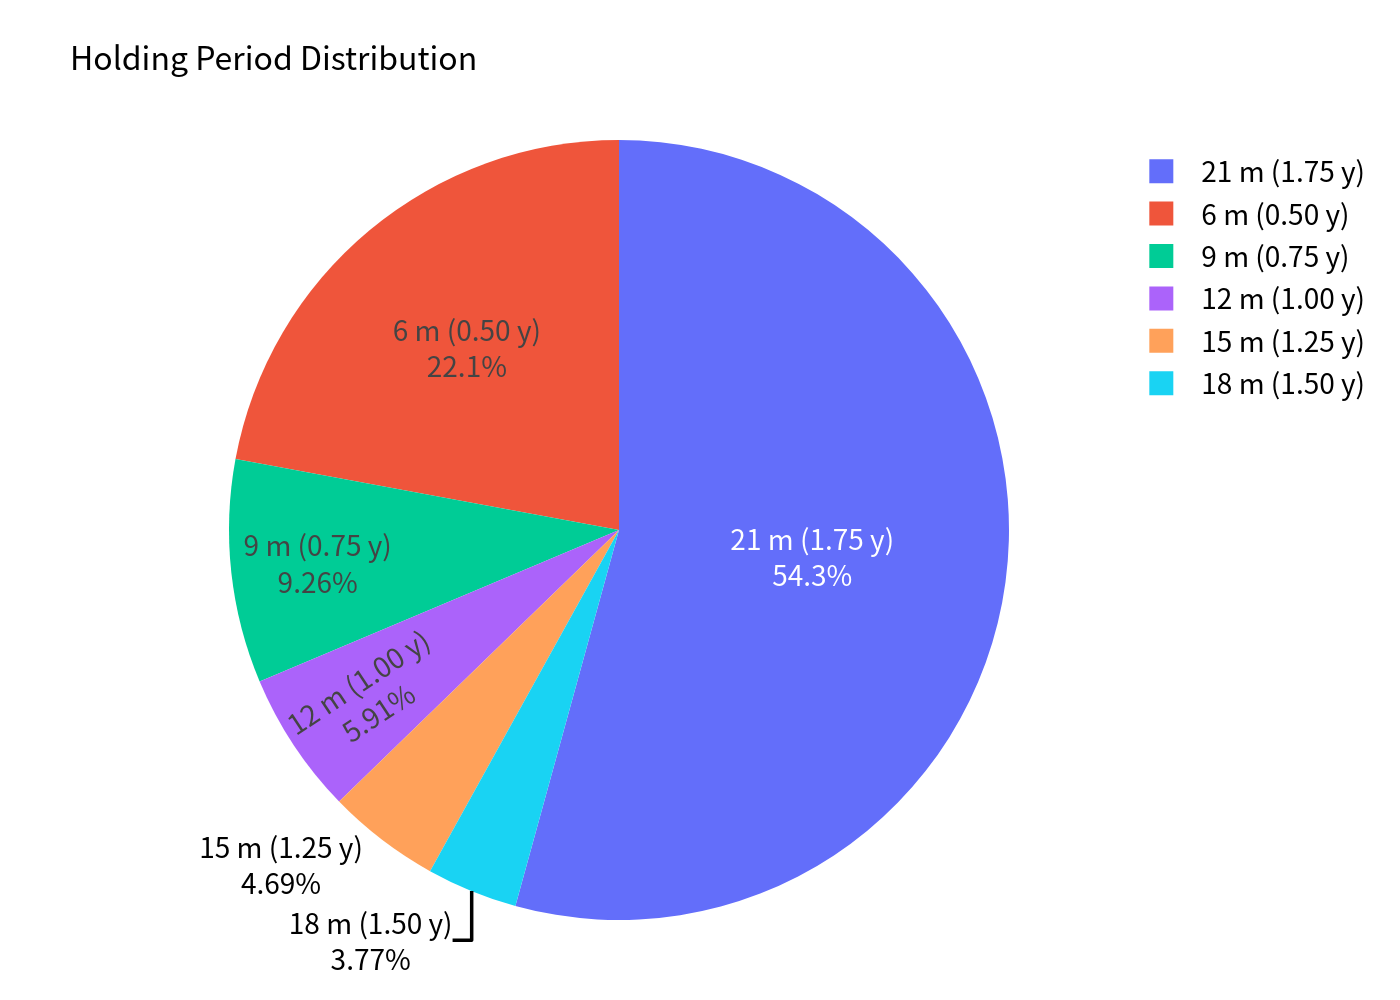
The note stays alive to maturity in ~54% of paths; otherwise it is called early (mostly at the 6-month date, ~22%):
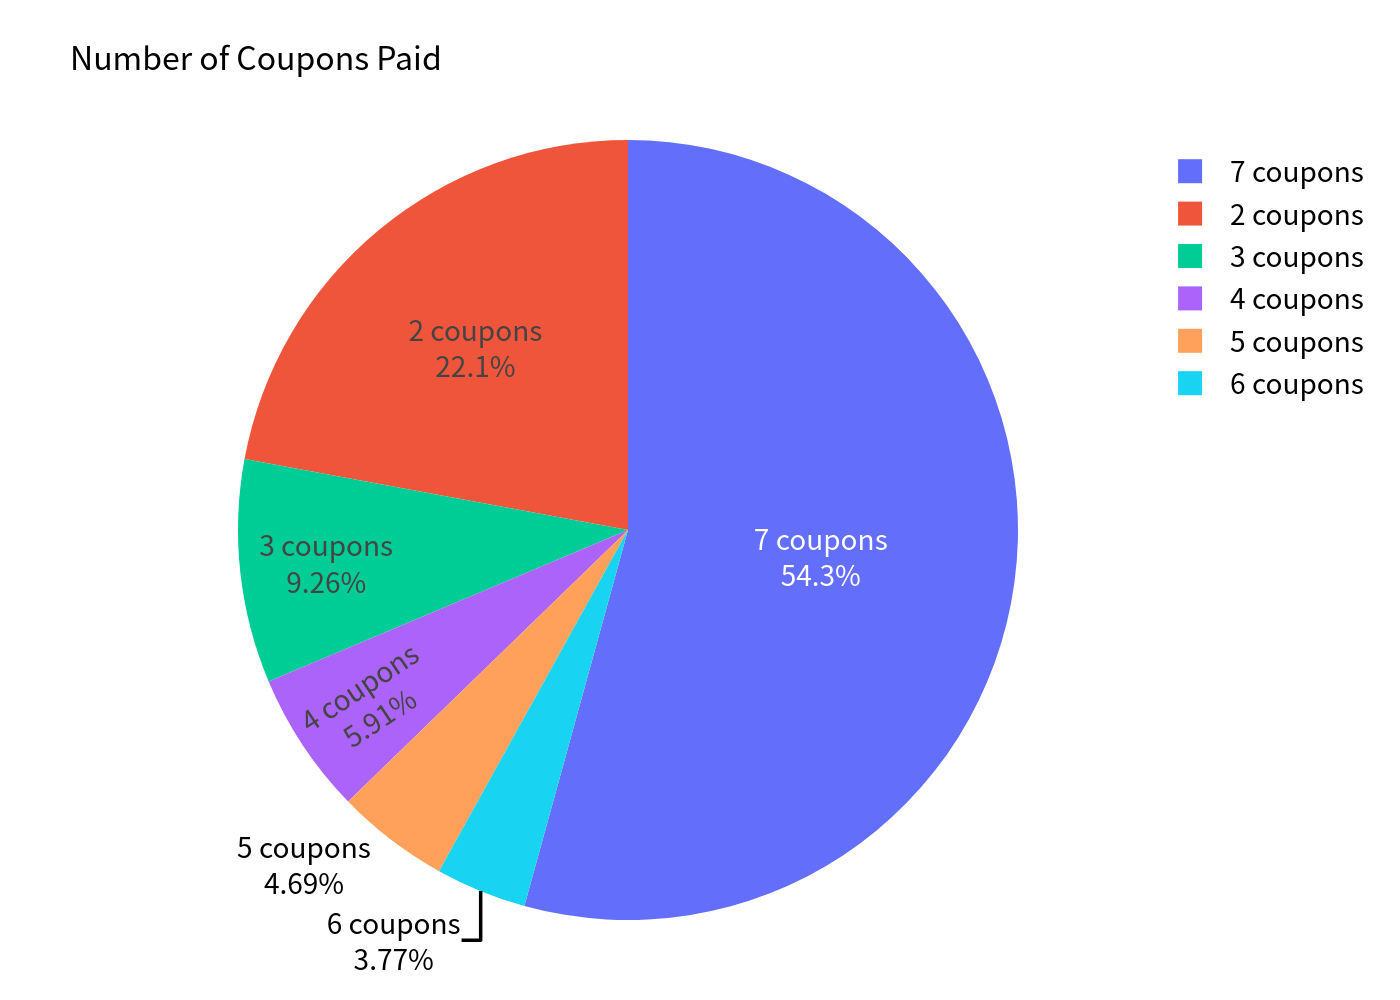
The number of coupons collected mirrors this – investors receive all seven coupons in ~54% of paths, and far fewer when the note is called early:
Investment Commentary
Points in favour
- A 9.00% p.a. headline coupon is attractive in a near-zero CHF interest-rate environment, and the note has an ~86% probability of beating cash.
- Conditional capital protection: as long as the 59% barrier holds (about 85% of simulated paths saw no breach at all), the investor's capital is returned in full and only a coupon is earned.
- Volatility is roughly halved versus owning the three shares directly (8.84% vs 15.83%), with a large proportion of paths (~40%) delivering the full coupon stream plus par.
- The underlyings are large, liquid, defensive-leaning Swiss names with modest-to-solid dividend support.
Points against
- Worst-of dependence: with three names, the payoff is driven by the single worst performer, materially raising the chance of a loss versus a single-name note.
- Thicker tail risk: the 99% VaR of -25.79% is worse than the underlying basket's -15.48%, and a capital loss occurs in ~14% of paths; the 59% barrier means losses can run to ~-40% in extreme cases.
- Upside is capped at par plus coupons – the note captures only a fraction of the equity upside (5.45% vs 13.14% expected for the basket).
- Issuer callability truncates the coupon stream: only ~54% of paths run the full ~21 months, keeping the expected return below the headline coupon.
- Investors bear the issuer's credit risk throughout the life of the note.