
Structured Product Analysis Report
Contingent Income Auto-Callable Securities — Worst of EURO STOXX 50 / Russell 2000 / S&P 500
Headline Simulation Results
Basic Product Information
How It Works (Layman Explanation)
This is a principal-at-risk structured note that pays a high contingent coupon and can be automatically redeemed early:
- Contingent coupon (~11.75% per annum, assumed midpoint of the 11.25%–12.25% range): A coupon of about 2.94% per quarter is paid only if, on the quarterly observation date, all three indices (EURO STOXX 50, Russell 2000, S&P 500) are at or above 80% of their initial levels. If any index is below 80%, no coupon is paid for that quarter.
- Automatic early redemption (autocall): From February 2027 (the first early-redemption determination date), on each quarterly observation date, if all three indices are at or above 100% of their initial levels, the note is redeemed early at par plus the coupon for that period. No further payments are made.
-
Maturity payoff (if never called):
- If all three indices finish at or above 70% of initial → you receive par (100% of principal) plus the final coupon, if payable.
- If any index finishes below 70% of initial → you lose 1% of principal for every 1% decline of the worst-performing index; the payment can be substantially less than par, or zero.
- Upside is capped: you do not participate in any appreciation of the indices. The best outcome is par plus the accumulated coupons.
- Key feature: the payoff depends on the worst-performing index — a decline in any single index hurts the return, so the three-index basket provides no diversification benefit.
Product Facts
| Attribute | Detail |
|---|---|
| Type | Contingent Income Auto-Callable Securities (Principal at Risk) |
| Underlyings | EURO STOXX 50® Index, Russell 2000® Index, S&P 500® Index (worst-of) |
| Notional / Currency | USD $1,000 per security |
| Coupon | 11.25%–12.25% p.a. (assumed 11.75% = midpoint, final rate set at pricing); paid quarterly if all underliers ≥ 80% of initial |
| Autocall | Quarterly from Feb 2027; triggered if all underliers ≥ 100% of initial |
| Downside threshold | 70% of initial (maturity only); worst-of loss participation |
| Upside | Capped (no participation in index gains) |
| Issuer risk | All payments subject to Morgan Stanley credit risk |
Key Statistics (Simulated, 10,000 Paths)
| Metric | Structured Product | Underlying Basket (Total Return)* |
|---|---|---|
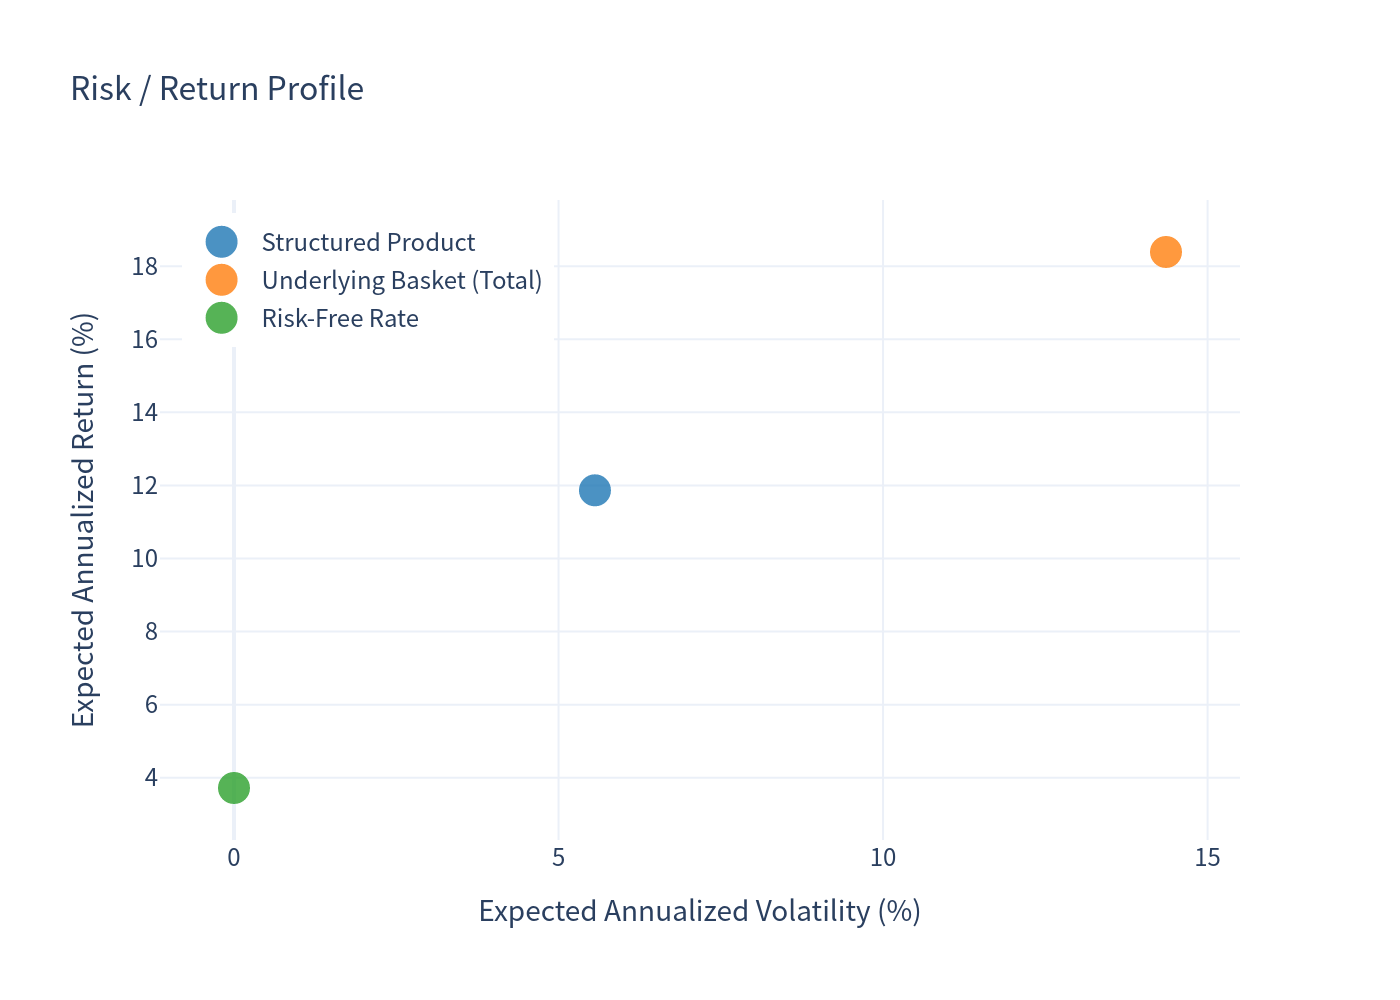
| Expected annualized return | 11.87% | 18.39% |
| Expected annualized volatility | 5.56% | 14.36% |
| Probability of loss | 3.88% | 6.47% |
| 99% confidence VaR (1 year) | -15.72% | -12.24% |
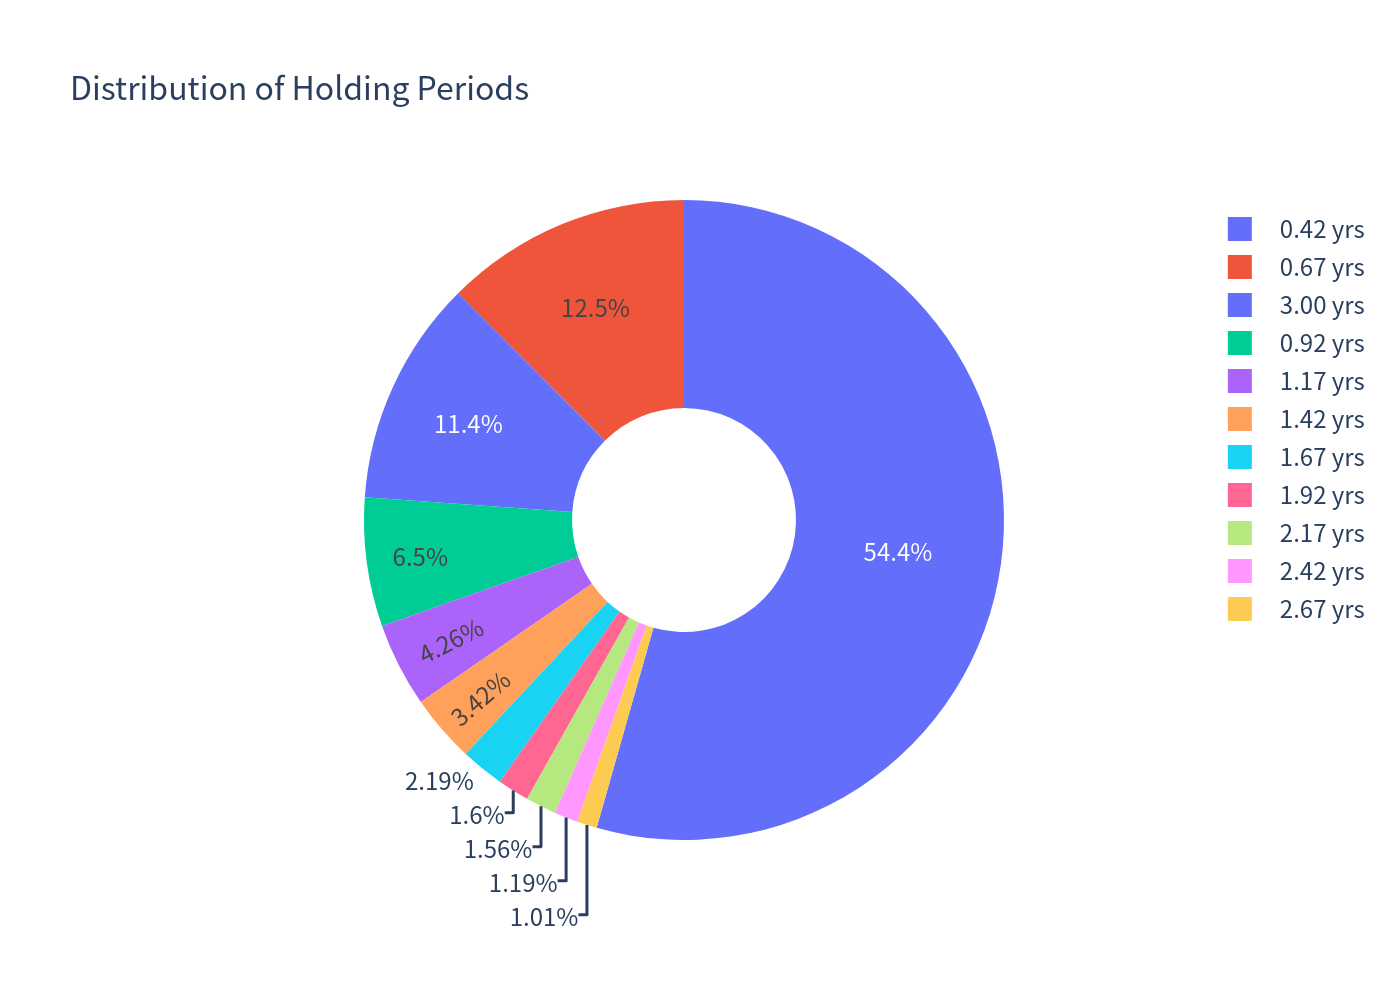
| Expected holding period | 11.59 months | (same horizon as product) |
*The benchmark is an equal-weight basket of the three underlier price indices (monthly rebalanced), plus the average dividend yield of the three indices (~1.49%), for comparability. Underlying returns are measured over the same horizon as the product (i.e., at each simulation's end month).
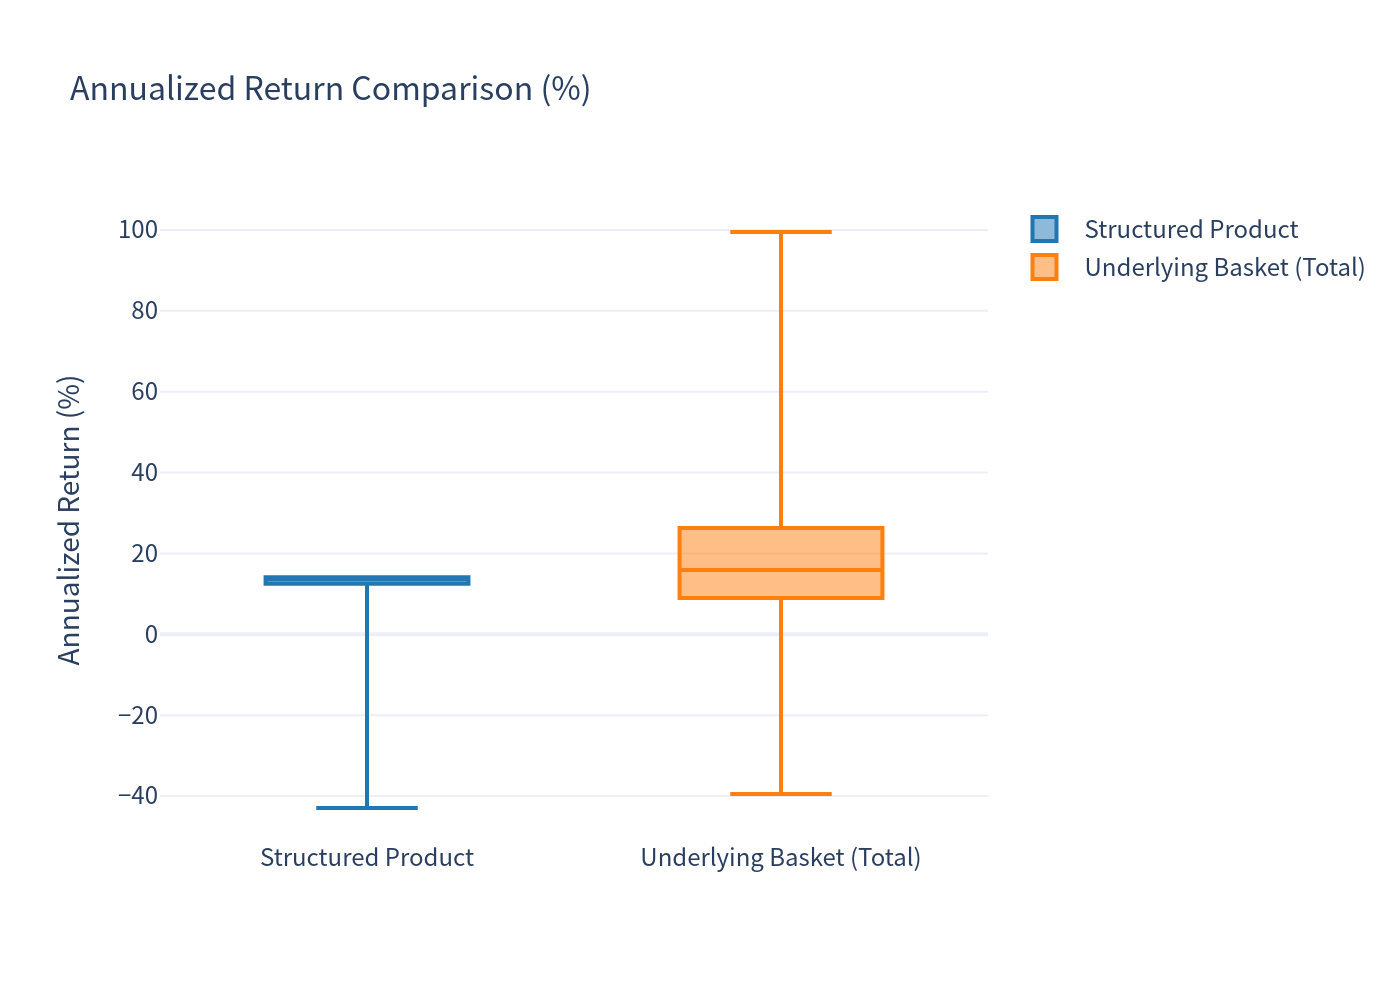
Interpretation: The structured product delivers a materially lower expected annualized return than the underlying basket (11.87% vs 18.39%) but with much lower volatility (5.56% vs 14.36%) and a lower probability of loss (3.88% vs 6.47%) — consistent with a capped-upside, income-oriented payoff. Its 99% VaR (-15.72%) is slightly worse than the basket's (-12.24%) because, when the worst index falls below the 70% barrier at maturity, the note participates 1-for-1 in the worst performer's decline without diversification relief.
Charts
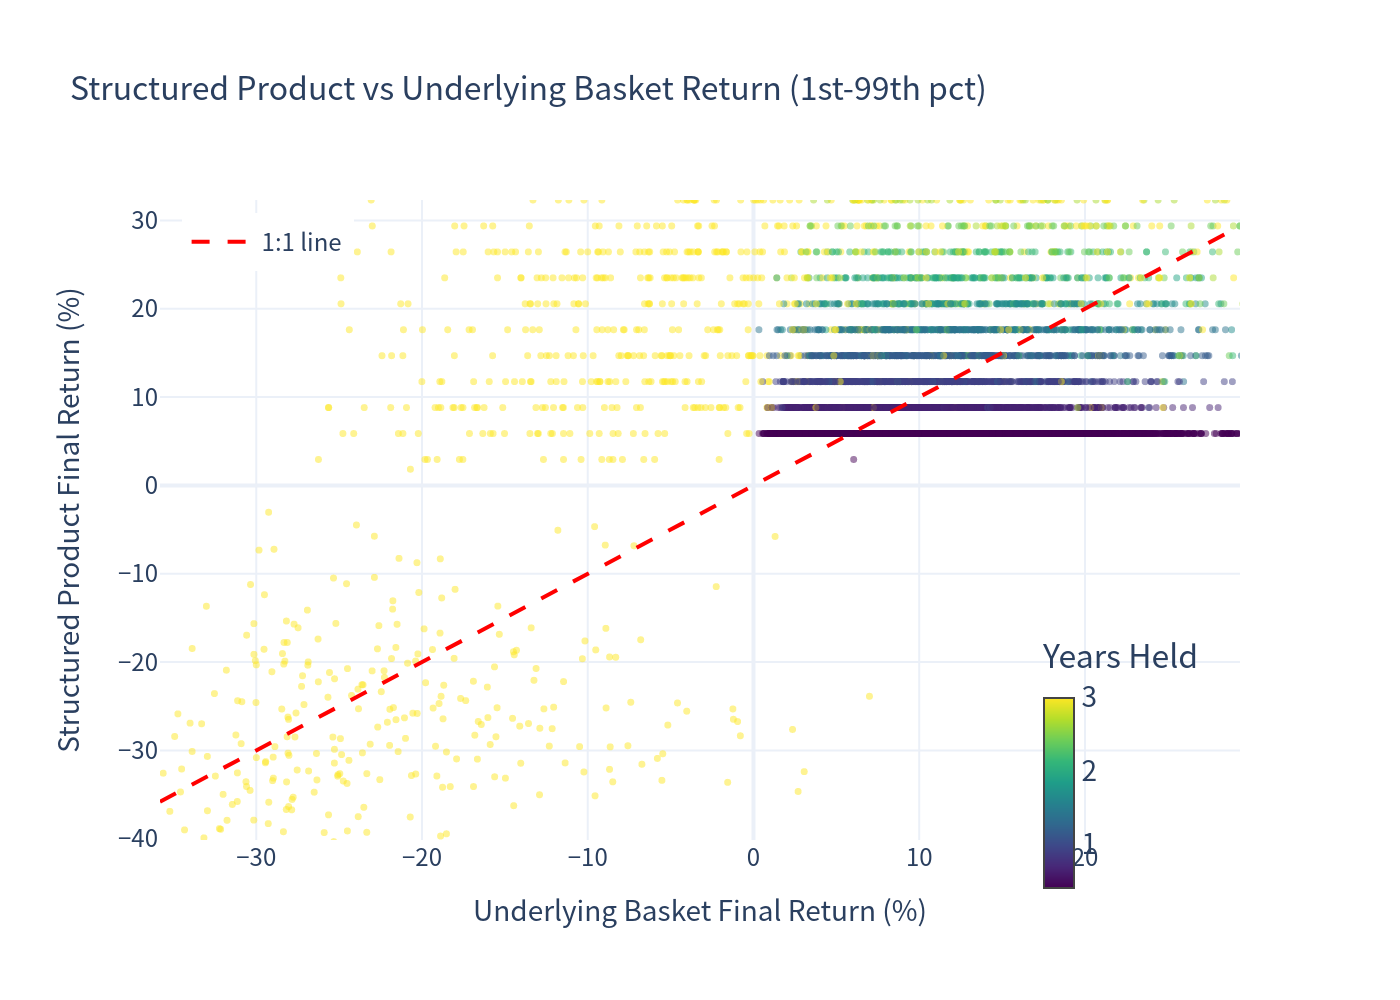
Simulation Outcomes Scatter
Scatter of each simulated outcome: structured product final return (Y) vs underlying basket final return (X), colored by years held, with a 1:1 reference line.
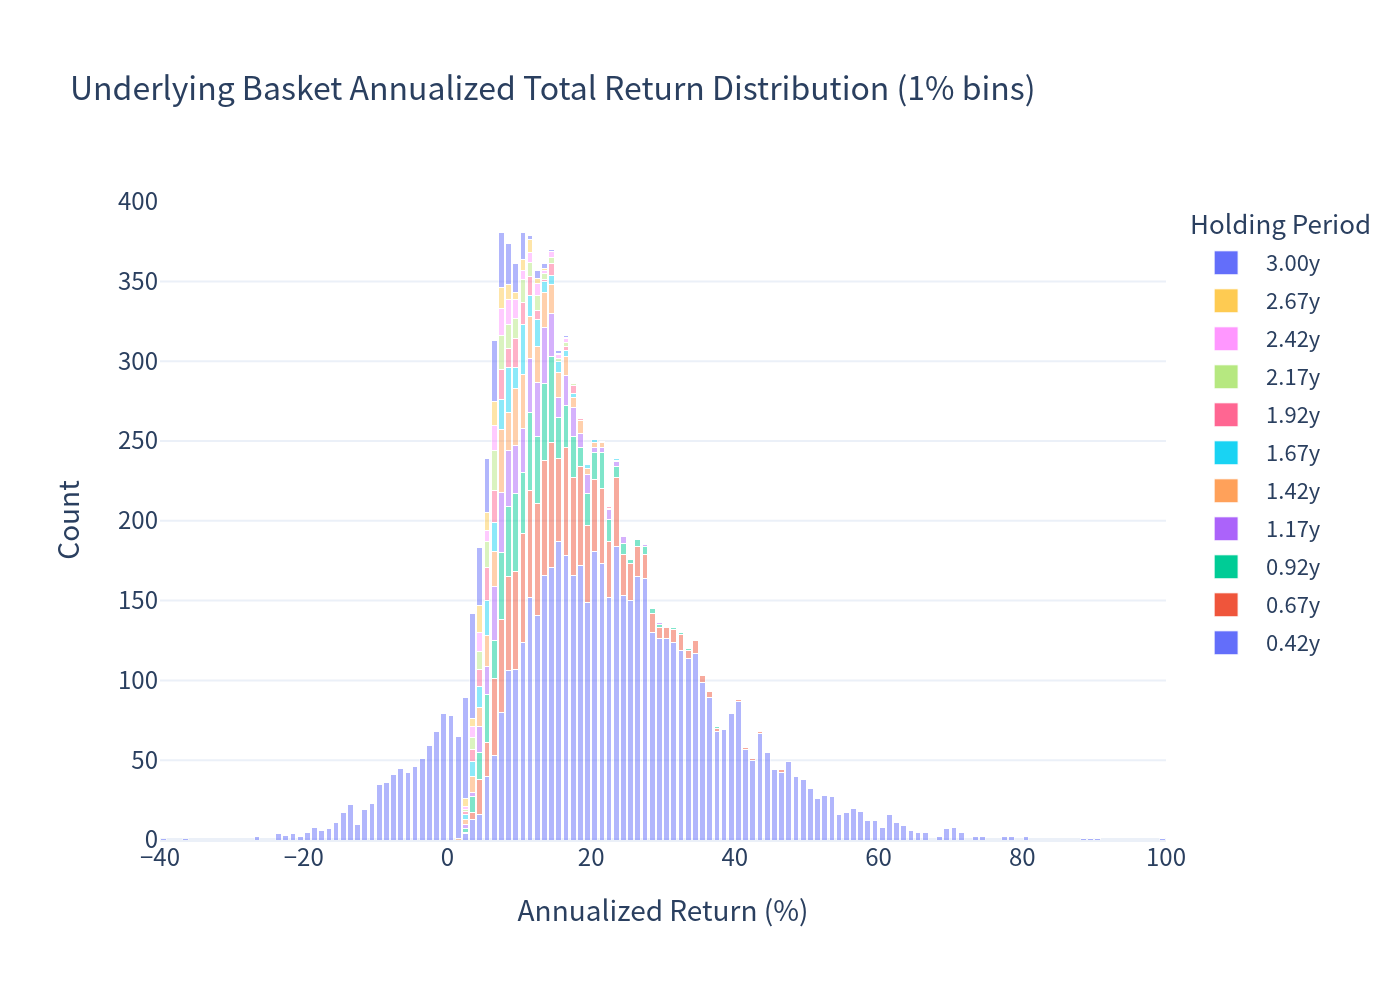
Underlying Basket Annualized Return Distribution
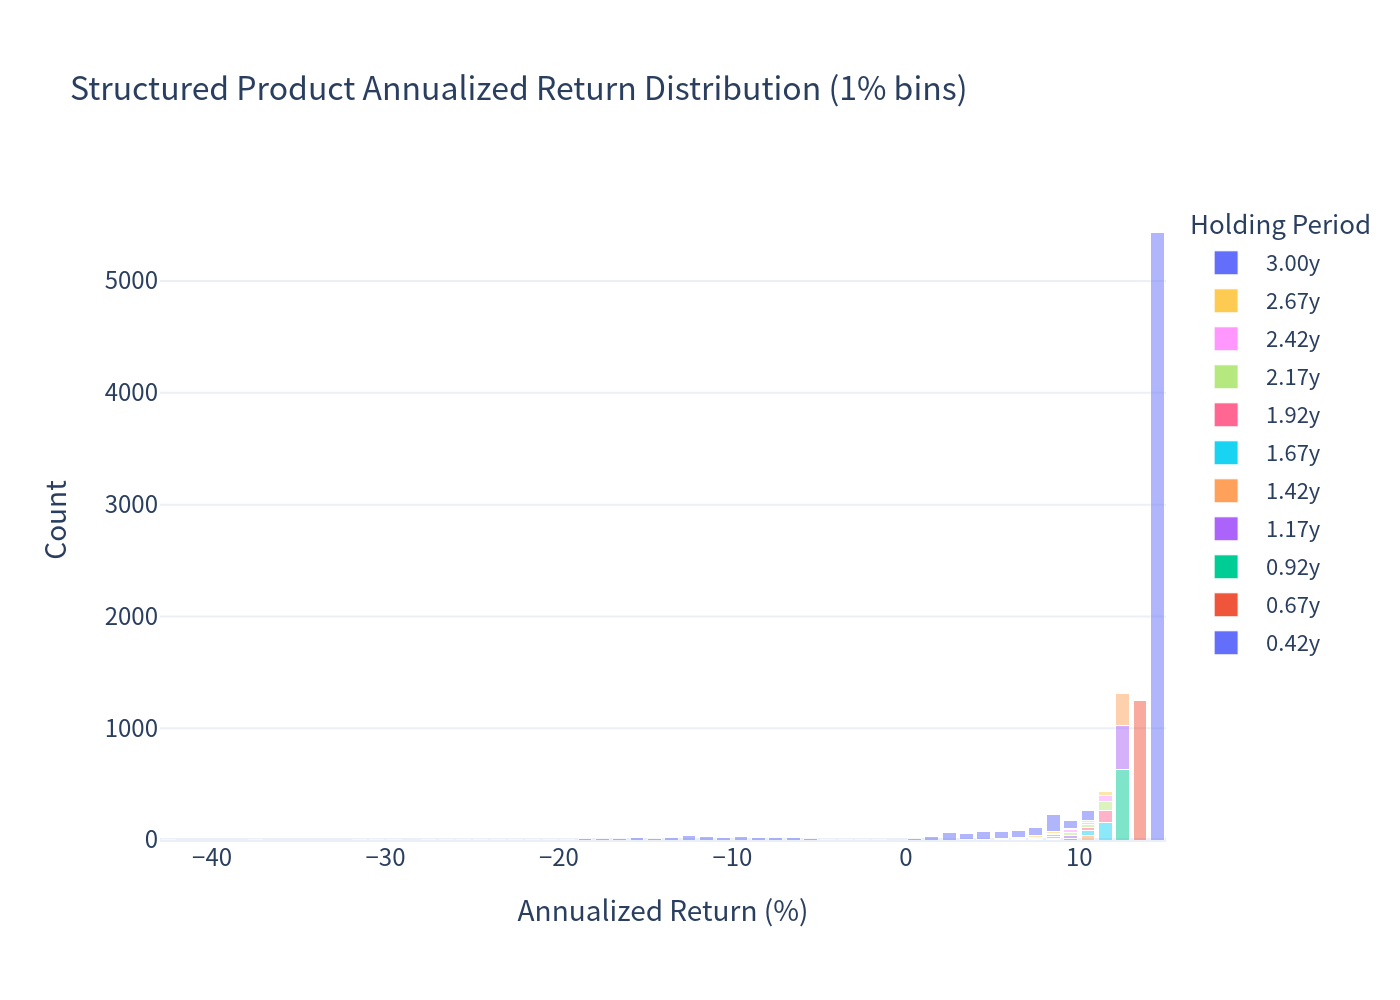
Structured Product Annualized Return Distribution
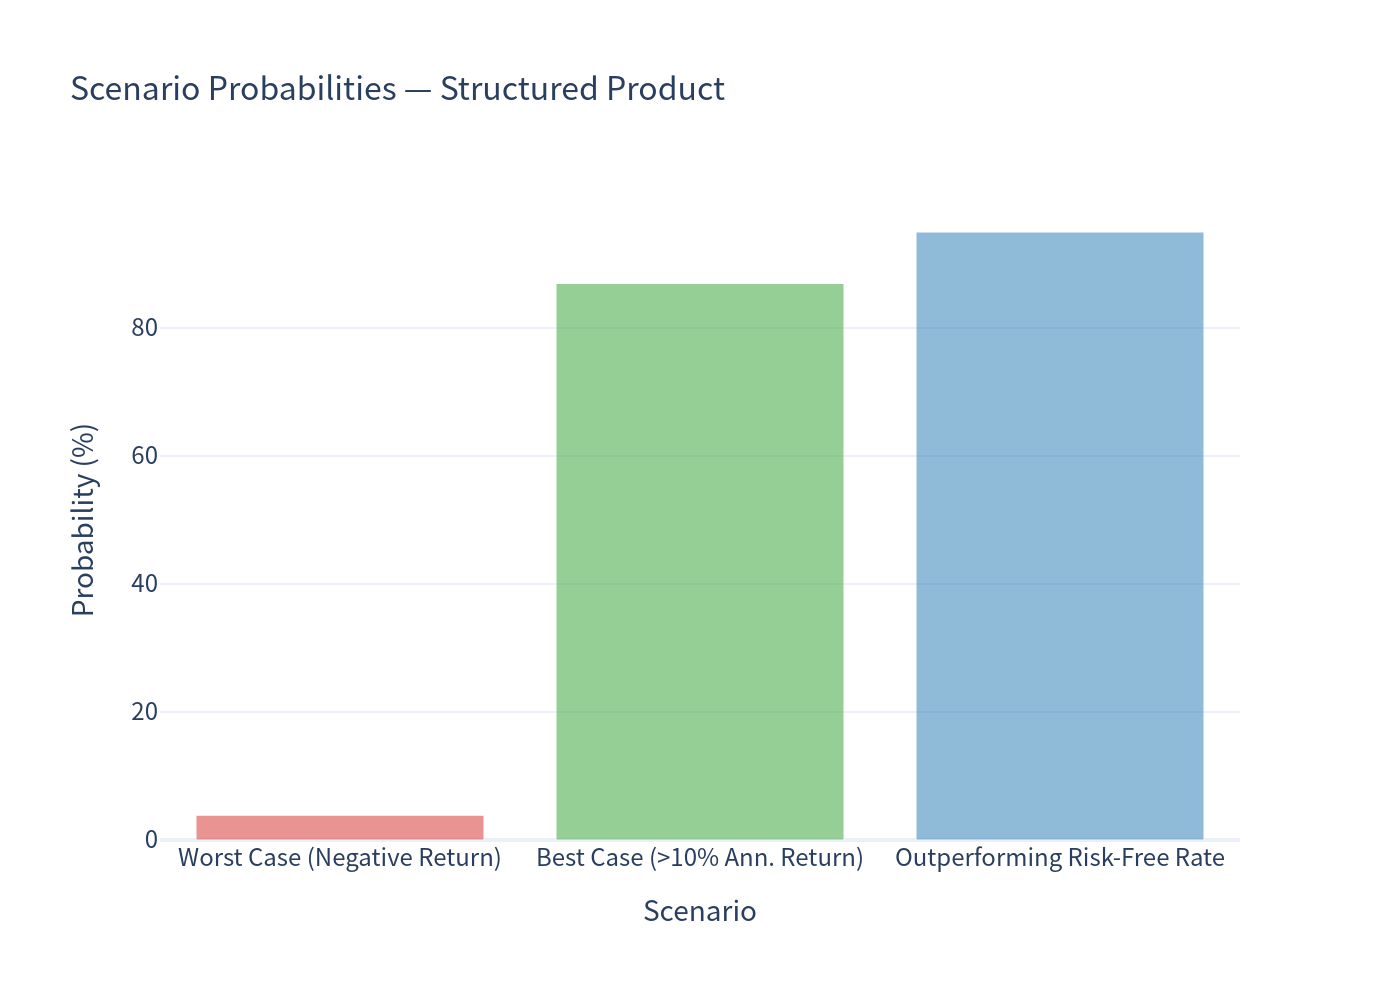
Scenario Probabilities
Risk / Return Profile
Annualized Return Comparison (Box Plot)
Holding Period Distribution
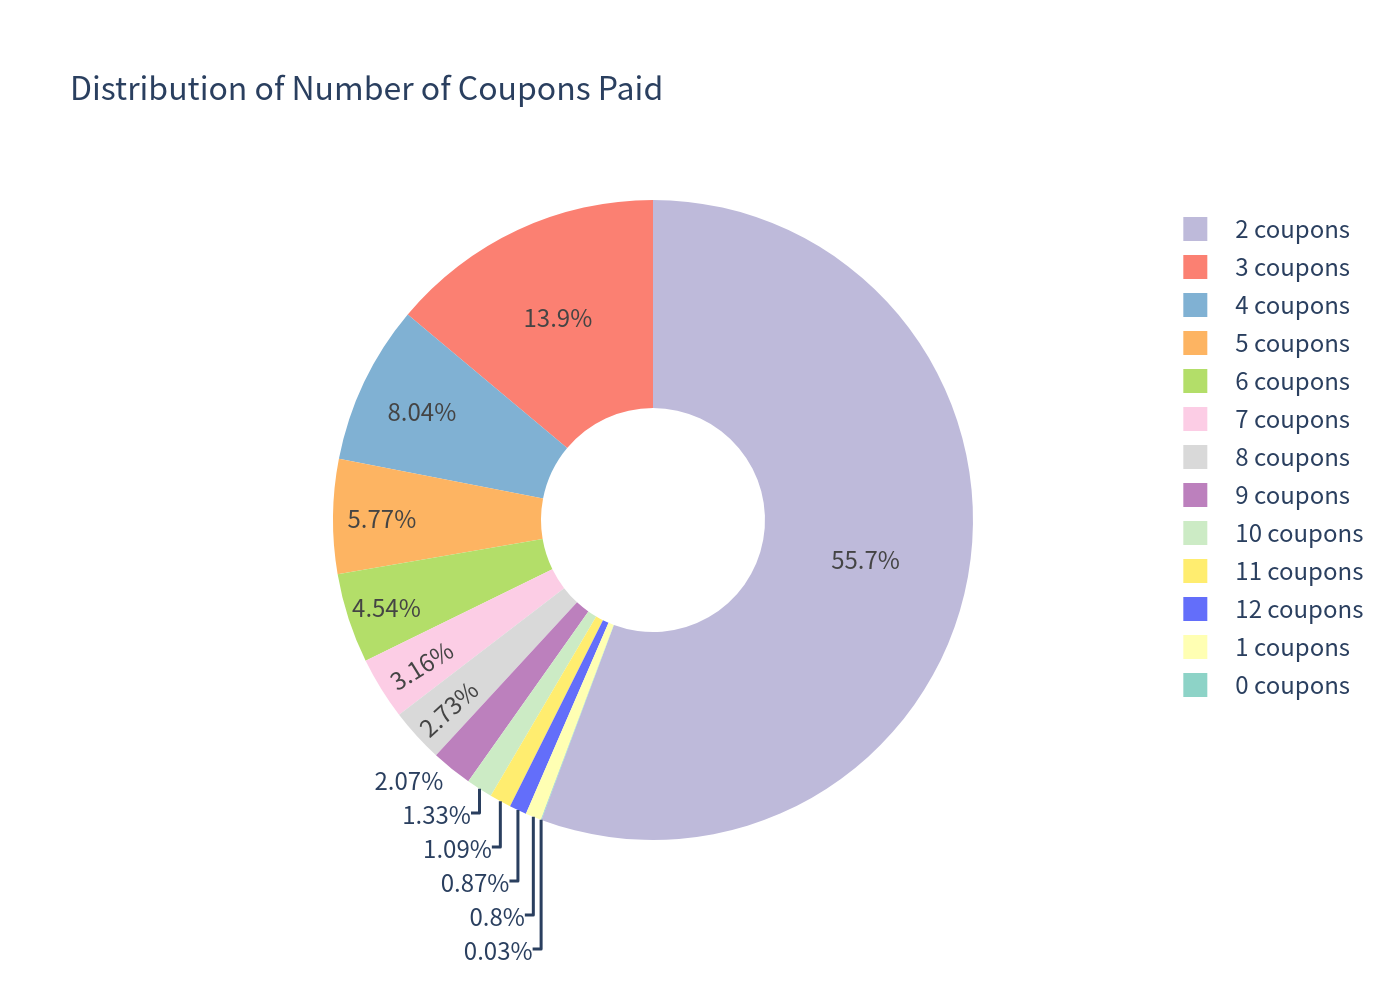
Number of Coupons Paid Distribution
Investment Commentary
Points in Favor
- Attractive contingent income: an ~11.75% p.a. coupon rate is well above typical investment-grade yields; coupons are paid quarterly whenever all three indices stay above 80% of their initial levels.
- High early-redemption frequency: in ~54% of scenarios the note is called back at the first early-redemption determination date (par + coupon), locking in up to a ~5.9% total return (two quarterly coupons) over ~6 months; ~89% of scenarios end with a positive return.
- Downside protection band: the 80% coupon barrier and 70% maturity barrier provide a meaningful cushion — no loss occurs unless an index falls more than 30% by maturity.
- Low return volatility: at 5.56% annualized, the product's return dispersion is far lower than the underlying indices (14.36%), reflecting the coupon income and par-redemption mechanics.
- No currency/quanto complexity and fully guaranteed by Morgan Stanley.
Points to Consider
- Principal is at risk: if any single index falls below 70% of its initial level by maturity, the note loses 1% for each 1% decline of the worst performer; losses can be severe (simulated 99% VaR of -15.72% annualized).
- Worst-of dependency: the three-index structure offers no diversification benefit — one weak index is sufficient to stop coupons, prevent autocall, or trigger principal loss.
- Coupons are not guaranteed: if any index is below 80% on an observation date, no coupon is paid for that period; some paths receive very few or zero coupons.
- Capped upside: the note does not participate in index appreciation; expected return is capped by the coupon stream plus par.
- Short-horizon annualization: because the note is usually called early, headline annualized returns exceed the total returns actually realized over the ~1-year average holding period.