
Structured Product Analysis Report
| Metric | Structured Product | Underlying (S&P 500 with dividends) |
|---|---|---|
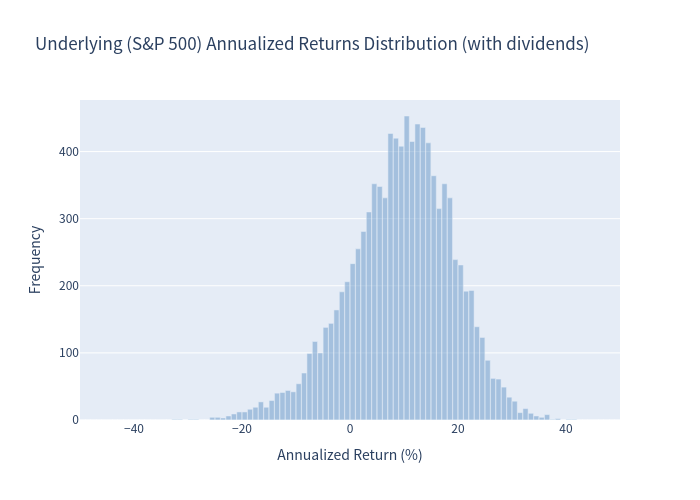
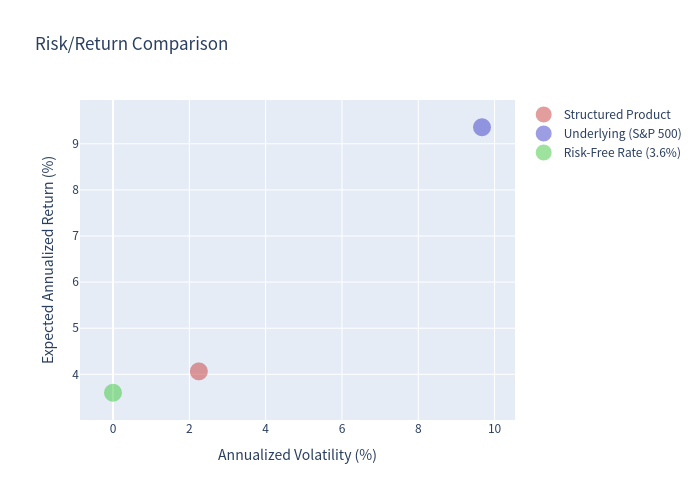
| Expected Annualized Return | 4.06% | 9.36% |
| Expected Annualized Volatility | 2.25% | 9.67% |
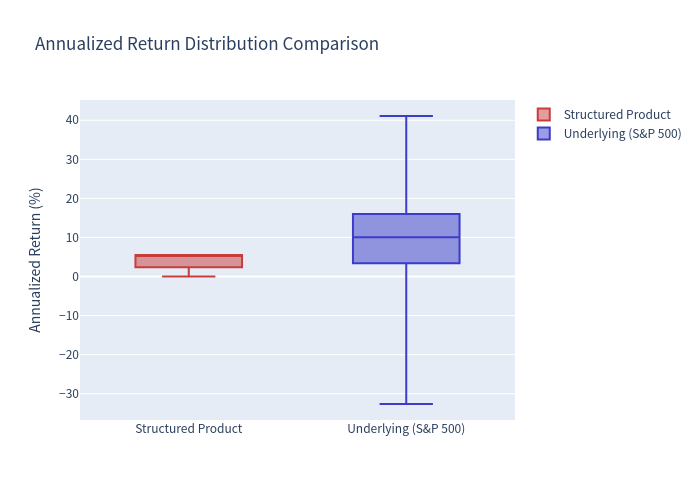
| Probability of Negative Annualized Return | 0.00% | 16.14% |
| 99% Confidence VaR (1-year) | 0.00% | -16.47% |
| Expected Total Return (3-year) | 12.85% | 33.82% |
How It Works
This is a principal-protected market-linked note with capped upside participation in the S&P 500 Index:
- Initial Investment: $1,000 per note (100% of par)
- Term: Approximately 3 years (May 2026 to June 2029)
- No Interest/Coupons: The notes do not pay any interest during the term
- Principal Protection: At maturity, investors receive at least 100% of the stated principal amount regardless of the S&P 500's performance
At Maturity (June 1, 2029):
- If the S&P 500 closes higher than its initial level: Investor receives $1,000 + 100% of the appreciation, subject to a maximum payment of $1,175 per note (17.50% total return, ~5.53% annualized)
- If the S&P 500 closes at or below its initial level: Investor receives only the $1,000 stated principal amount (0% return)
The note provides full downside protection but caps upside potential. There is no early redemption feature, no barrier, and no coupon payments.
Structured Product
| Expected Annualized Return | 4.06% |
|---|---|
| Expected Annualized Volatility | 2.25% |
| Expected Total Return (3-year) | 12.85% |
| Probability of Loss | 0.00% |
| 99% VaR (1-year) | 0.00% |
| Maximum Possible Annualized Return | 5.52% |
| Maximum Possible Total Return | 17.50% |
Underlying Asset: S&P 500® Index (with dividends)
| Expected Annualized Return | 9.36% |
|---|---|
| Expected Annualized Volatility | 9.67% |
| Expected Total Return (3-year) | 33.82% |
| Probability of Loss | 16.14% |
| 99% VaR (1-year) | -16.47% |
| Current Dividend Yield | 1.03% |
Scatter Plot: Structured Product vs Underlying Returns
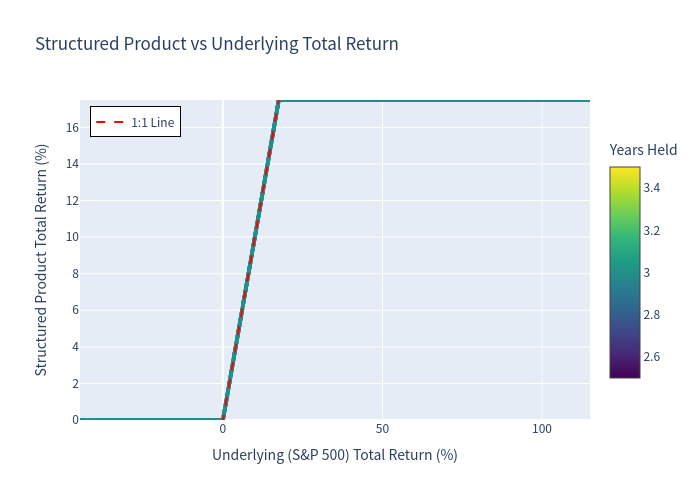
Each point represents one simulation. The red dashed line is the 1:1 reference line. The structured product's returns are capped (horizontal band at ~17.5%) and floored (horizontal band at 0%), creating the characteristic "hockey stick" shape of a principal-protected note.
Histogram: Underlying Annualized Returns
Histogram: Structured Product Annualized Returns
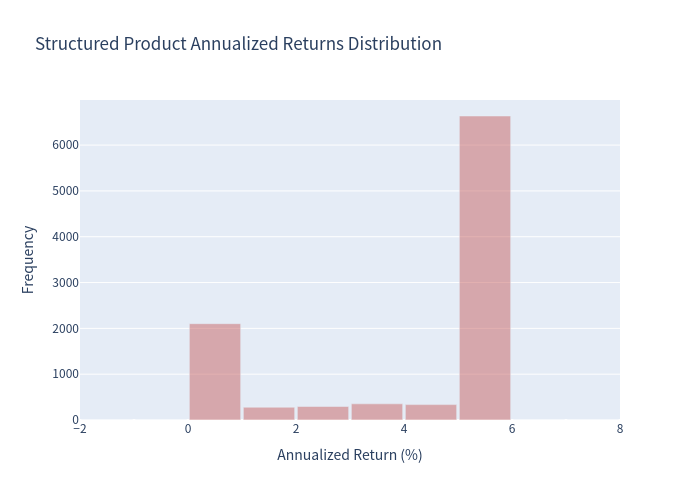
The structured product shows a bimodal distribution: a spike at 0% (when the S&P 500 ends lower) and a concentration near the cap of ~5.52% annualized (when the S&P 500 appreciates enough to hit the cap).
Scenario Probabilities
Risk/Return Comparison
Box Plot Comparison
Probability Distribution
| Scenario | Probability | Description |
|---|---|---|
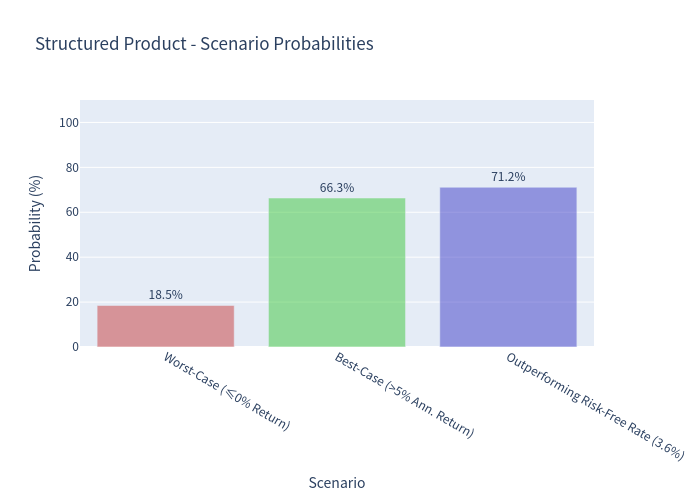
| Zero Return (Principal Only) | 18.49% | S&P 500 ends at or below initial level |
| Positive Return (Below Cap) | 15.16% | S&P 500 appreciates but doesn't hit cap |
| Maximum Cap Return | 66.35% | S&P 500 appreciates enough to trigger maximum payment |
| Outperforming Risk-Free Rate (3.6%) | 71.15% | Note's annualized return exceeds 1-year Treasury rate |
- Opportunity cost: In strong bull markets, the note's capped return will significantly underperform a direct S&P 500 investment
- No income: Unlike many fixed-income products, this note pays no current income
Key Features
- Full Principal Protection: Regardless of how poorly the S&P 500 performs, investors receive their full $1,000 principal at maturity
- Simple Structure: The payoff is straightforward and easy to understand compared to complex barrier or autocall products
- No Coupon Risk: Since there are no coupon payments, there is no risk of coupon interruption or early redemption
Considerations
- Capped Upside: The maximum return of 17.50% total over 3 years (~5.53% annualized) limits participation in strong equity market rallies
- No Income: The note provides no current yield, which may be a disadvantage for income-focused investors
- Credit Risk: All payments depend on Morgan Stanley Finance LLC and Morgan Stanley's creditworthiness
- Single Observation Date: The final level is based only on the closing level on May 29, 2029. Even if the S&P 500 rises significantly during the term, only the final level matters
- Inflation Risk: If inflation exceeds the note's return, the real purchasing power of the investment declines
- Historical data for the S&P 500 Index was used to calibrate a GJR-GARCH(1,1) model with Student's t distribution
- 10,000 Monte Carlo simulations were run over a 36-month horizon
- Drift = Risk-free rate (3.6%) + Equity risk premium (6.0%) = 9.6% annual
- Dividend yield of 1.03% was added to underlying returns for comparison purposes
- The analysis assumes no default by the issuer or guarantor
tokenengine.ai
Structured Product Evaluator
info@tokenengine.ai
© 2026 tokenengine.ai — Structured Product Analysis Report • Market-Linked Notes due June 1, 2029 • Morgan Stanley Finance LLC
This report is for informational purposes only and does not constitute investment advice.