
Contingent Income Memory Auto-Callable Securities — Evaluation Report
| Metric | Structured Product | Underlying Basket (total return) |
|---|---|---|
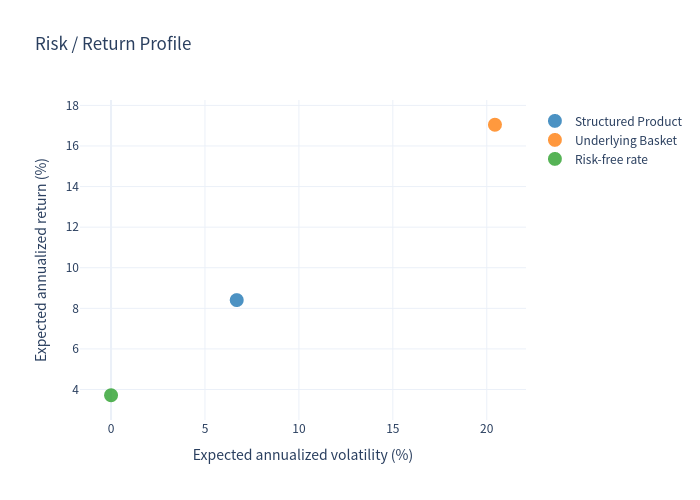
| Expected annualized return | 8.41% | 17.05% |
| Expected annualized volatility | 6.69% | 20.44% |
| Probability of negative return | 6.93% | 18.25% |
| 99% VaR (1-year annualized) | -22.90% | -17.46% |
- Expected total return over the realized holding period: 11.77% (mean), median 7.88%
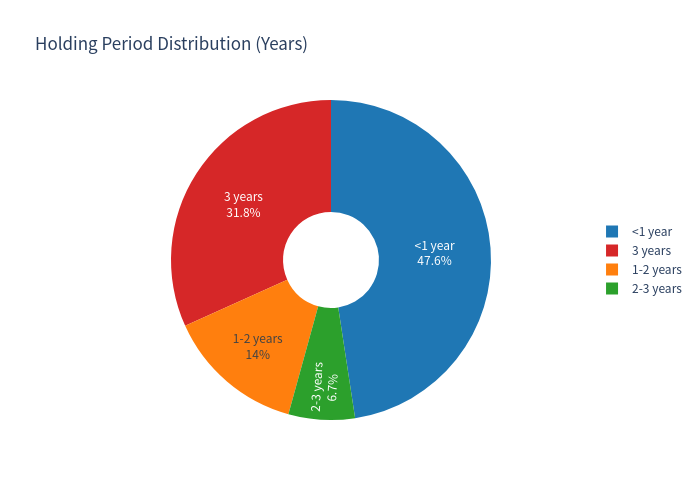
- Expected holding period: 18.97 months (~1.6 years)
- Probability of automatic early redemption: 68.25%; held to maturity: 31.75%
Morgan Stanley Finance LLC — Contingent Income Memory Auto-Callable Securities due September 6, 2029 (CUSIP 61781DEV6), fully guaranteed by Morgan Stanley. Principal-at-risk notes, $1,000 stated principal amount, linked to the worst performing of three underliers:
- iShares® Silver Trust (SLV) — silver bullion ETF
- Nasdaq-100® Technology Sector Index⊃SM (NDXT)
- Russell 2000® Index (RTY)
How it works (layman's explanation)
Contingent coupon (~10.50% p.a., paid monthly): Each month, if all three underliers close at or above 50% of their initial levels, investors receive a coupon (≈0.88 points per $100 notional). If any underlier is below 50%, that month's coupon is skipped — but thanks to the memory feature, missed coupons are paid together with the next coupon once all underliers recover above the 50% barrier.
Automatic early redemption (autocall): From the 6th month onward, if all three underliers close at or above 100% of their initial levels on a monthly observation date, the note is redeemed early at par + the current coupon + any remembered coupons. No further payments are made.
Maturity payoff: If the note survives to maturity and all three underliers finish at or above 50% of initial, investors receive par plus the final coupon and any remembered coupons. If any underlier finishes below 50%, investors lose 1% of principal for every 1% decline of the worst-performing underlier (principal can fall toward zero).
Investors do not participate in any upside appreciation of the underliers; the coupon stream is the entire source of return, and principal is at risk if the basket falls.
| Statistic | Structured Product | Underlying Basket (with dividends) |
|---|---|---|
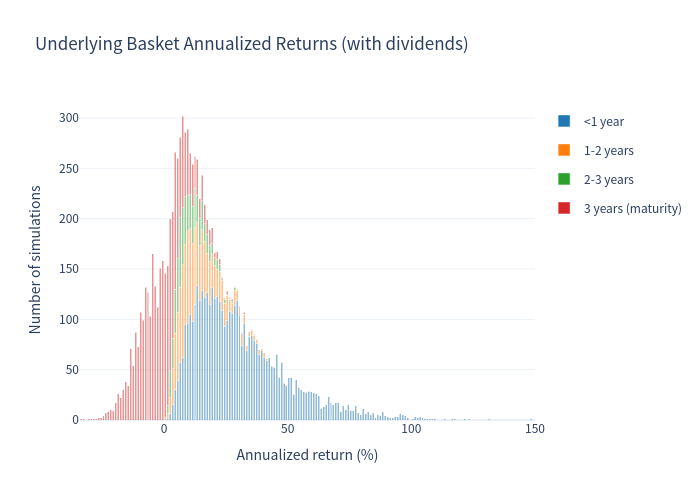
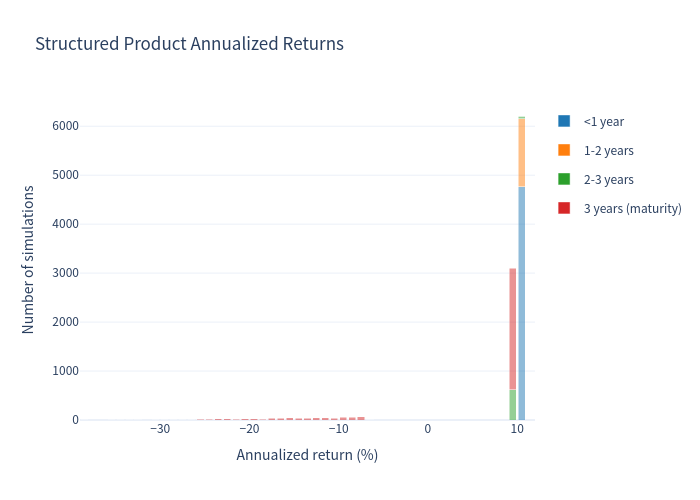
| Expected annualized return | 8.41% | 17.05% |
| Expected annualized volatility | 6.69% | 20.44% |
| Probability of loss | 6.93% | 18.25% |
| 99% VaR (1-yr annualized) | -22.90% | -17.46% |
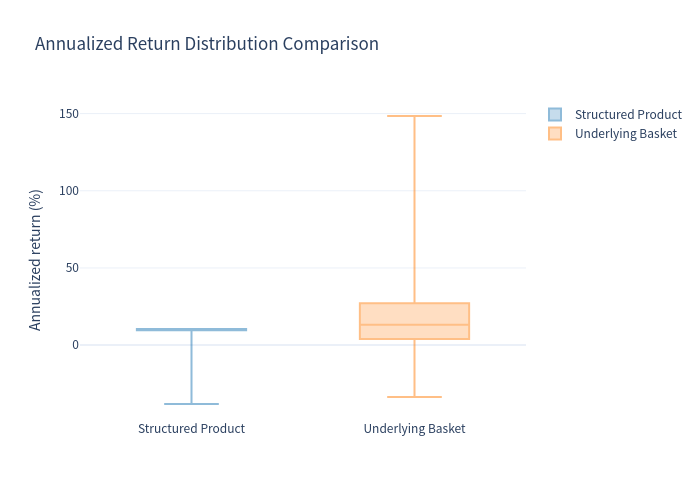
| Median annualized return | 10.46% | 13.15% |
| Mean total return (realized horizon) | 11.77% | 11.63% |
| Minimum total return | -76.34% | — |
| Maximum total return | 31.50% | — |
Holding-period outcomes
- Autocalled in year 1 (months 6–12): 49.58% of simulations
- Autocalled in year 2 (months 13–24): 12.51%
- Autocalled in year 3 (months 25–35): 6.16%
- Held to maturity (month 36): 31.75%
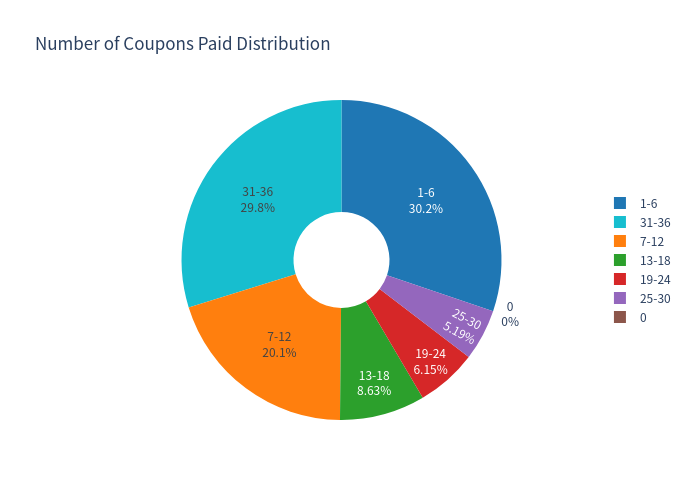
- Average coupons received: 18.20 (median 12); full 36-coupon schedule received in 24.82% of simulations
- Of the 31.75% held to maturity: 78.17% returned par; 21.83% incurred a principal loss (average principal in loss scenarios ≈ 39.95, i.e. ~-60%)
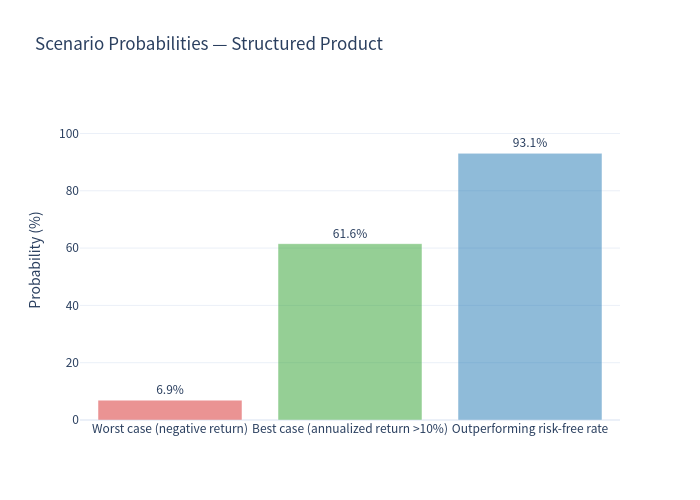
Scenario probabilities (structured product)
- Worst case (negative return): 6.93%
- Best case (annualized return > 10%): 61.55%
- Outperforming the risk-free rate (3.72%): 93.07%
Simulation Outcomes — Structured Product vs Underlying Basket
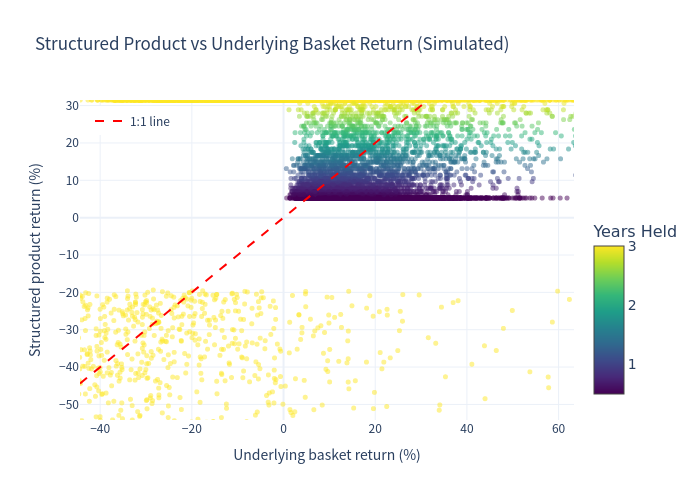
Annualized Return Histograms (stacked by holding period)
Scenario Probabilities
Risk / Return Profile
Annualized Return Box Plot Comparison
Holding Period & Coupon Distributions
Attractive features
- High contingent coupon (~10.50% p.a.) with a memory feature — missed coupons are recovered once all underliers rebound above 50%.
- Strong probability of receiving coupons: coupons were paid in the large majority of months simulated; the median path collected 12 coupons, and 24.82% of paths collected the full 36-coupon schedule (about 31% of simulations reached maturity).
- 93.07% of simulated outcomes outperformed the 1-year risk-free rate (3.72%), and the probability of any loss was only 6.93%.
- Early redemption (autocall) probability is high (68.25%), typically returning par plus accumulated coupons within ~1–2 years.
- Losses are cushioned by a 50% downside threshold — the note only loses principal if the worst underlier finishes below 50% of its initial level at maturity.
Risk considerations
- Worst-of structure: a decline in any single underlier (silver, Nasdaq tech, or small caps) can hurt returns even if the other two perform well — no diversification benefit.
- Principal at risk: in the worst simulated outcomes, the note lost over 76% of principal (worst-of tail risk), and the 99% VaR of -22.90% is more severe than the underlying basket's -17.46%, reflecting the asymmetric worst-of exposure.
- Upside is capped: investors receive only coupons and par — no participation in underlier appreciation.
- Coupons are contingent: if any underlier closes below the 50% coupon barrier on an observation date, that month's coupon is skipped (though it may be recovered later via the memory feature; if the barrier is never re-crossed, it is forfeited).