
Structured Product Evaluation — Morgan Stanley Buffered PLUS due February 23, 2029
1. Headline Simulation Results
Over the fixed 3-year term, the average simulated total return is +18.22% (median 0.00%), versus +11.97% for simply holding the underlying. The structure delivers a higher average outcome than the underlying because the 20% buffer materially reduces the deep-loss tail, while the 150% upside participation still captures a large share of the upward tail.
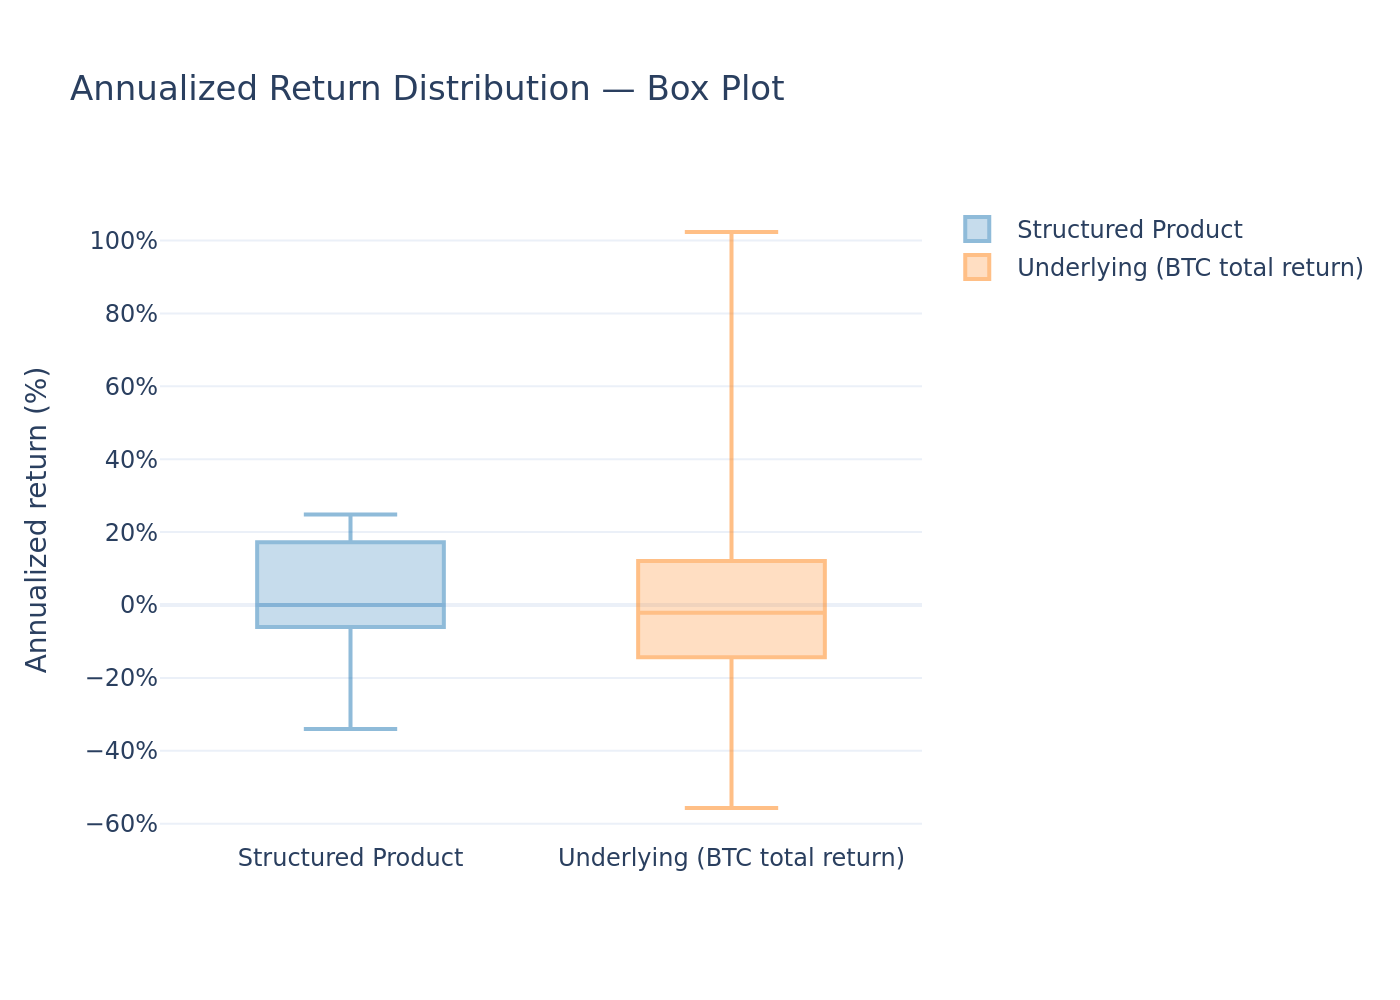
How to read "expected annualized return" vs. "expected total return." The expected annualized return (3.81%) is the average across all 10,000 simulations of each path's own annualized (CAGR) return. The expected total return (+18.22%) is the average of each path's total 3-year return. Because the return distribution is heavily right-skewed, the average of the per-path CAGRs is lower than the single CAGR implied by the average total return — the two figures are different statistics and are not related by a simple cube-root. The same logic applies to the underlying: its average per-path CAGR is -0.19%, while the average of its per-path total returns is +11.97%.
2. Product Overview & How It Works
This is a 3-year "Buffered PLUS" note issued by Morgan Stanley Finance LLC and guaranteed by Morgan Stanley. It pays no interest and no coupons — the entire return comes from a single payoff at maturity (February 2029), linked to the price of the iShares Bitcoin Trust ETF.
In plain terms:
- If Bitcoin is up at maturity: the investor receives full principal plus 1.5× the gain, but total payout is capped at 194.50% of principal (upside ceiling).
- If Bitcoin is flat to down by up to 20%: the investor gets their principal back (the 20% "buffer" absorbs the first 20% of losses).
- If Bitcoin falls more than 20%: the investor loses 1% of principal for every 1% below the buffer — losses beyond -20% are fully exposed, floored at a 20% minimum payment (worst case return of -80%).
There is no early redemption/autocall feature — the note is always held the full 3 years and settles once at maturity.
3. Key Statistics
| Metric | Structured Product | Underlying (BTC total return) |
|---|---|---|
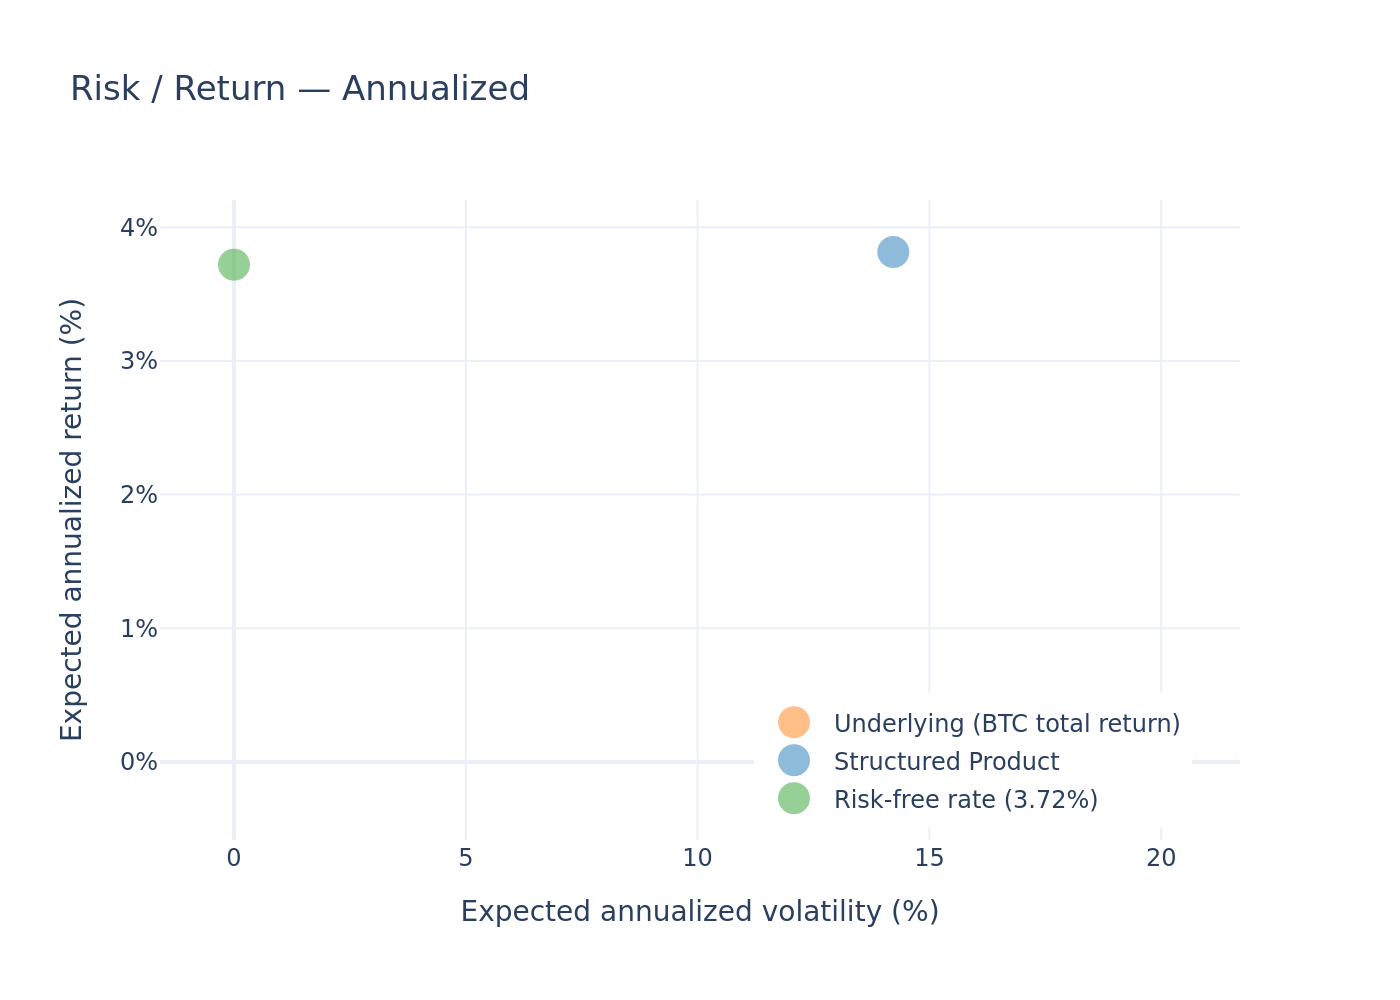
| Expected annualized return (avg. of per-path CAGR) | 3.81% | -0.19% |
| Expected annualized volatility | 14.22% | 20.10% |
| Probability of loss | 39.67% | 54.40% |
| 99% VaR (1 year) | -24.57% | -38.80% |
| Expected total return (mean of per-path 3y returns) | 18.22% | 11.97% |
Risk-free rate used for reference: 3.72% (1-year average). The underlying pays no dividend.
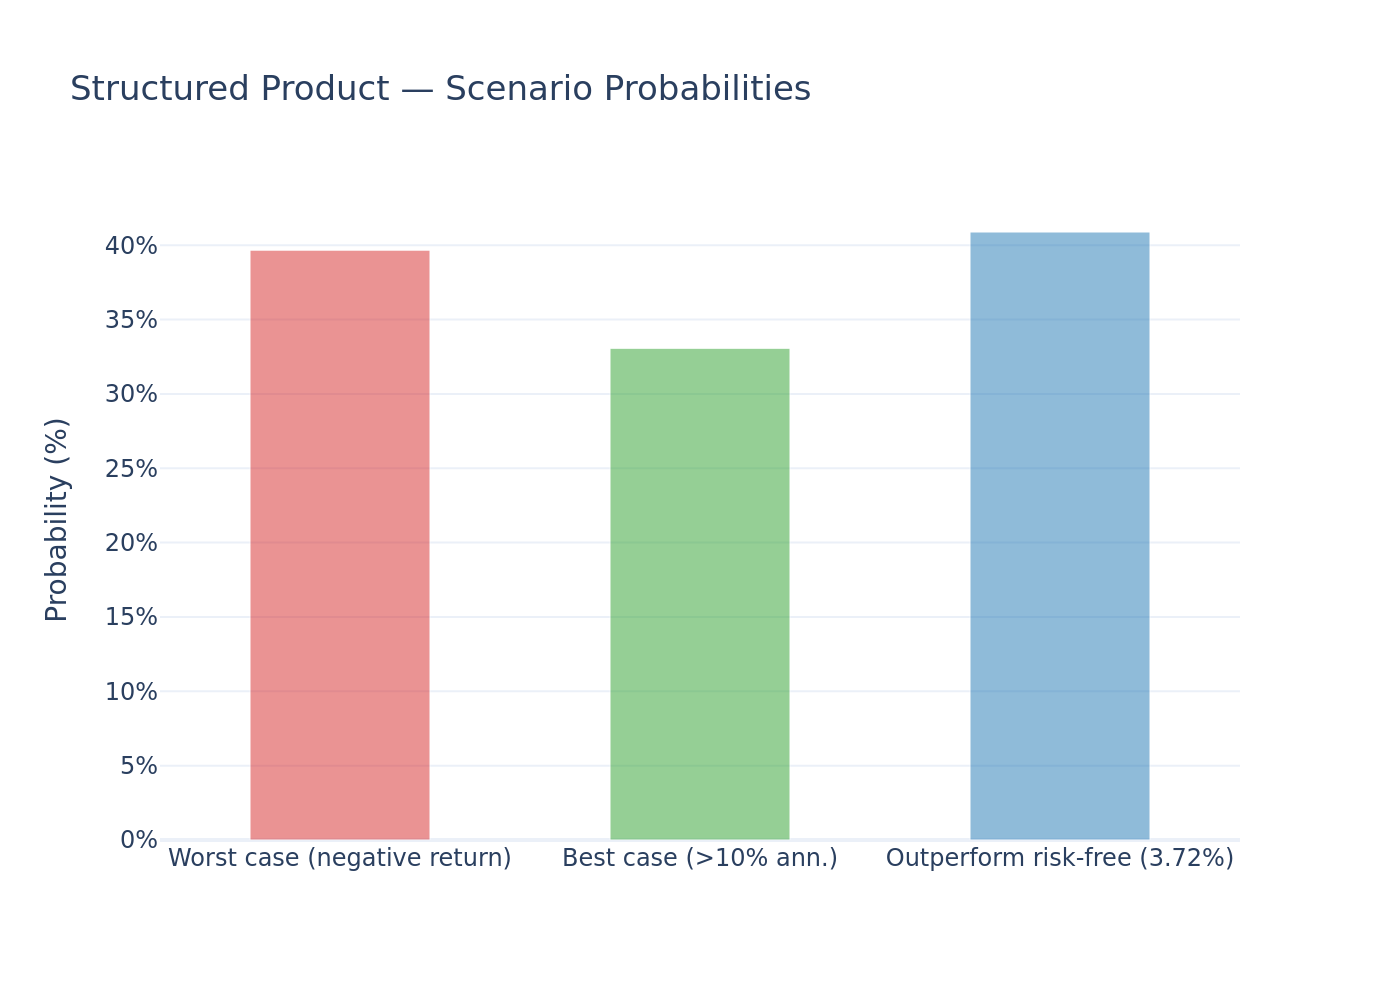
Scenario probabilities (product):
- Negative return (worst-case scenario): 39.67%
- Annualized return above 10% (best-case scenario): 33.07%
- Outperforming the risk-free rate: 40.89%
Outcome mix at maturity: upside (leveraged) 45.60% · par (principal back) 14.73% · loss 39.67% · capped at maximum 18.27%.
4. Charts
4.1 Simulation Outcomes — Product vs Underlying
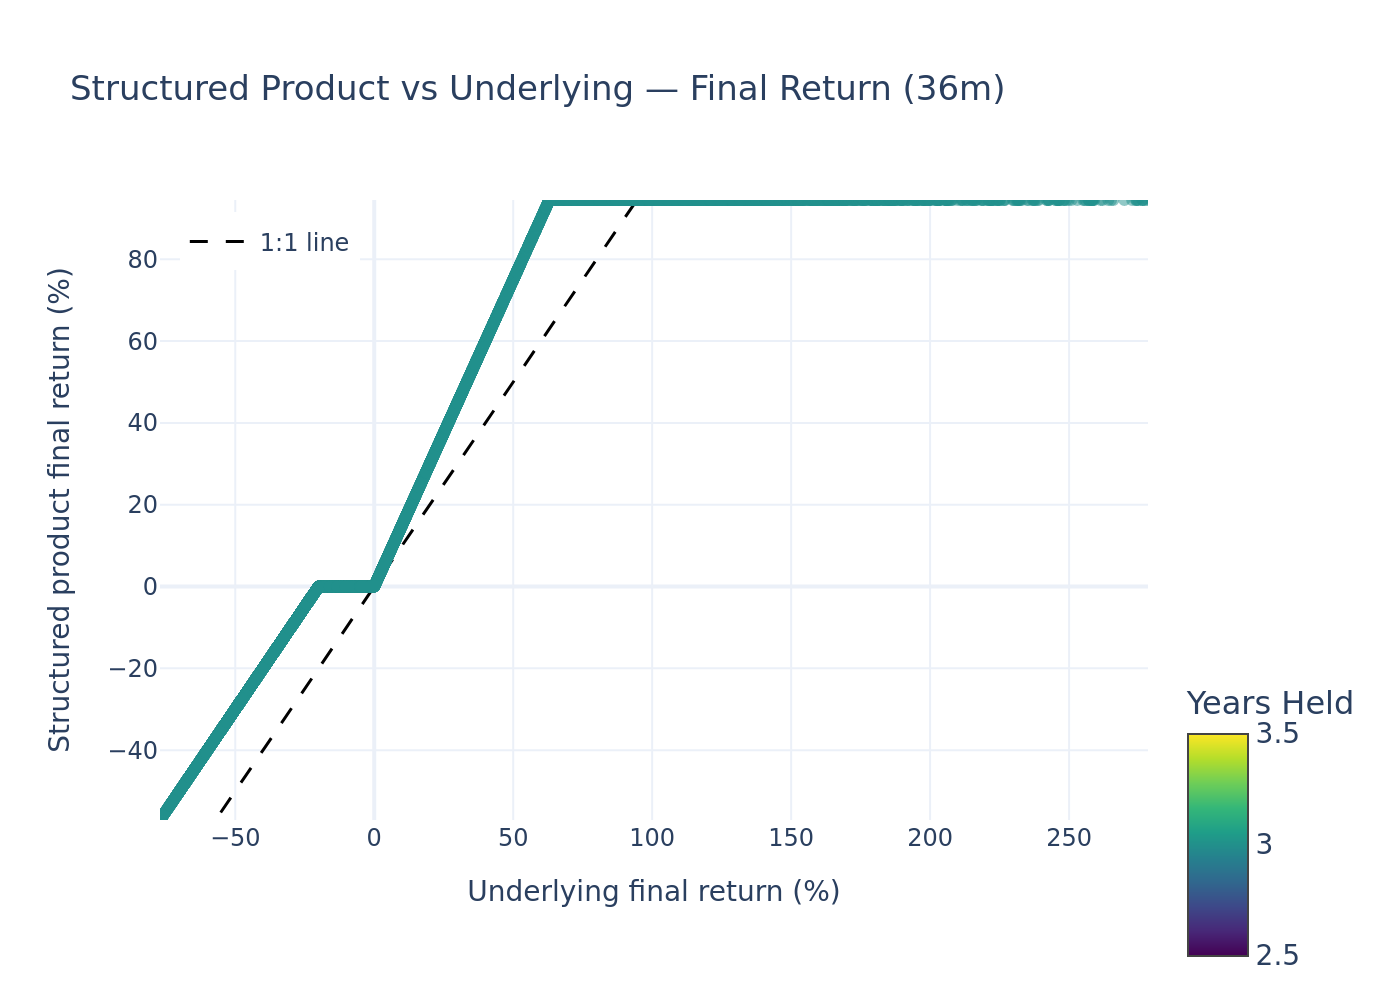
Each point is one of 10,000 simulations. The product's returns are capped near +94.5% and floored near -80%, while the underlying's distribution is far wider on both sides. Points sitting on the horizontal segment at ~0% are "par" outcomes where the buffer preserved principal.
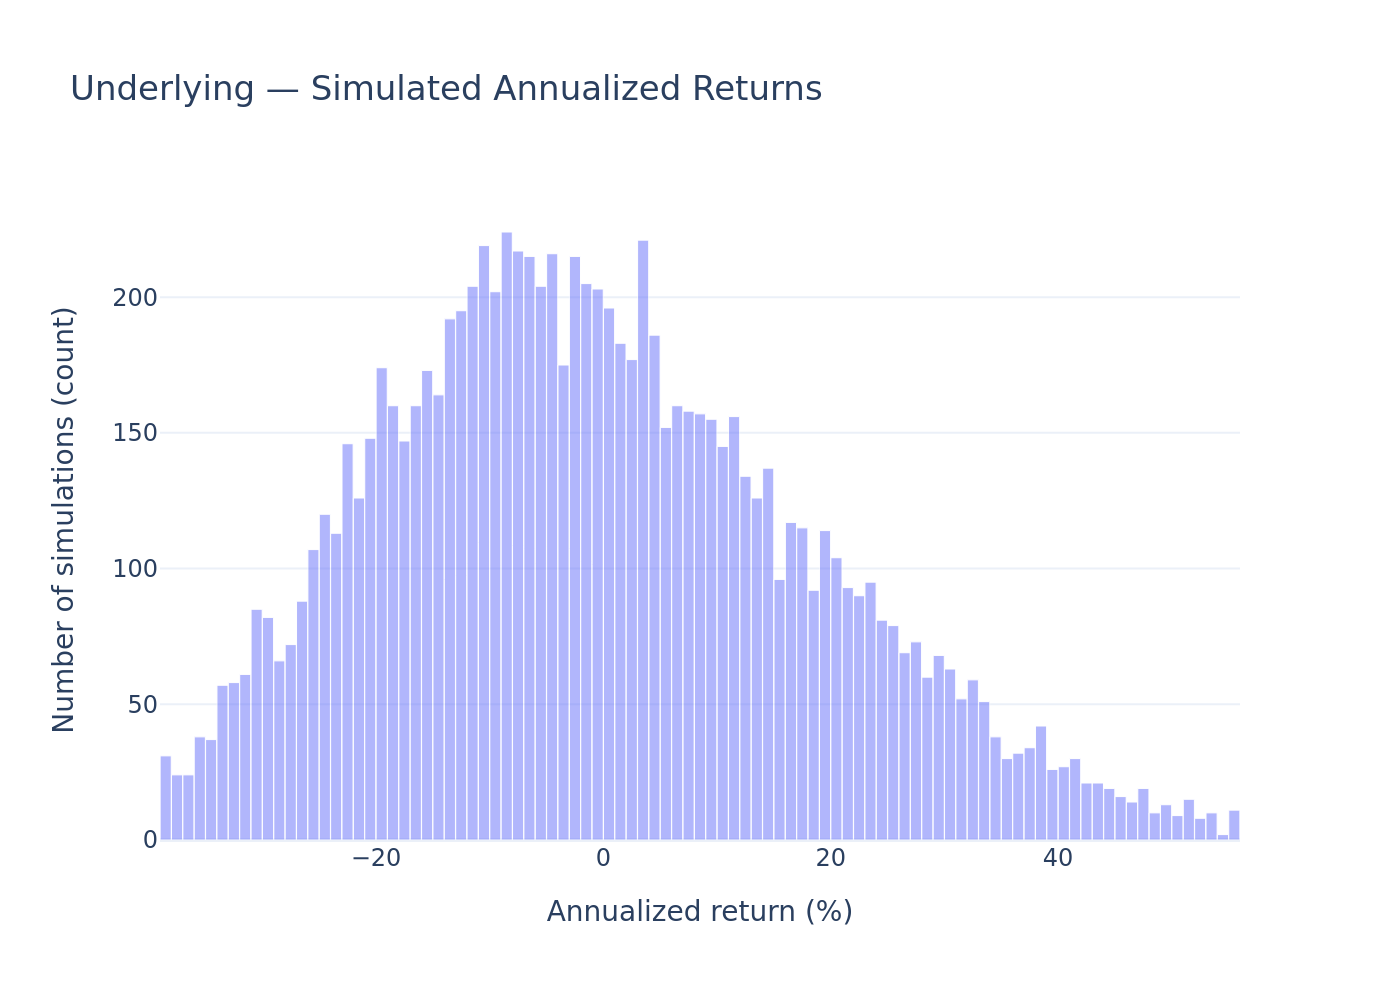
4.2 Distribution of Annualized Returns — Underlying
4.3 Distribution of Annualized Returns — Structured Product
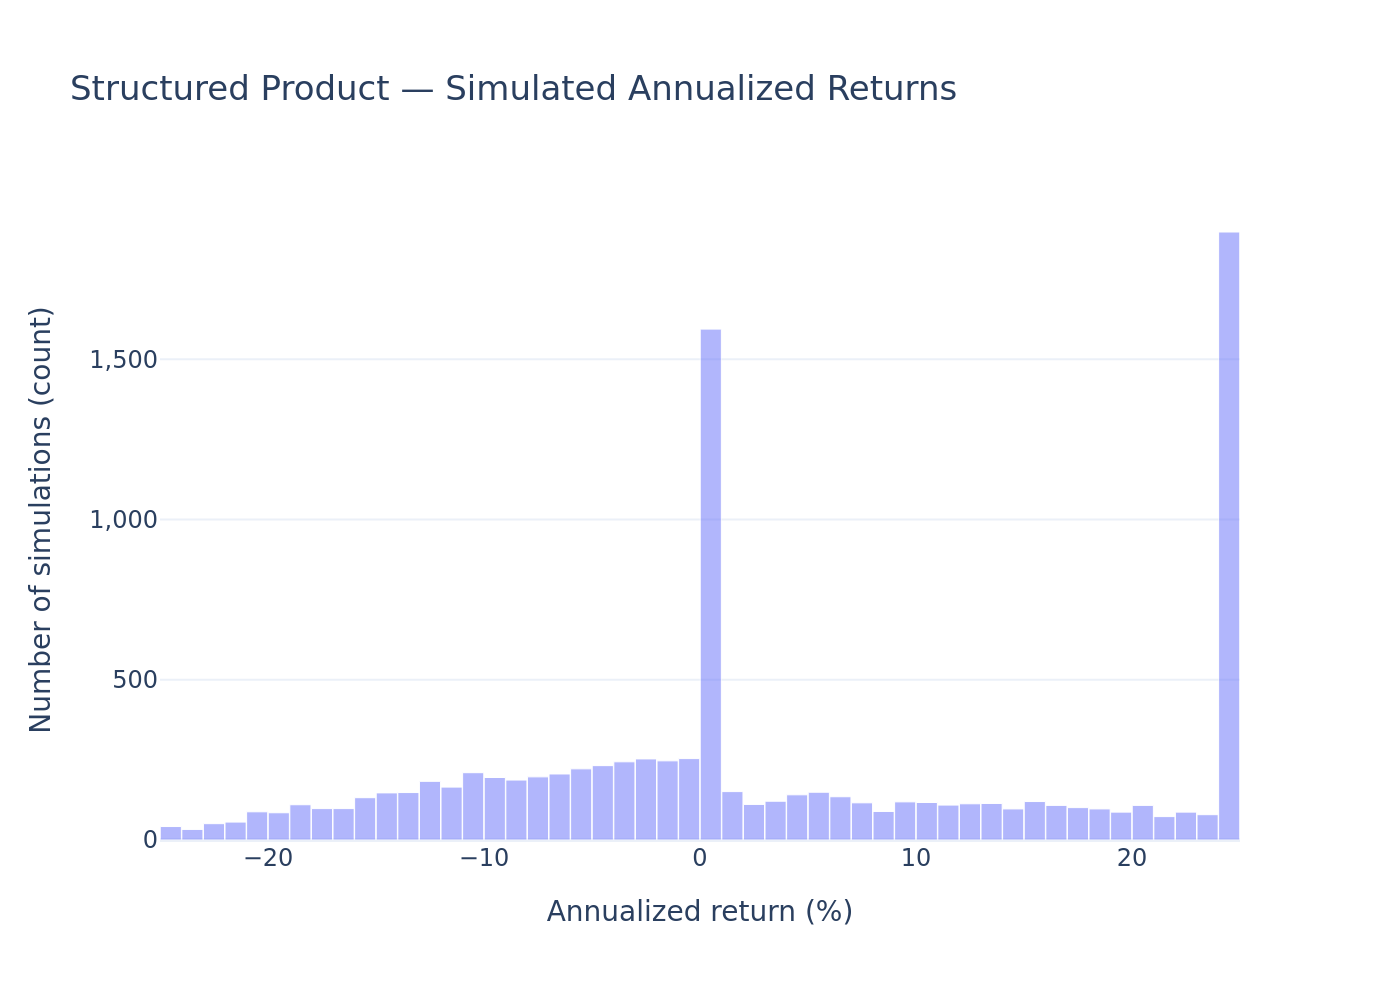
The product's return distribution is markedly narrower and shifted up relative to the underlying — the buffer truncates the deep-loss tail while the cap truncates the extreme-gain tail.
4.4 Risk / Return
4.5 Annualized Return Box Plot
4.6 Scenario Probabilities
5. Investment Commentary
Favorable characteristics
- Downside buffer: a decline of up to 20% in the underlier still returns full principal, cushioning one of the most volatile major assets.
- Leveraged upside: 150% participation in gains lets the note keep pace with a strong Bitcoin rally up to the cap.
- Defined worst case: the 20% minimum payment bounds the absolute downside (return floor of -80%).
- Favourable asymmetry in this simulation: the structure's average annualized return (~3.81%) exceeds that of holding the underlying (~-0.19%), because the buffer improves the downside more than the cap and 20% exposure hurts the upside.
Trade-offs to weigh
- Capped upside: gains are limited to +94.50% total; a very large Bitcoin rally is largely forgone.
- No income: the note pays no coupons, so there is no cash yield.
- Meaningful loss probability: roughly 4 in 10 simulated paths end with a loss, and the 1-year 99% VaR of -24.57% shows losses can be substantial once the underlier breaches the buffer.
- Credit exposure: payments depend on the creditworthiness of Morgan Stanley Finance LLC / Morgan Stanley.
6. Notes on Holding Period
The note has a fixed 3-year term with a single observation at maturity, so every simulation is held the full 36 months. Because the holding period is constant and relatively long, the annualized figures are not distorted by short-horizon extrapolation. The relevant figures are the average total return of +18.22% over the 3-year life and the average annualized (CAGR) return of +3.81%.