
Multi Barrier Reverse Convertible on Schneider Electric & Siemens Energy
Headline simulation results (10,000 Monte-Carlo paths)
| Metric | Result |
|---|---|
| Expected annualized return | 10.03% |
| Expected total return over the (variable) holding period | 7.00% |
| Expected holding period | ≈ 9.4 months |
| Probability of a negative return | 9.31% |
| 99% confidence VaR (1 year) | −41.95% |
| Expected annualized volatility | 13.32% |
The product pays a fixed 14.20% p.a. coupon (3.55% per quarter) on the EUR 1,000 denomination. The scheduled coupons are paid in any case (subject only to early redemption) — the risk is to the return of capital, not to the coupons themselves. In 90.7% of simulated paths the investor ends with a positive return (an annualized return of +14.20% per path); in 9.31% of paths a steep fall in the worst-performing share cuts the redemption amount enough to more than offset the coupons, producing a negative total return. The headline coupon rate therefore overstates the average outcome: the expected annualized return is 10.03%, and the tail is material (99% VaR of −41.95%).
At a glance
- Issuer: Basler Kantonalbank (S&P AA+ / Fitch AAA) · Listed on SIX Swiss Exchange
- Denomination: EUR 1,000 · Issue price: 100% · Settlement currency: EUR
- Underlyings (worst-of): Schneider Electric SE (Euronext Paris) and Siemens Energy AG (Xetra)
- Coupon: 14.20% p.a., paid quarterly (EUR 35.50 / quarter)
- Barrier: 55% of the initial level, continuously observed
- Strike: 100% of the initial level
- Issuer callable: yes — observation on 19/04/2027 & 19/07/2027 (redemption 26/04/2027 & 26/07/2027)
- Maximum term: 12 months (final fixing 18/10/2027)
How it works (in plain terms)
- You are paid a high 14.20% annual coupon. The scheduled coupons are paid in any case unless the note is redeemed early — a bad share performance does not cancel them. Your real exposure is to whether you get all of your capital back.
- A 55% barrier provides conditional protection. As long as neither Schneider Electric nor Siemens Energy ever trades at or below 55% of its starting level during the product's life, you get your full EUR 1,000 back at maturity, plus all coupons.
- If the barrier is breached, the “worst-of” rule bites. The redemption is then linked to the weaker of the two shares: if that worst share ends below its starting level, capital is reduced one-for-one with its decline (delivery of the worst-performing share); if it ends at or above its starting level, EUR 1,000 is still returned. The scheduled coupons continue to be paid on top.
- The issuer can redeem early. At two observation dates the issuer may call the note and return 100% plus the coupon then due — capping the life of the trade at 6 or 9 months.
- Upside is capped. There is no participation in share gains beyond the coupon: the best possible total return is the coupon stream (14.20%).
Key statistics — product vs. underlying basket
The benchmark is an equal-weight basket of the two underlyings (Schneider Electric + Siemens Energy), the natural reference for a worst-of structure.
| Metric | Structured product | Underlying basket (price) | Underlying basket (total return) |
|---|---|---|---|
| Expected annualized return | 10.03% | 15.43% | 16.50% |
| Expected annualized volatility | 13.32% | 34.33% | 34.33% |
| Probability of loss | 9.31% | 35.46% | 34.40% |
| 99% VaR (1 year) | −41.95% | −44.23% | −43.16% |
Total return adds the basket dividend yield of ≈1.07% to the price return (no compounding).
Interpretation. The structure cuts volatility by roughly 60% (13.3% vs. 34.3%) and reduces the probability of a loss from ~35% to ~9%, at the cost of giving up most of the upside: the expected annualized return (10.03%) is below the basket's total-return expectation (16.50%). The trade is therefore a classic yield-enhancement profile — you sell the basket's upside to buy a high coupon and partial downside protection.
Product return vs. underlying basket return
Each point is one simulation; the diagonal is the 1:1 line.
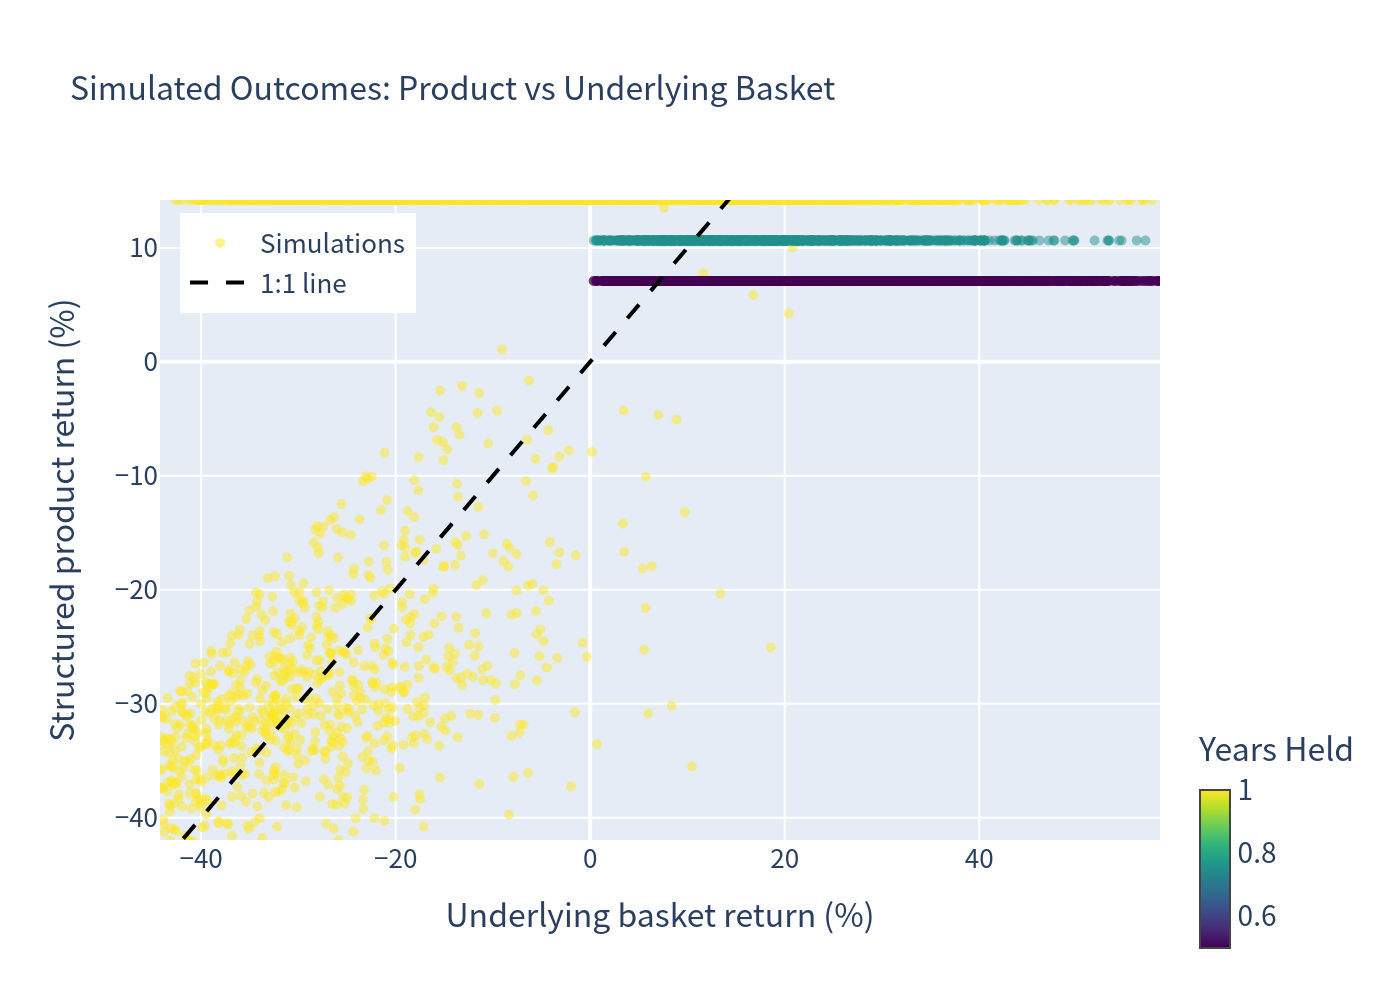
Points hugging the top are paths that were called early or finished above the strike (product return capped near +14%); the cluster below the diagonal on the left shows paths where the basket fell sharply and the product's redemption de-levered enough to turn the total return negative.
Return distributions
Structured product — distribution of returns
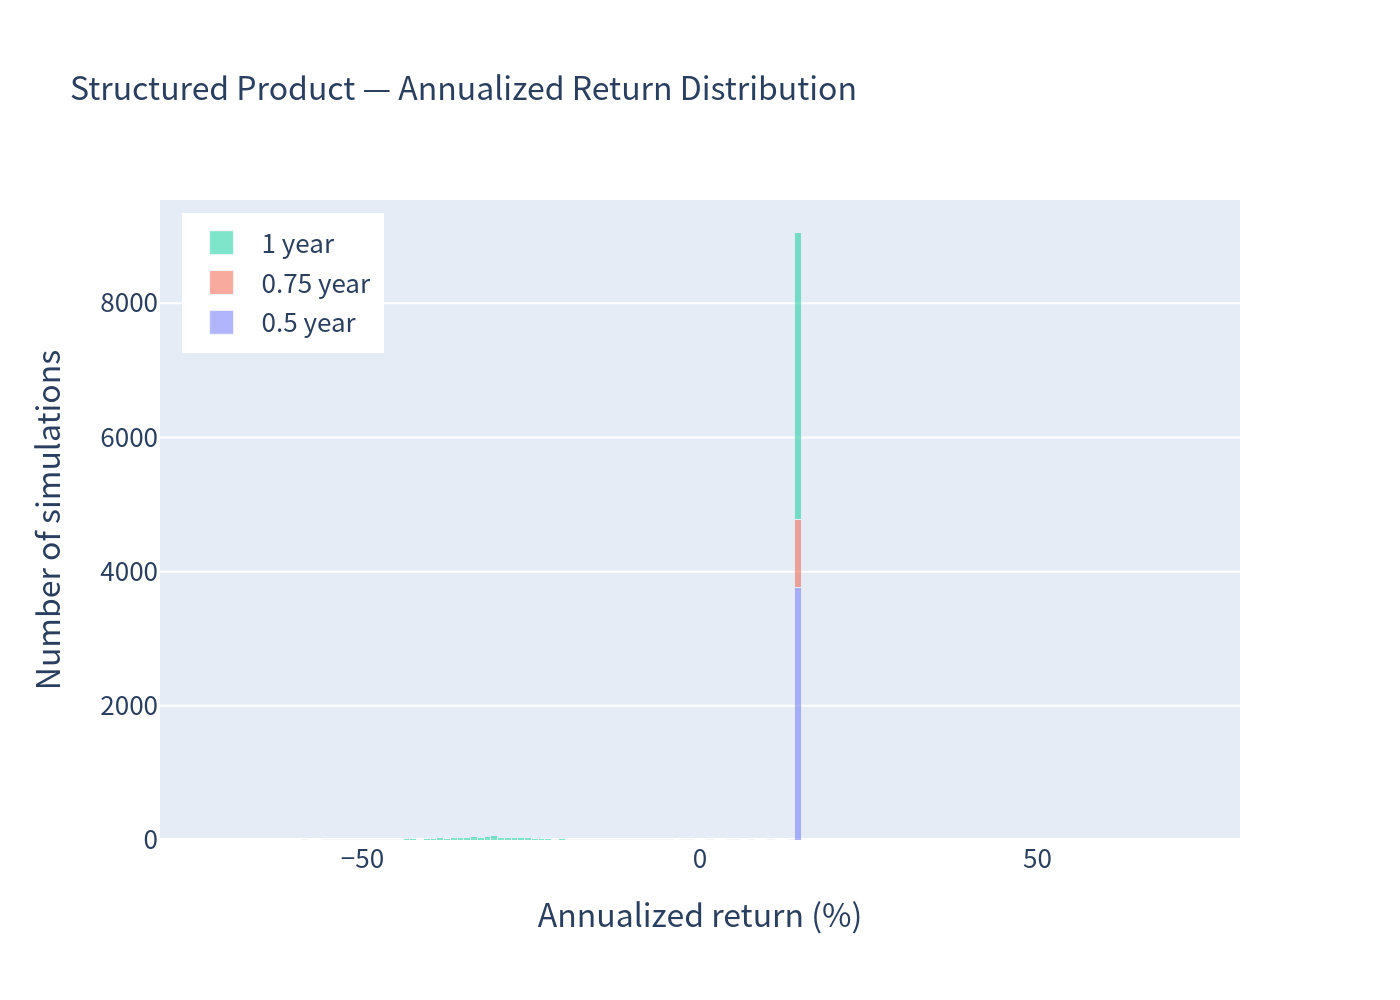
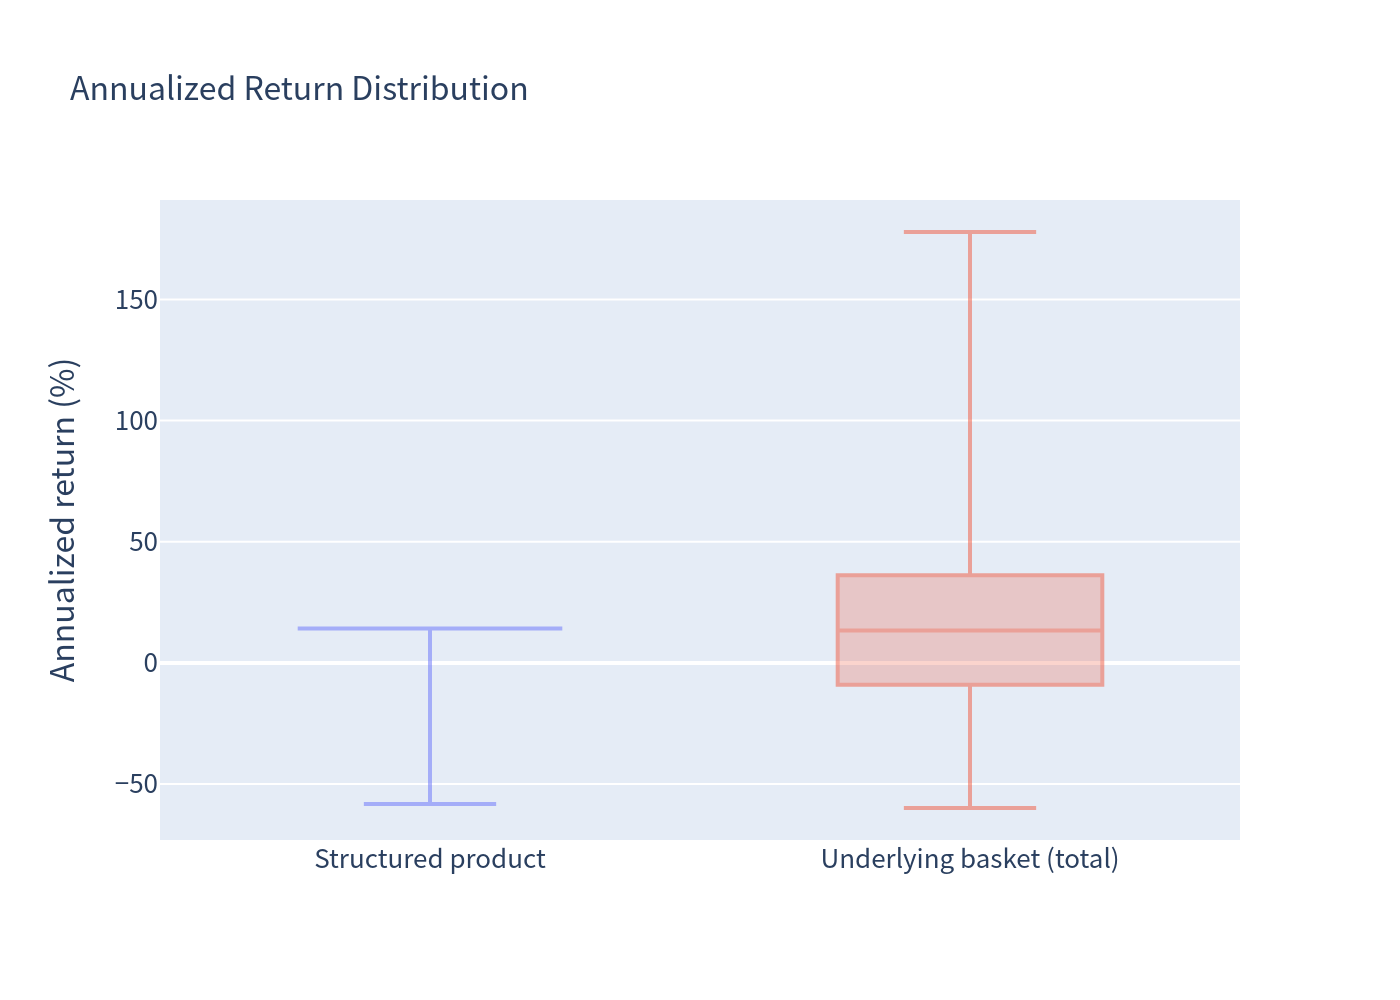
The product's returns are strongly two-peaked: a large spike at about +14% (the full coupon, whether the note is called early or runs to maturity) and a long left tail down to roughly −60% when a barrier breach combines with a deep sub-strike finish. Colour shows how long the trade was held.
Underlying basket — distribution of returns
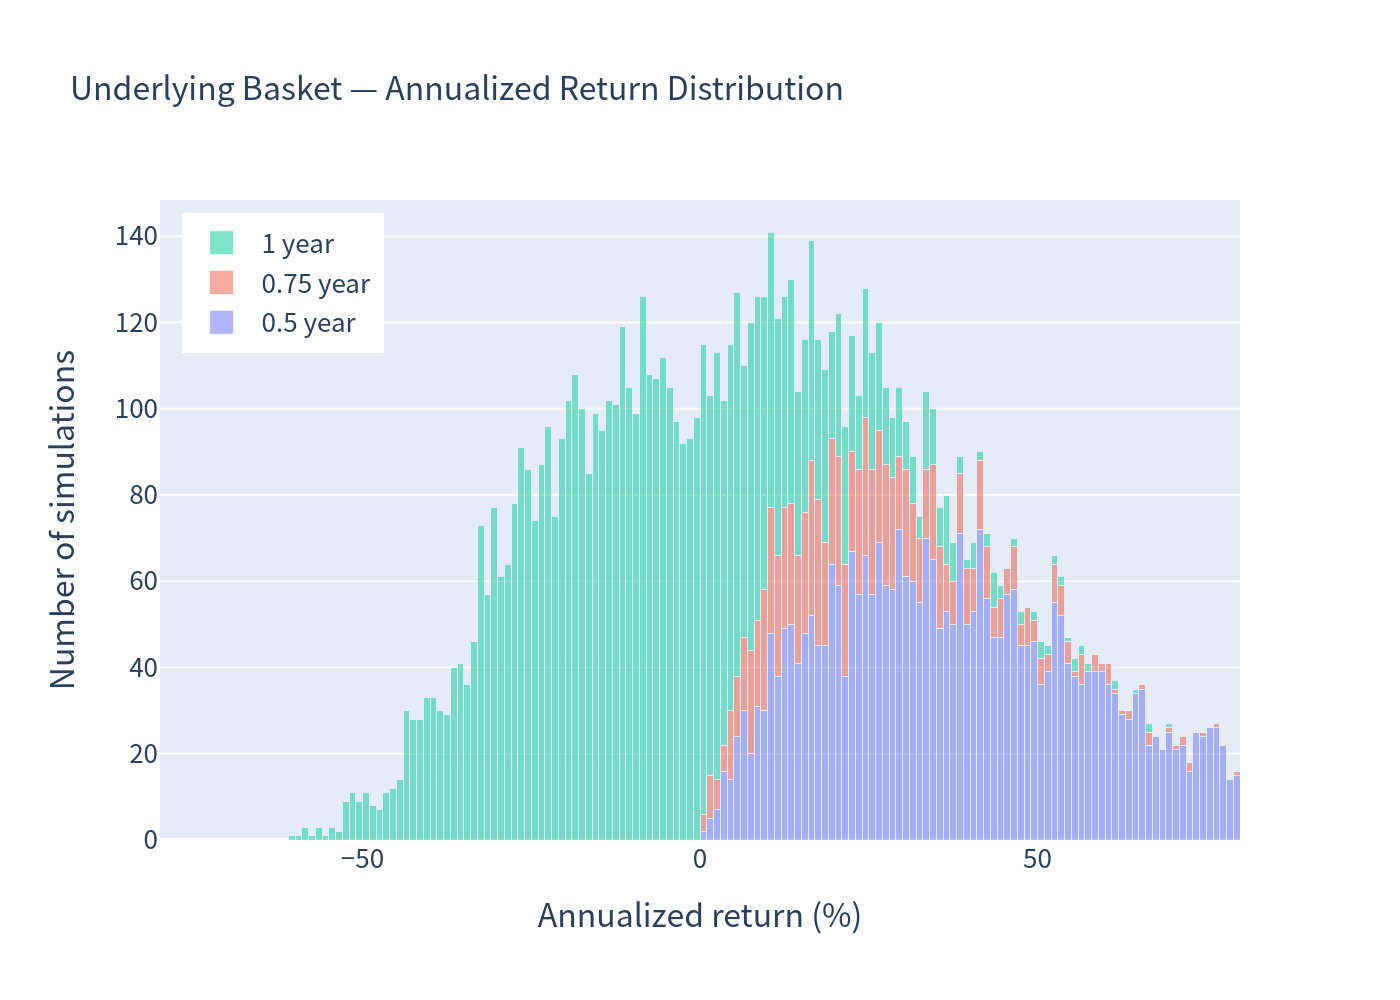
The basket's distribution is far wider and roughly centred near +15% annualized, with a much fatter loss region — highlighting the risk the product is designed to blunt.
Risk / return and scenario probabilities
Risk / return positioning
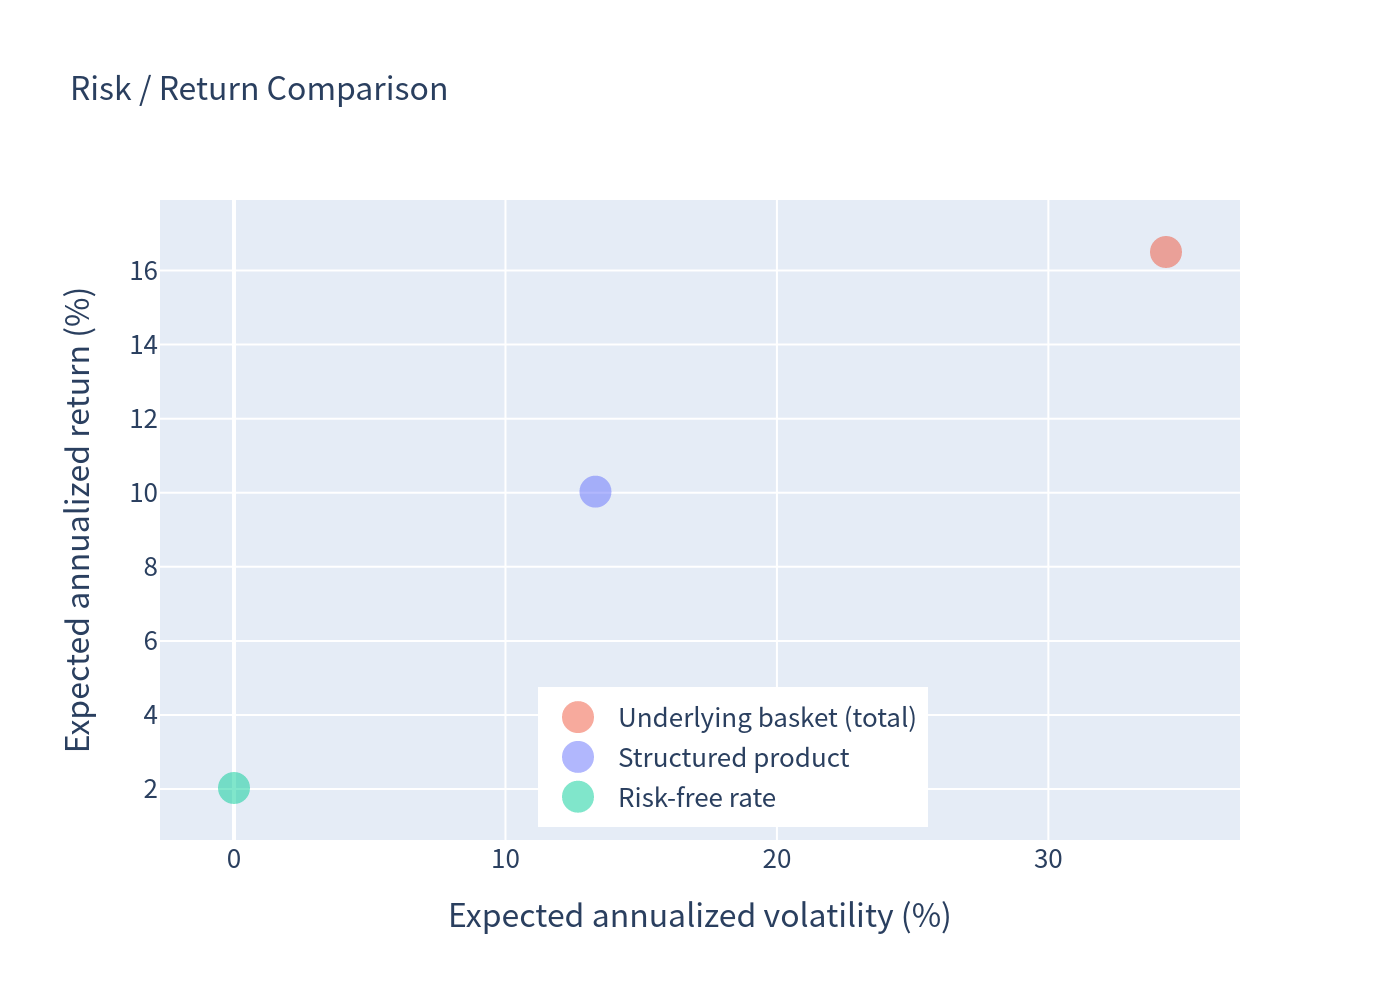
The product sits at a much lower volatility than the basket, with an expected return below the basket but well above cash.
Scenario probabilities
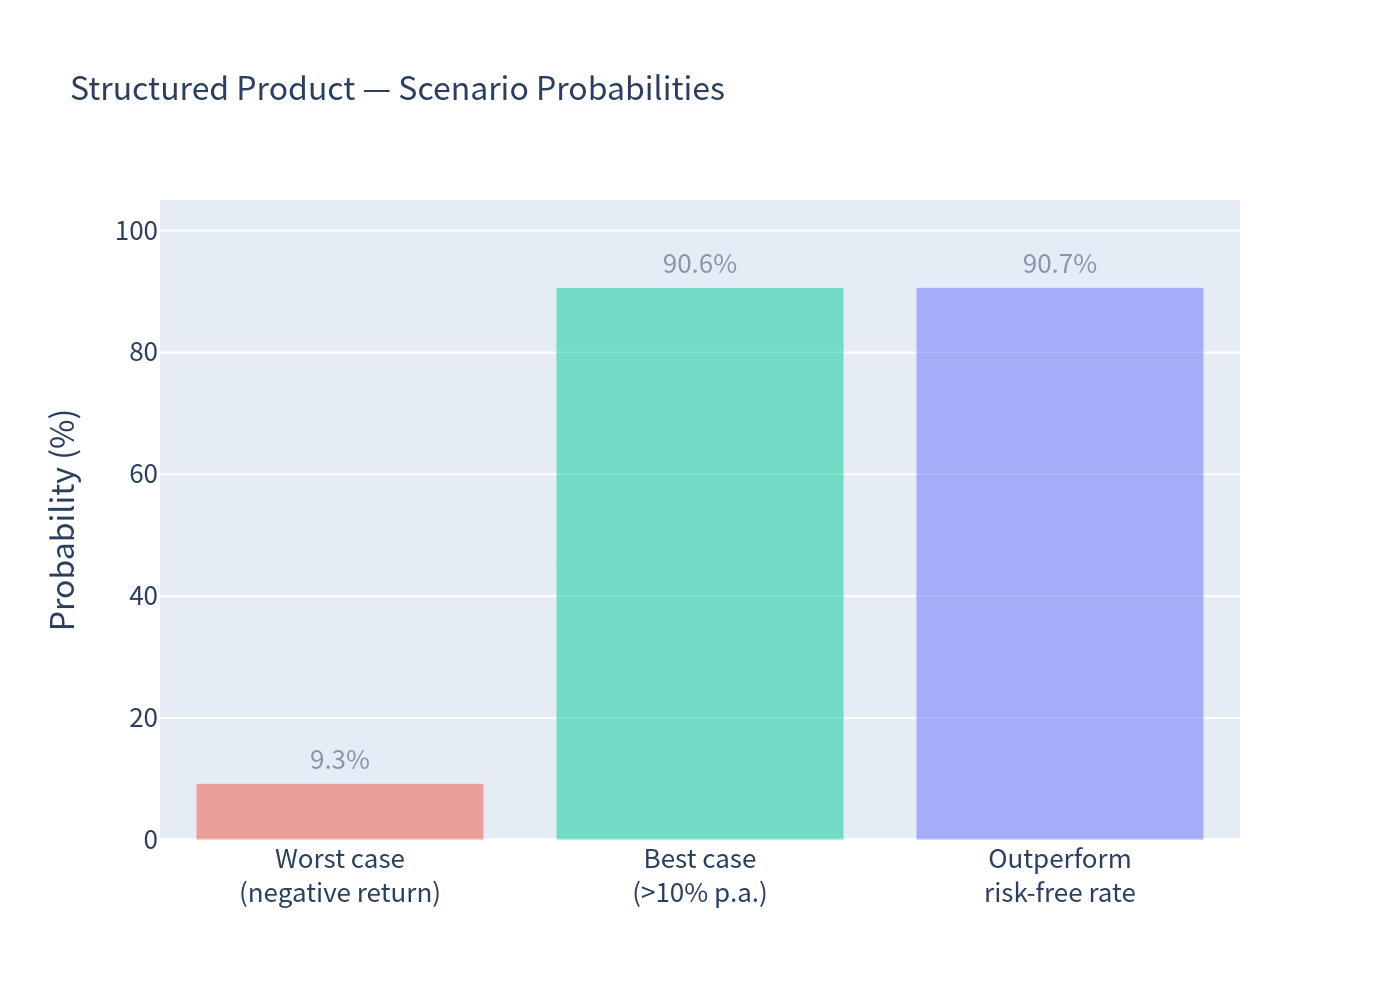
- Outperform the risk-free rate (2.03%): ≈ 90.68%
- Best case (>10% p.a.): ≈ 90.65%
- Negative return (worst case): ≈ 9.31%
Distribution of outcomes (boxplot)
Holding period & coupons
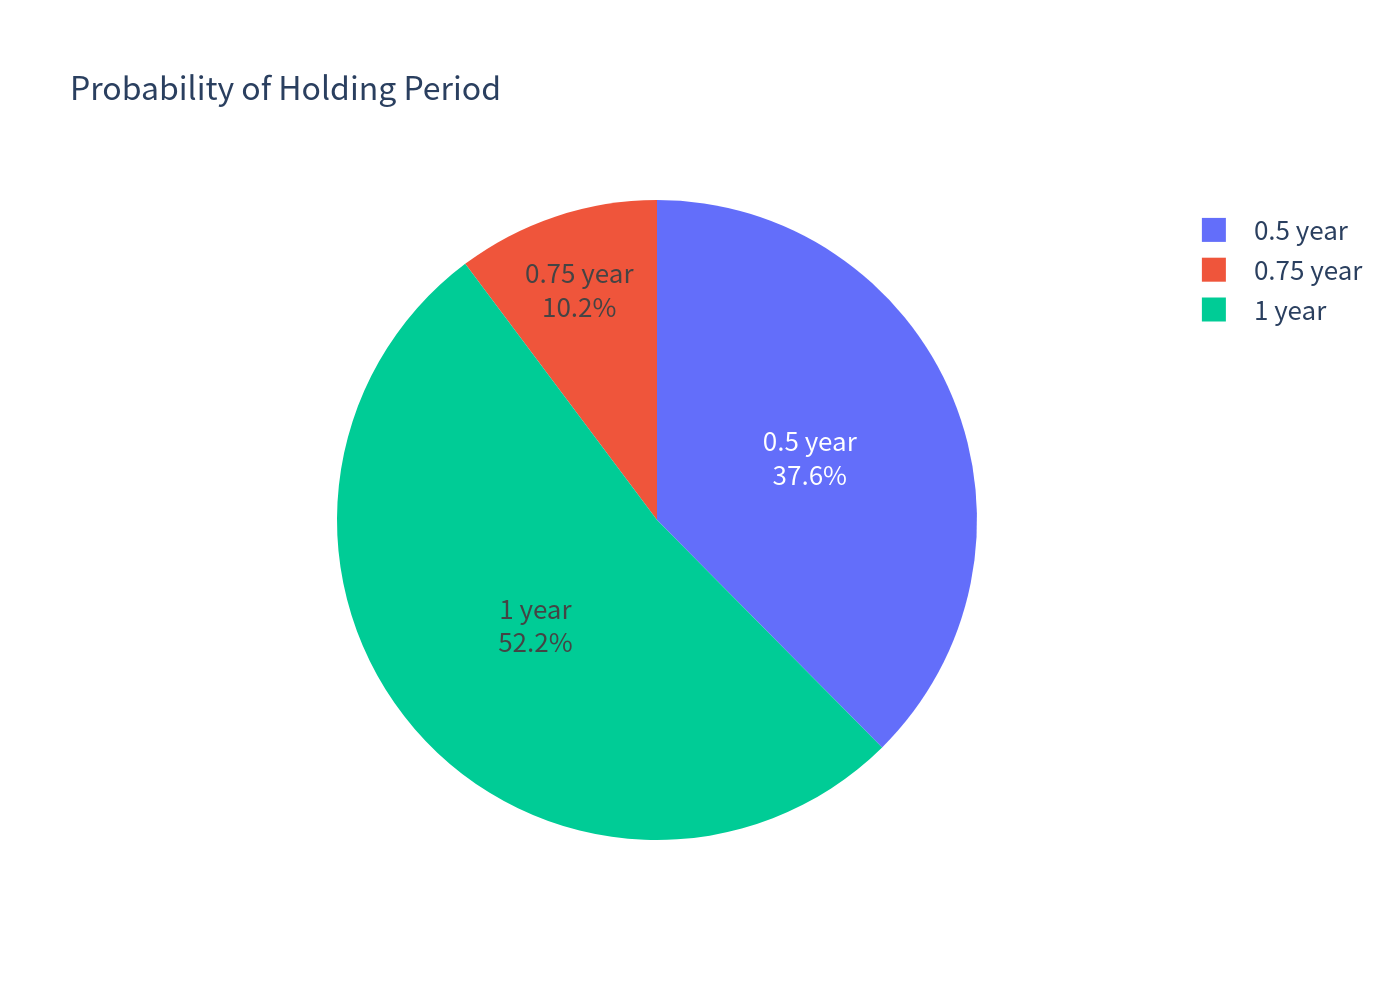
Because the note is callable, it is not always held to maturity:
- 6 months (called): 37.58%
- 9 months (called): 10.23%
- 12 months (maturity): 52.19%
Holding period distribution
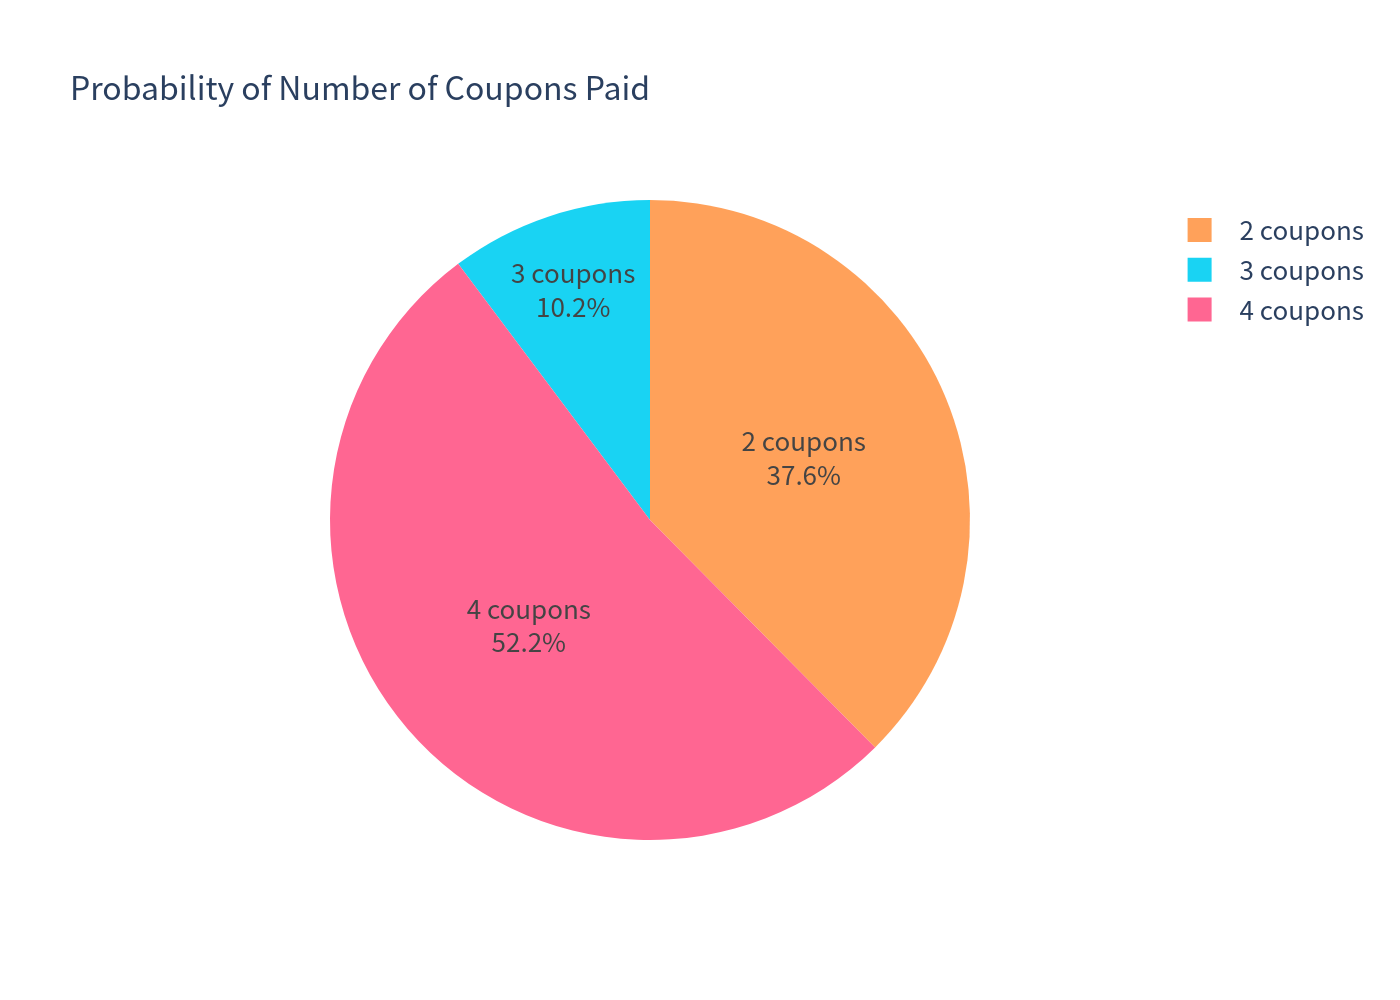
The number of quarterly coupons received follows the same pattern — 2 coupons (6m), 3 coupons (9m) or 4 coupons (12m). Only the ~52% of paths that reach maturity receive all four scheduled coupons; early-called paths receive two or three, but in every path the coupons that are due are paid in full:
Coupon count distribution
Note on holding-period effects. Roughly 48% of paths end before 12 months, so annualized figures for those paths are the short holding-period return scaled up (e.g. a 7.10% six-month return annualizes to ~14.2%). The expected total return of 7.00% over an average holding period of ≈9.4 months should be read alongside the annualized figure of 10.03%. The 90.7% “positive return” probability refers to the sign of the return, not to receiving the maximum number of coupons.
Investment commentary
Points in favour
- A high 14.20% p.a. coupon for a structure with a comparatively low expected volatility (~13%).
- A 55% barrier with conditional protection: in about 9 of 10 paths the investor ends with a positive return and, in the large majority of those, principal is repaid at par.
- Coupons are not contingent on performance — they are paid regardless of share moves (subject only to early redemption).
- Worst-of construction on two high-quality European industrials, with the coupon compensating for the additional worst-of risk.
- A defined, short maximum term (12 months) and two possible early-redemption dates.
Points to weigh
- Capped upside: total return cannot exceed the coupon (14.20%); the investor forgoes all share appreciation.
- Worst-of exposure: the payoff is driven by the weaker of Schneider Electric and Siemens Energy, which increases the chance of a barrier breach versus a single-name note.
- Material tail risk: with the barrier at 55% and no protection below it, the 99% VaR is −41.95%; the worst simulated outcome was about −58%. Capital is genuinely at risk.
- Issuer credit risk: returns depend on Basler Kantonalbank's ability to pay.
- Early call risk: if the shares rally, the note is likely to be called at 6 or 9 months, capping the number of coupons received.
This analysis is a quantitative evaluation of the product's risk/return profile based on simulated outcomes and is not investment advice or a suitability assessment.