
Morgan Stanley Market-Linked Notes due April 3, 2031 — Structured Product Analysis
Headline Simulation Results
| Metric | Structured Product | Benchmark (EURO STOXX 50 Total Return) |
|---|---|---|
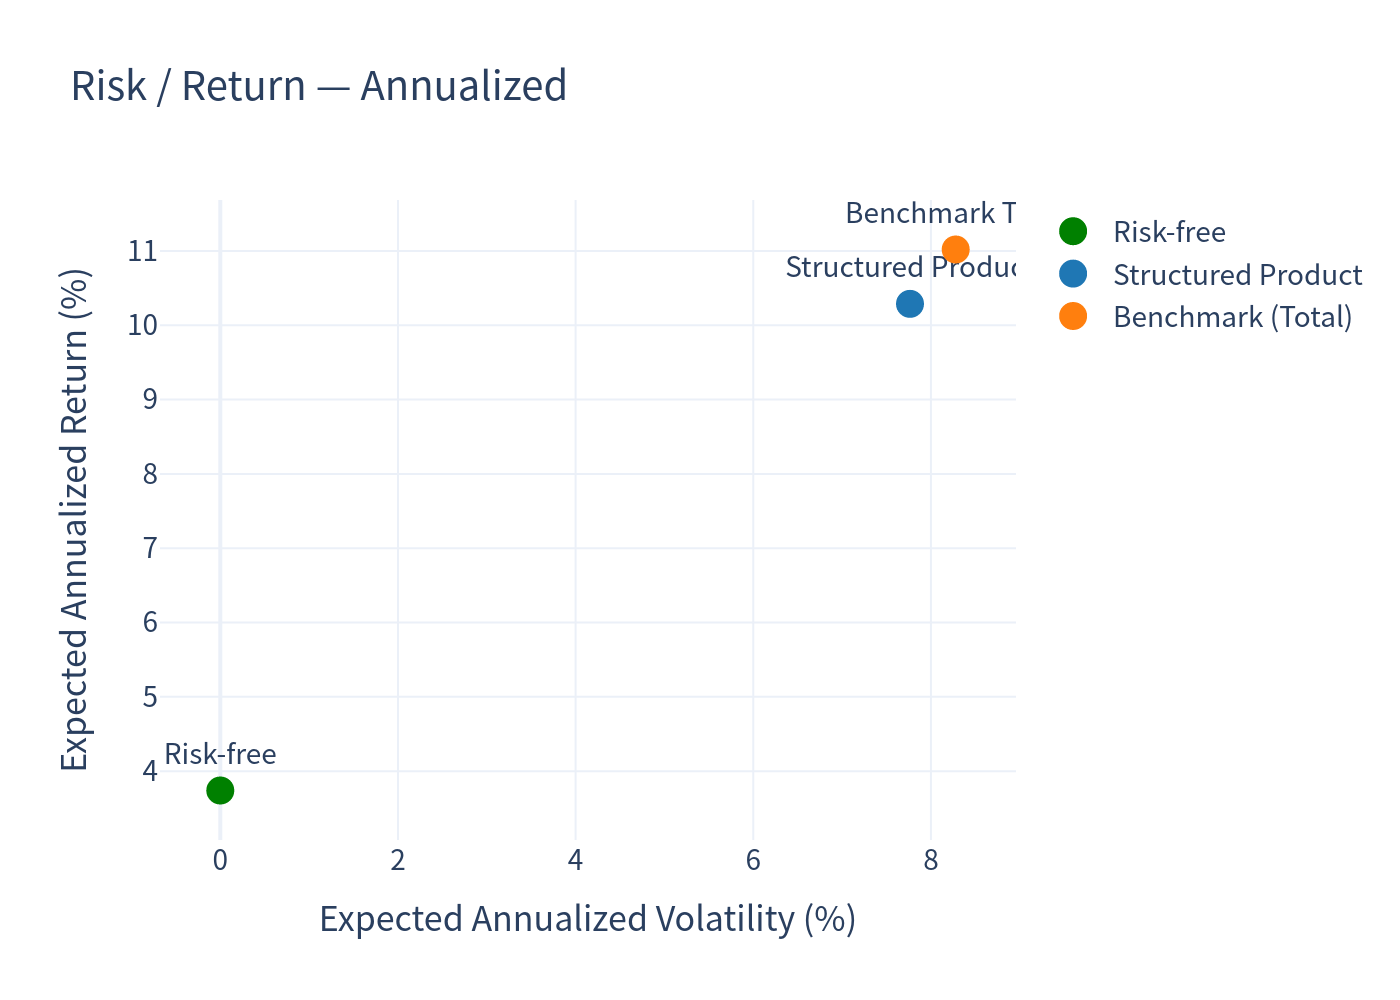
| Expected annualized return | 10.29% | 11.02% |
| Probability of negative return | 0.00% | 9.50% |
| 99% confidence VaR (1-year, annualized) | 0.00% | −9.29% |
| Expected annualized volatility | 7.76% | 8.28% |
| Probability of outperforming the risk-free rate (3.74%) | 74.50% | — |
The notes are principal protected, so no simulation produces a negative return: the worst outcome is the return of the $1,000 stated principal (a 0.00% total return).
Over the full 5-year term the expected total return (the average of the per-simulation 5-year returns) is 71.54% for the product versus 59.13% for the price-only index. Note that the expected annualized return (10.29%) is the average of the per-simulation annualized (CAGR) figures, which is lower than the annualization of the average total return (11.40%) because of volatility drag — the two measures are calculated differently and need not reconcile arithmetically.
1. How the Notes Work (Plain-Language)
These are 5-year notes linked to the EURO STOXX 50® Index that pay no interest. Instead, at maturity (April 3, 2031) the payout depends entirely on the index level on the observation date compared with its starting level:
- If the index finishes higher: you receive your full principal plus 115% of the index's gain (the participation rate may be set between 115% and 125% at pricing; 115% is used here as the conservative base case).
- If the index finishes flat or lower: you receive only your original principal — you do not lose money, but you earn nothing.
There are no coupons, no early-redemption (autocall) features, and no barrier. The only cash flow occurs at maturity. In effect, the note combines a return-of-principal bond with a leveraged call option on the index, participating on the upside while fully shielding the downside.
Illustrative examples (per note of $1,000)
- Index +10% → you receive $1,115 (111.50% of principal).
- Index −15% → you receive $1,000 (par).
2. Key Statistics
| Strategy | Expected Ann. Return | Expected Ann. Volatility | Probability of Loss | 99% VaR (1y, ann.) |
|---|---|---|---|---|
| Structured Product | 10.29% | 7.76% | 0.00% | 0.00% |
| EURO STOXX 50 (price only) | 8.51% | 8.28% | 14.91% | −11.80% |
| Benchmark total (price + dividends) | 11.02% | 8.28% | 9.50% | −9.29% |
| Risk-free rate | 3.74% | 0.00% | — | — |
- Expectation is that the index finishes above its initial level in 85.09% of simulations.
- Because the payoff is leveraged (115%) and downside-protected, the product captures a higher expected return than the price-only index (10.29% vs 8.51%) with lower volatility (7.76% vs 8.28%).
- Once index dividends are included, the benchmark's expected annualized total return rises to 11.02%, marginally above the product — the trade-off for the product's full downside protection.
Scenario Probabilities
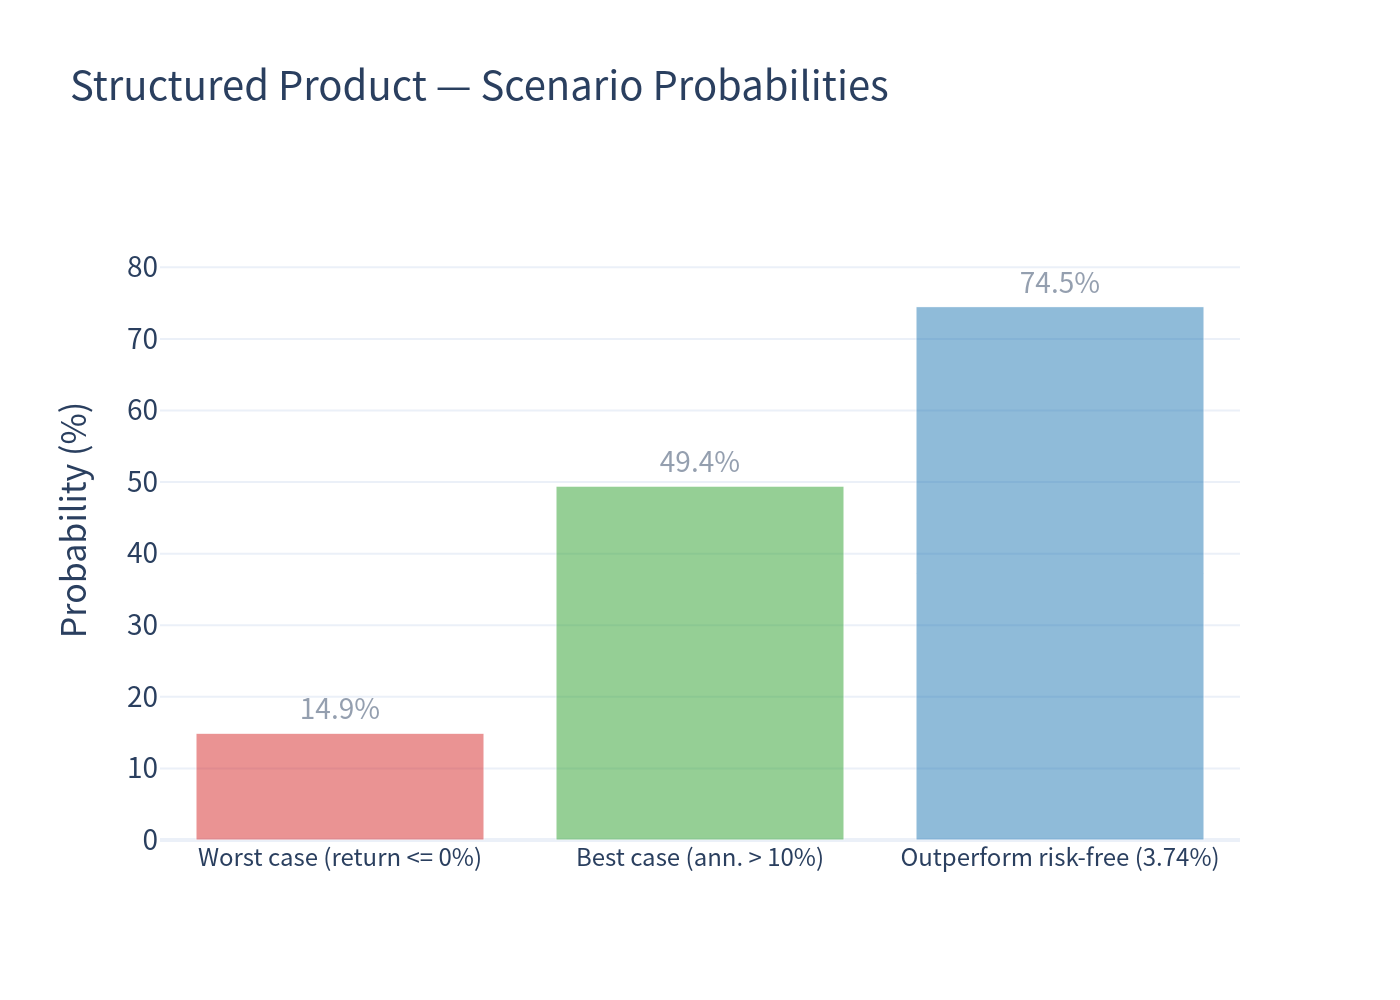
- Worst case (return ≤ 0%): 14.91% — the percentage of paths where the index ends flat or down and only principal is returned.
- Best case (annualized return > 10%): 49.43%.
- Outperform the risk-free rate (3.74%): 74.50%.
3. Charts
3.1 Simulation Outcomes — Product vs Underlying
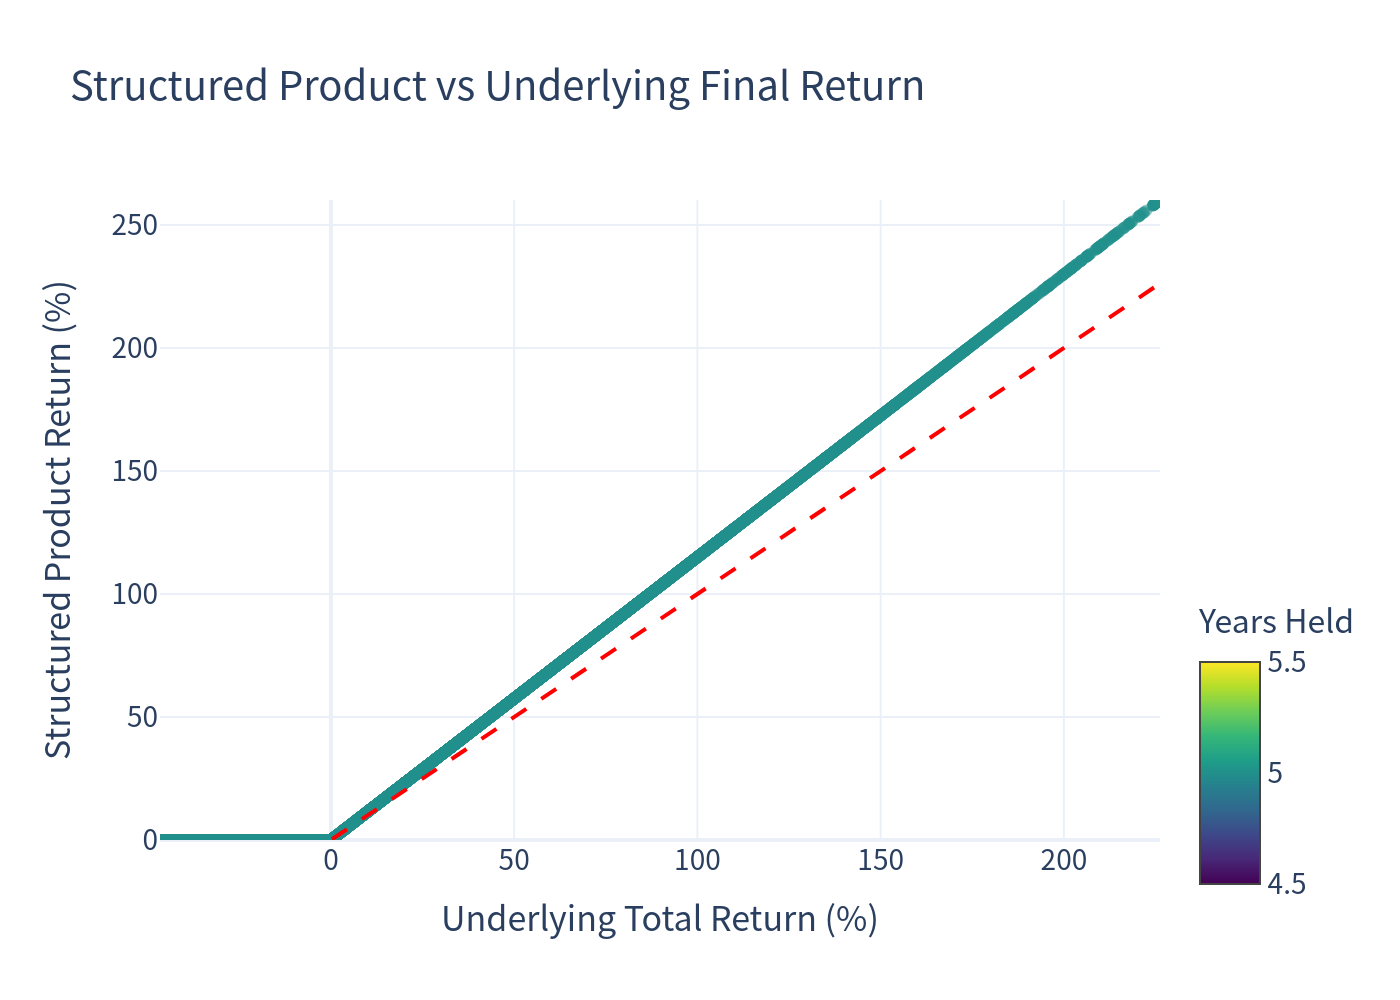
Above the 45° line (dashed), the leveraged participation makes the product outperform the index; below the horizontal floor at 0%, the product is protected from index losses. Points on the floor correspond to the ~14.91% of paths that end flat or down.
3.2 Distribution of Simulated Annualized Returns
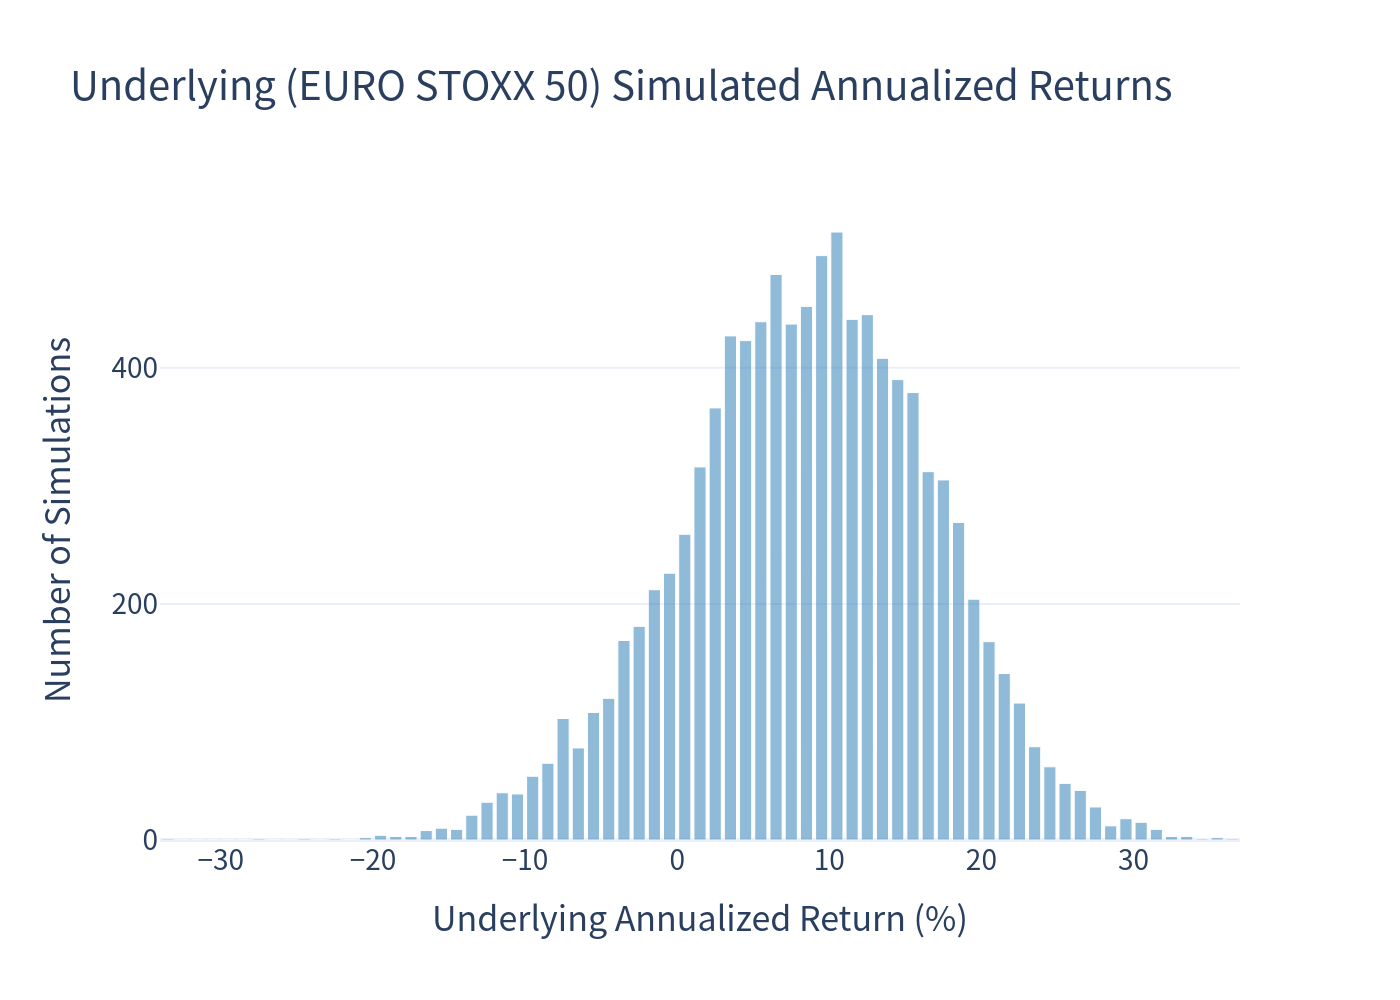
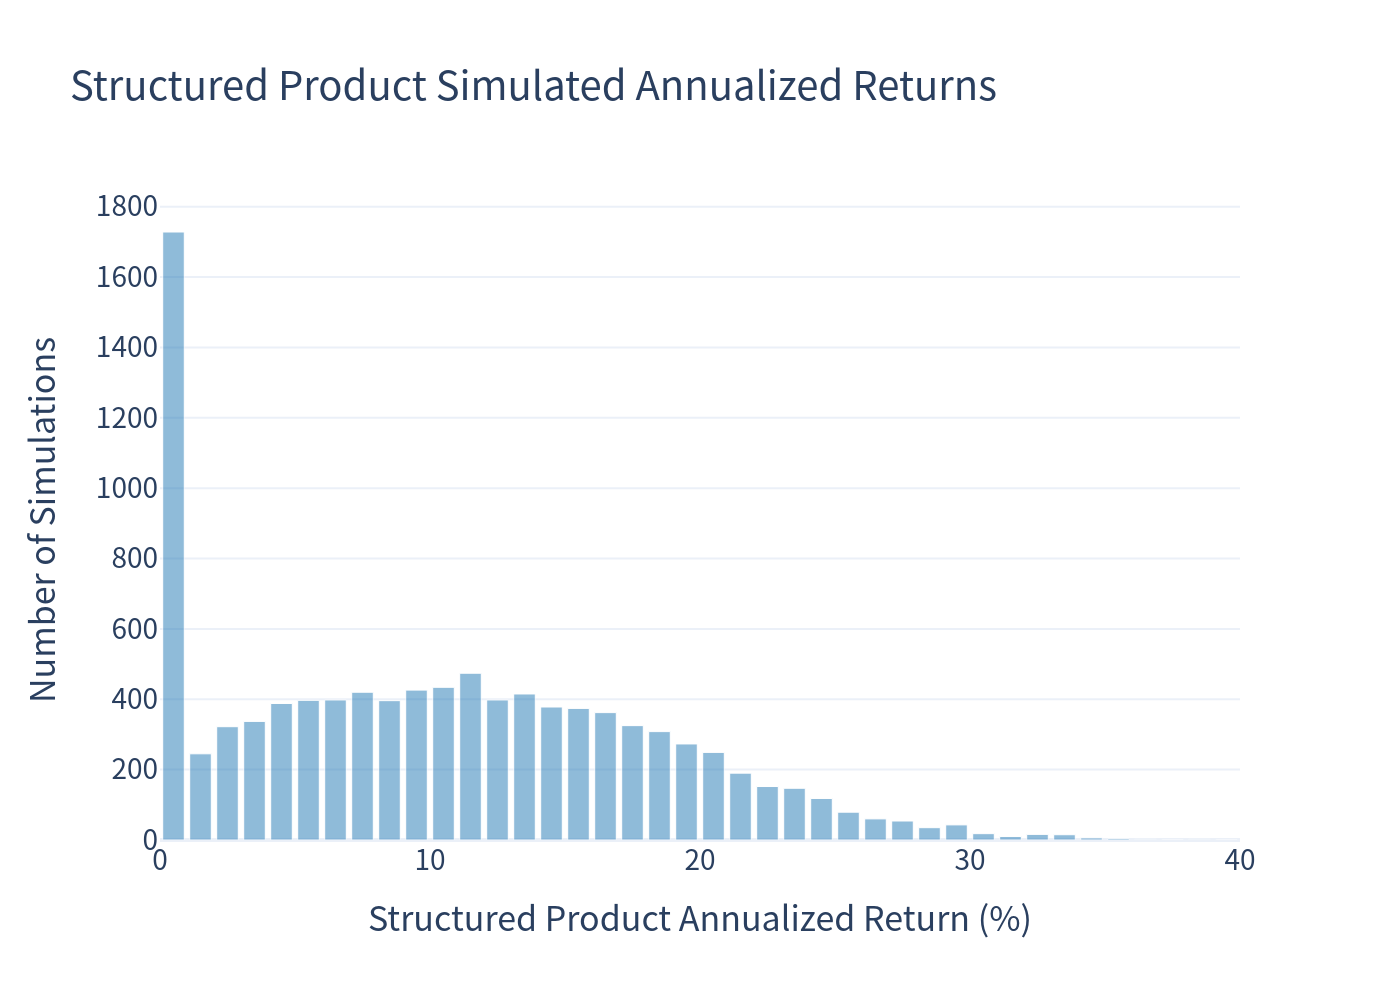
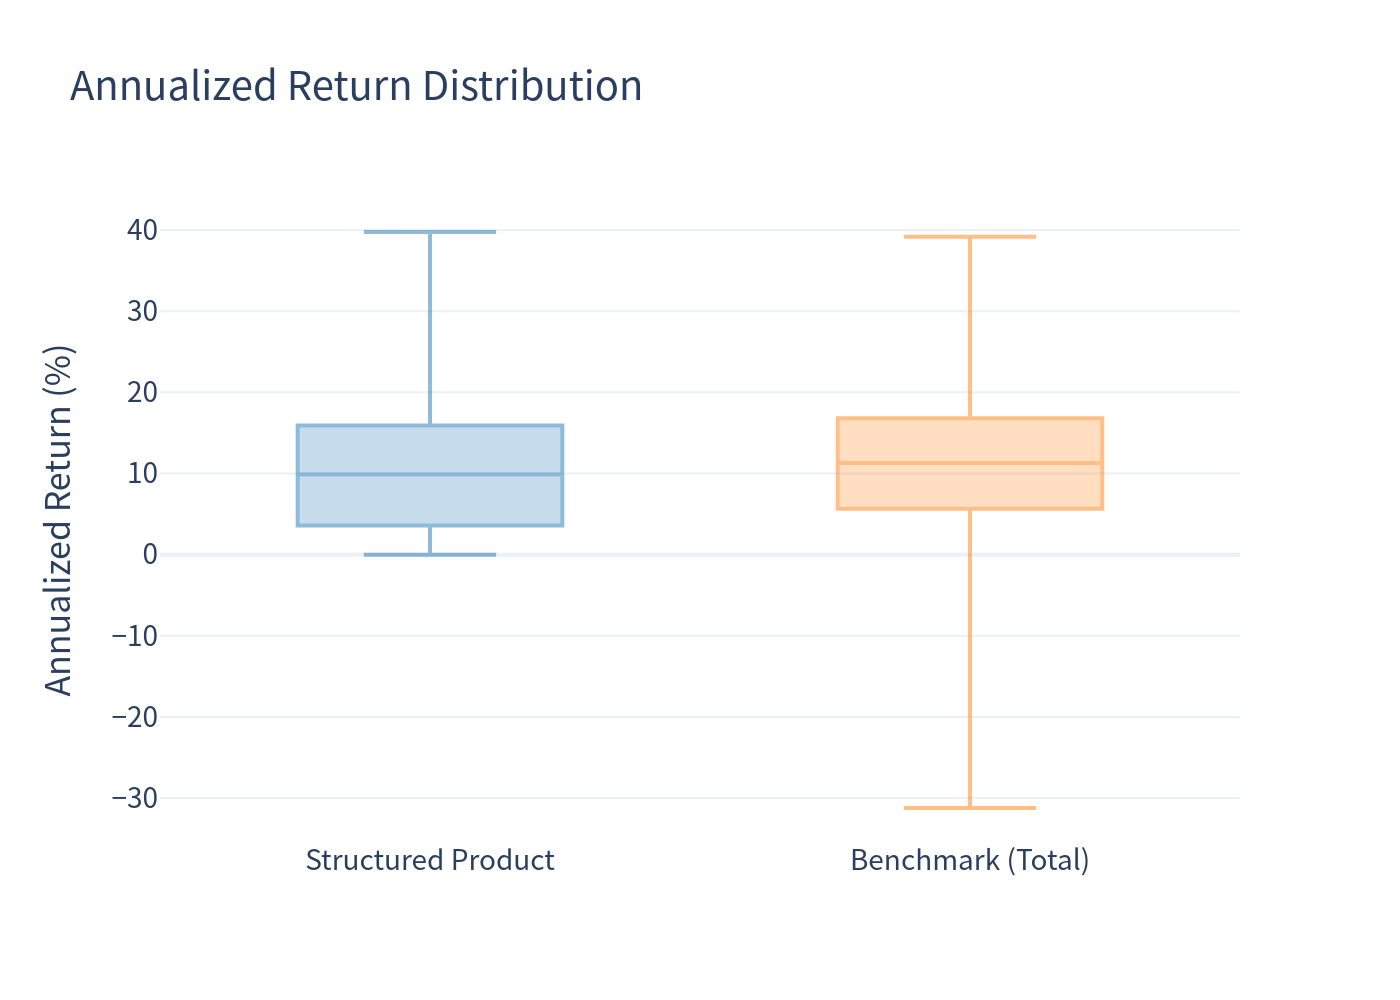
The underlying can produce meaningful losses — its 1st-percentile annualized return is −11.80%, and the single most extreme simulated path reaches about −34% — whereas the product's distribution is truncated at 0% and skewed to the right by the 115% participation.
3.3 Scenario Probabilities
3.4 Risk / Return Profile
3.5 Annualized Return Distribution (Box Plot)
4. Holding Period
The notes have a fixed 5-year (60-month) term — every simulated path is held to maturity, with no autocall or early redemption. There is therefore no variation in holding period and no holding-period or coupon-frequency pie charts to report. All annualized figures are compounded over the full 60 months.
5. Investment Commentary
Potential advantages
- Full principal protection: the worst simulated outcome is the return of principal; the 1-year 99% VaR is 0.00%.
- Leveraged upside: participation of 115% (potentially up to 125%) amplifies index gains with no cap.
- Favourable risk/return vs the price index: higher expected return and lower volatility than holding the index outright, since the payoff is convex.
- High odds of beating cash: the product outperforms the risk-free rate in 74.50% of simulations.
Points to consider
- No income: the notes pay no interest; if the index is flat or down you simply get your money back, with no compensation for five years of forgone interest or inflation.
- Opportunity cost vs the total-return benchmark: including dividends, the index's expected total return (11.02%) slightly exceeds the product's (10.29%); the protection is "paid for" out of the dividend stream.
- Binary participation: gains only accrue if the index finishes above its starting level on the single observation date; interim rallies are irrelevant.
- Single-date exposure: the payoff depends solely on the index level on March 31, 2031 — a single observation, not an average.
- Credit risk: payments depend on the issuer/guarantor, and the estimated issue-date value (~$960.40) is below the $1,000 issue price.
Simulation-based estimates from 10,000 Monte Carlo paths calibrated to the underlier's historical volatility with a risk premium of 6.00% and a risk-free rate of 3.74%. Figures are illustrative, not forecasts or investment advice.