
12.00% p.a. Multi Barrier Reverse Convertible on Bayer, Johnson & Johnson & Merck — Simulation Report
Headline Simulation Results
6.89%
Expected Annualized Return
6.20%
Expected Total Return (realized holding period)
15.78%
Probability of Negative Return
-32.24%
99% Confidence VaR (1 year)
13.40 months
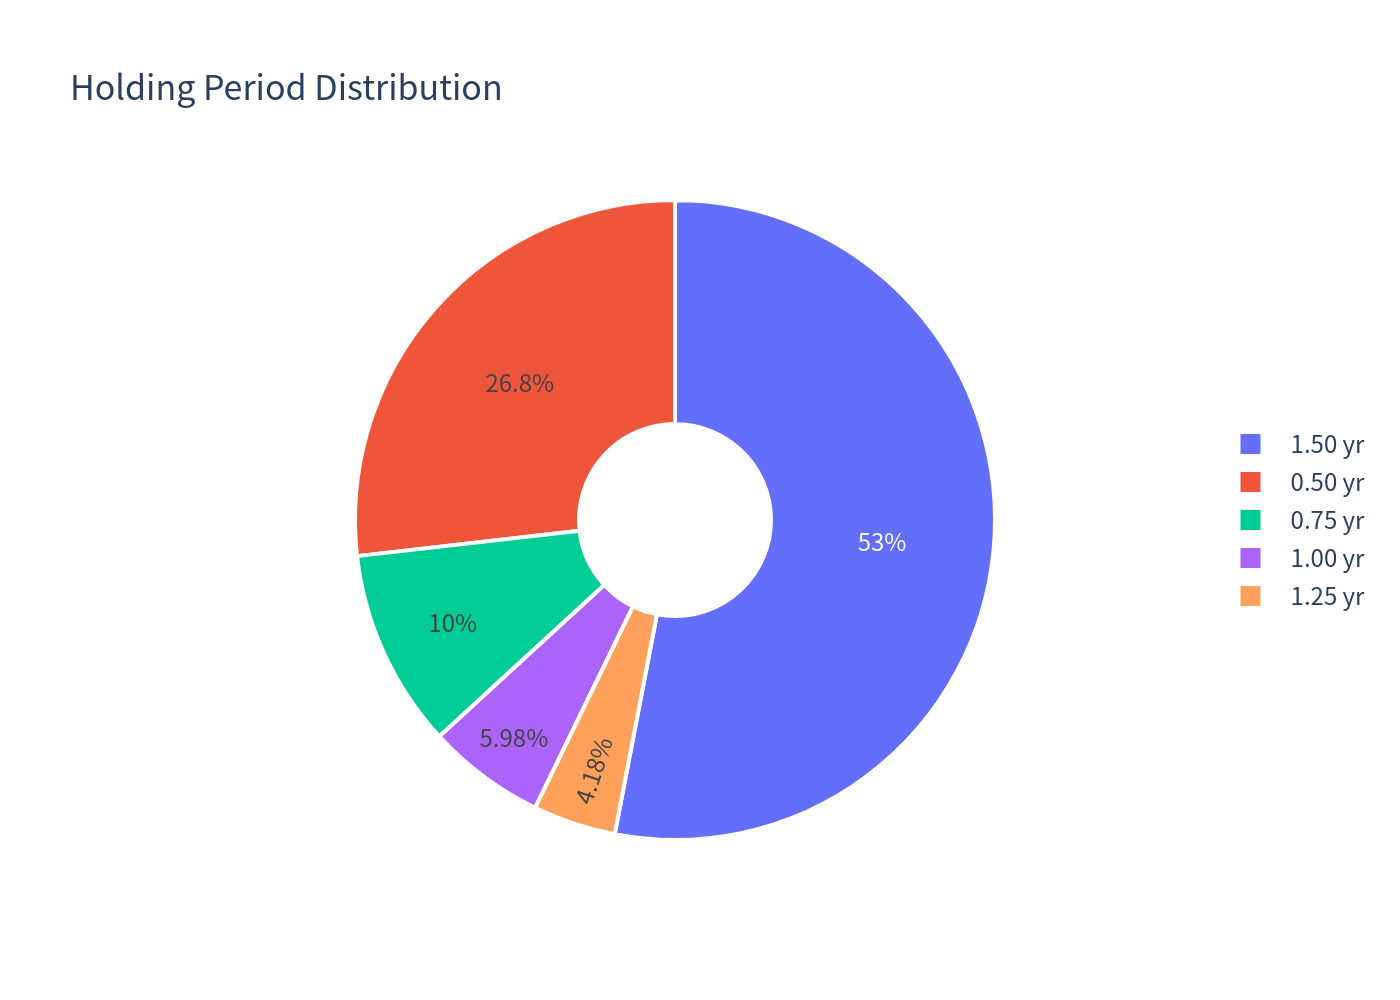
Expected Holding Period
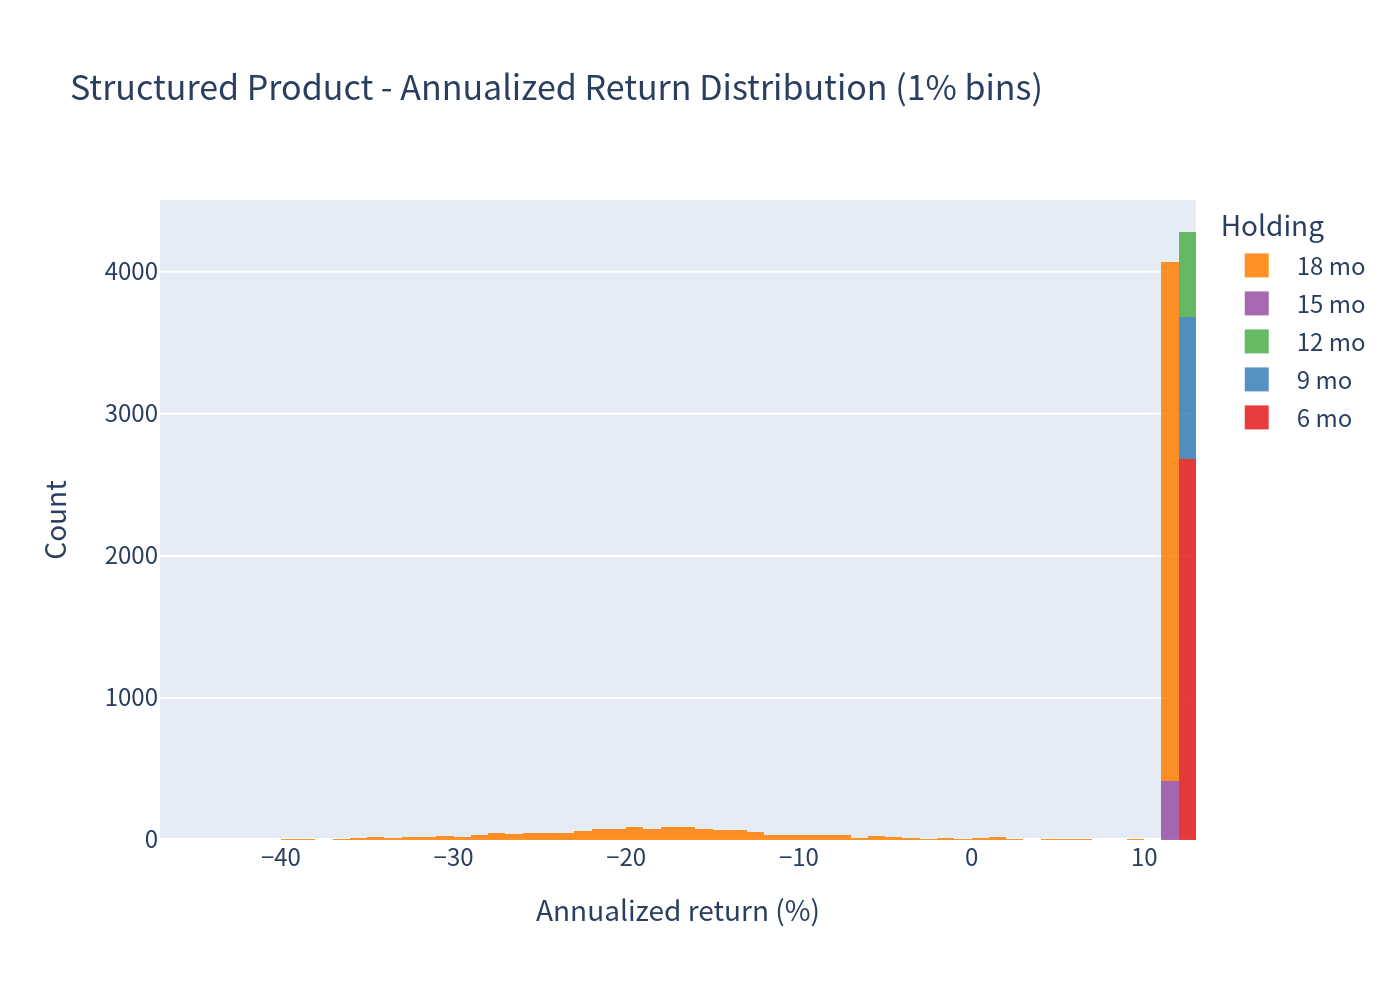
The product is callable by the issuer; in the base-case simulation the issuer is assumed to call at the first observation date at which all three underlyings are at or above their initial fixing levels (≈ 46.98% of scenarios), while ≈ 53.02% of scenarios run to full 18-month maturity. Because a large share of simulations ends early, the short-holding-period annualized figures can look elevated; total return and holding period should be read together.
Basic Product Information
| Product type | SSPA 1230 Reverse Convertible, multi-barrier, issuer-callable, Quanto CHF (ISIN CH1593763399). |
|---|---|
| Underlyings | Bayer AG, Johnson & Johnson and Merck & Co. — payoff depends on the worst-performing of the three. |
| Coupon | 12.00% p.a., paid quarterly (CHF 30 per CHF 1,000 = 3.00% per quarter), paid regardless of underlying performance. |
| Term | 18 months (issue Aug 2026, final fixing Feb 2028). |
| Downside protection | 59% continuous barrier on each underlying (monitored on each underlying's exchange business day). Strike = 100% of initial fixing. |
| Upside | Capped — maximum payoff is par plus coupons (up to 18 index points). |
How it works (layman's explanation)
The investor receives a high quarterly coupon (3.00% per quarter) no matter what the three pharma stocks do. At maturity:
- If no underlying ever fell below 59% of its initial level, the investor gets 100% of capital back plus all coupons.
- If a barrier was breached (one or more underlyings traded at or below 59% at any time):
- If the worst-performing stock finishes below its initial level (100%), the investor receives shares of that worst stock instead of cash (value = worst performance × notional).
- If the worst performer finishes at or above its initial level, the investor gets 100% of capital back.
The issuer may call the product early at any of the four quarterly observation dates, returning par plus the coupon for that date.
Key Statistics (annualized, 10,000 simulated paths)
| Metric | Structured Product | Underlying Basket (equal-weight, with dividends) |
|---|---|---|
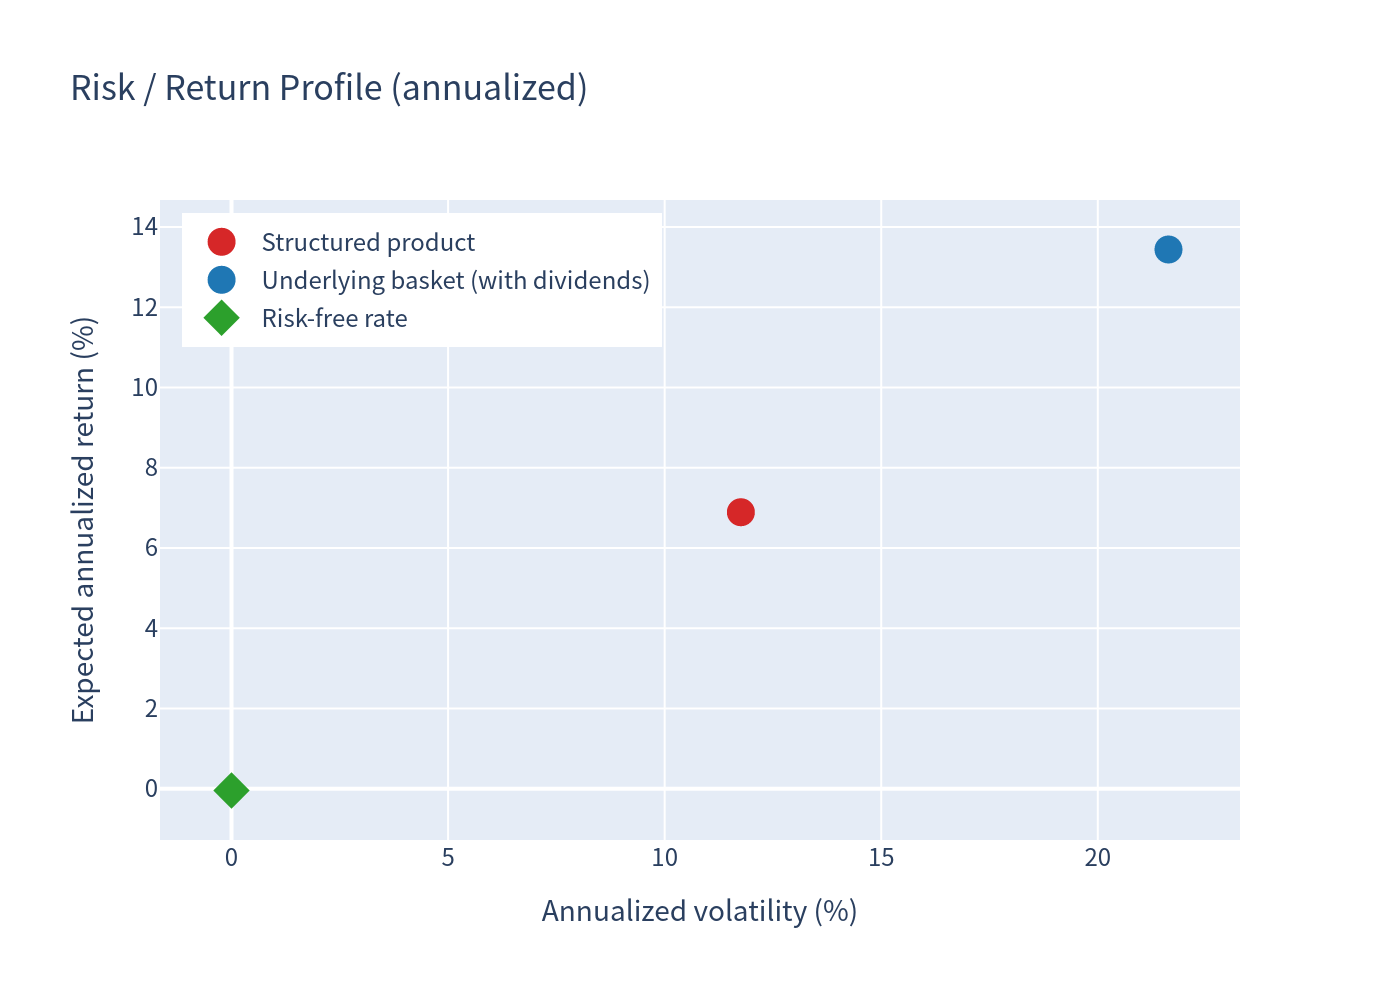
| Expected annualized return | 6.89% | 13.44% |
| Expected annualized volatility | 11.76% | 21.63% |
| Probability of loss | 15.78% | 29.78% |
| 99% confidence VaR (1 year) | -32.24% | -24.87% |
| Expected total return over holding period | 6.20% | — |
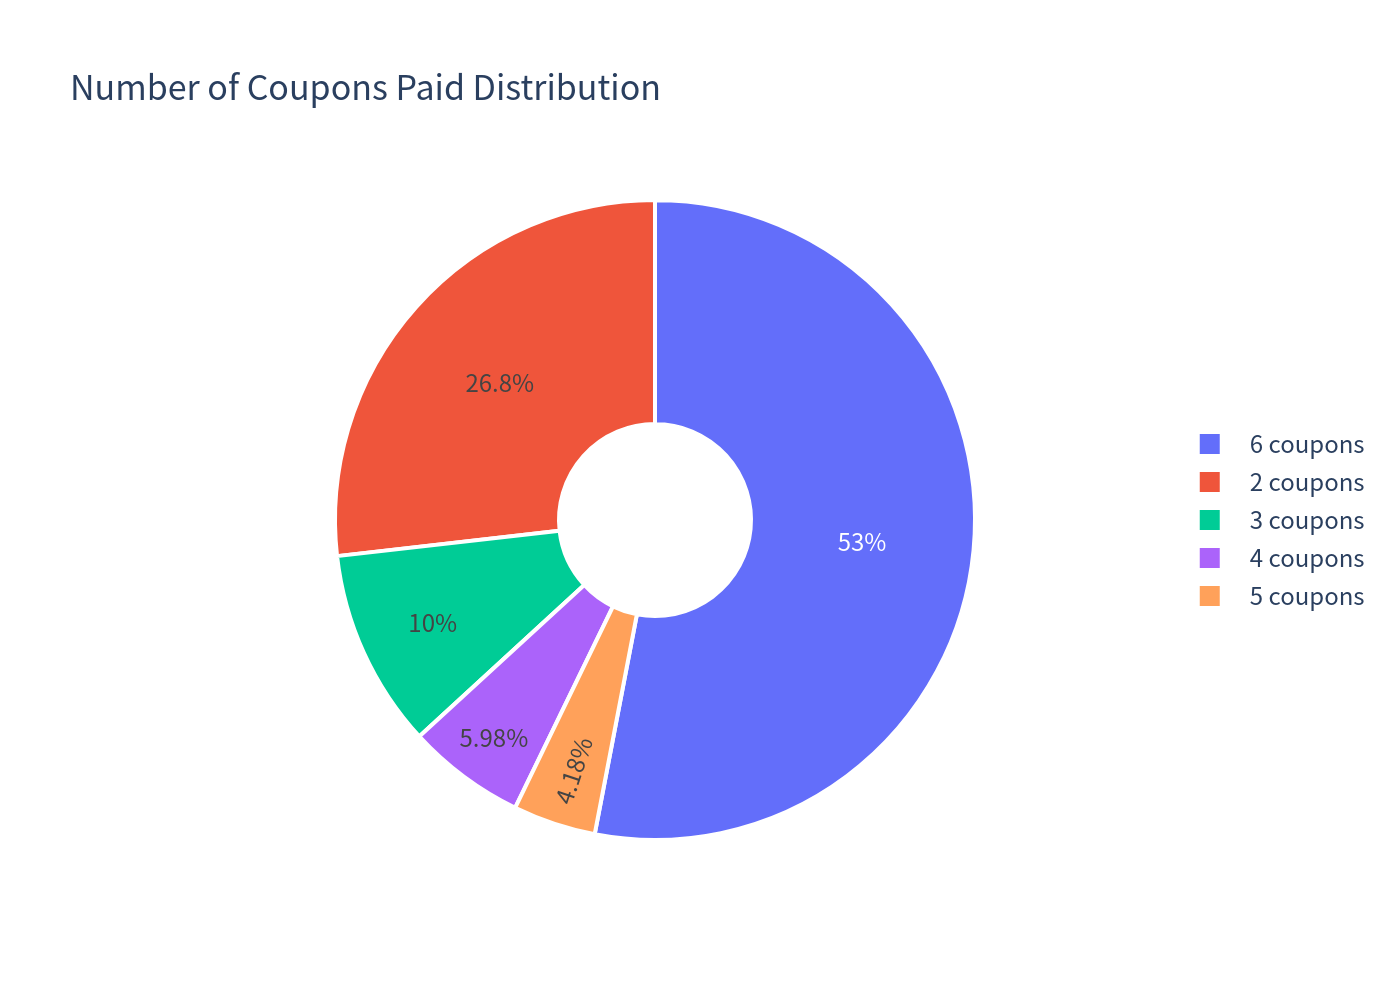
- Expected coupons received: 4.47 (≈ 13.40 index points on a 100 notional).
- Share-delivery scenario (barrier breached and worst stock below initial at maturity): 16.50% of simulations.
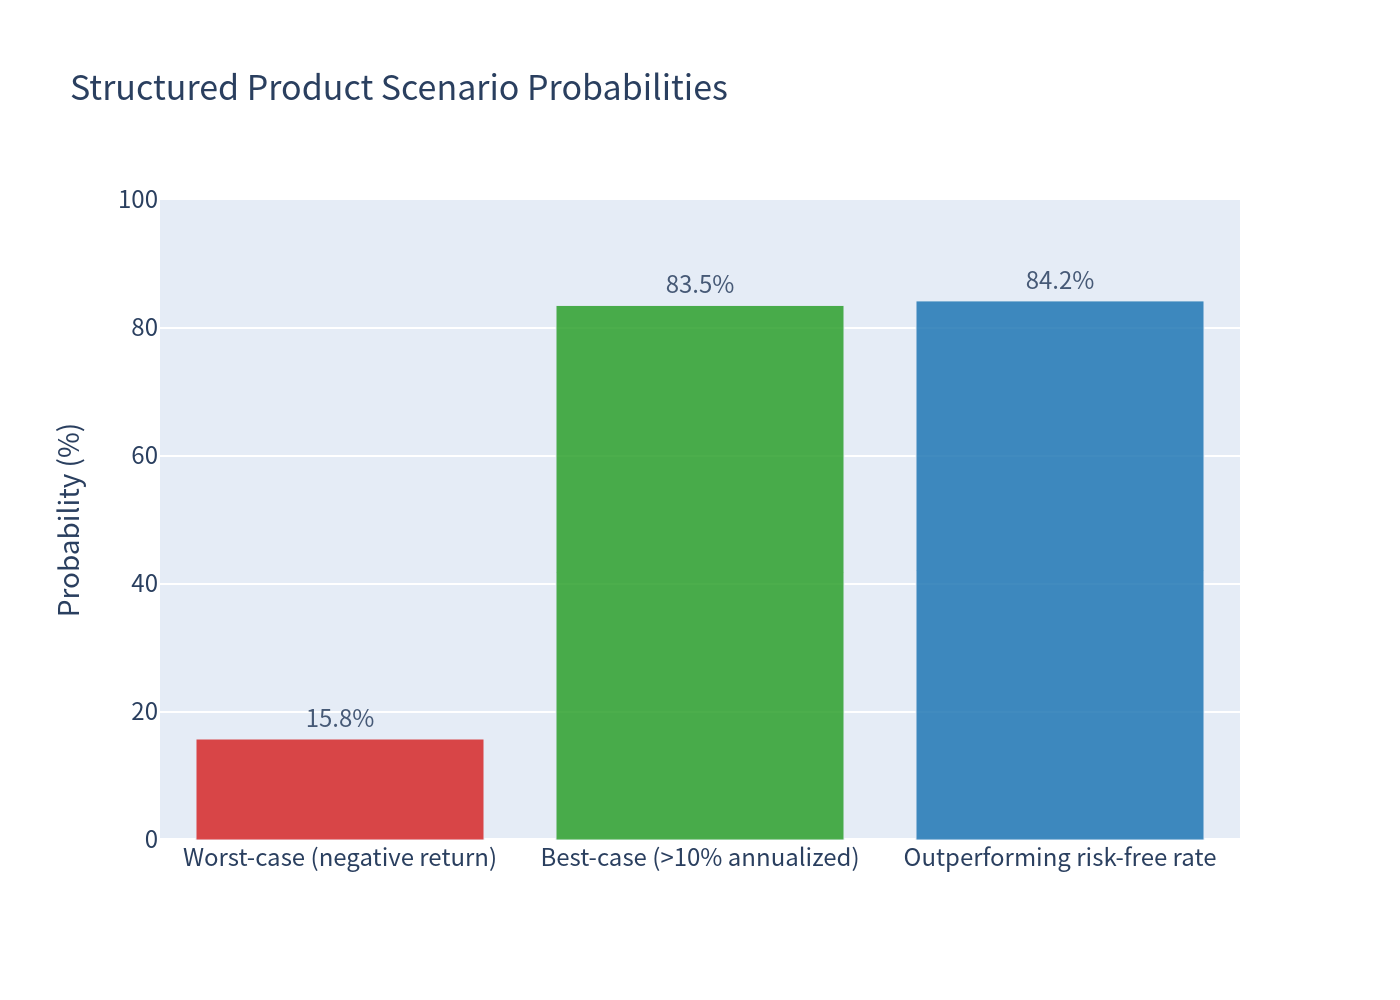
- Probability of annualized return above 10%: 83.53%; probability of outperforming the (≈0%) risk-free rate: 84.23%.
Charts
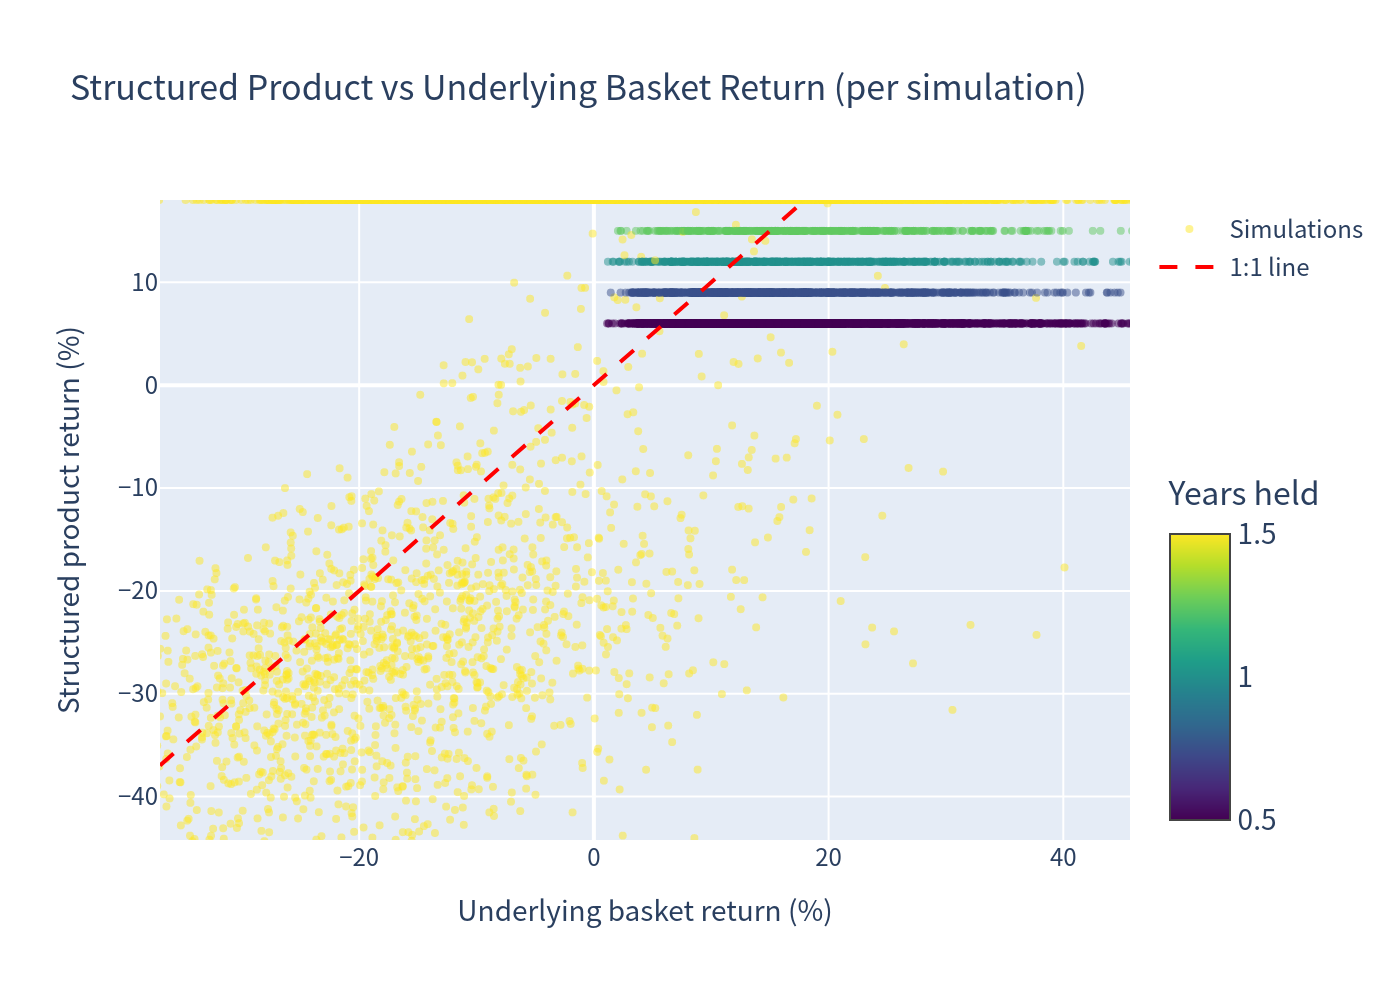
Simulation outcomes — product vs. underlying basket
Scatter plot of simulated outcome pairs across 10,000 paths.
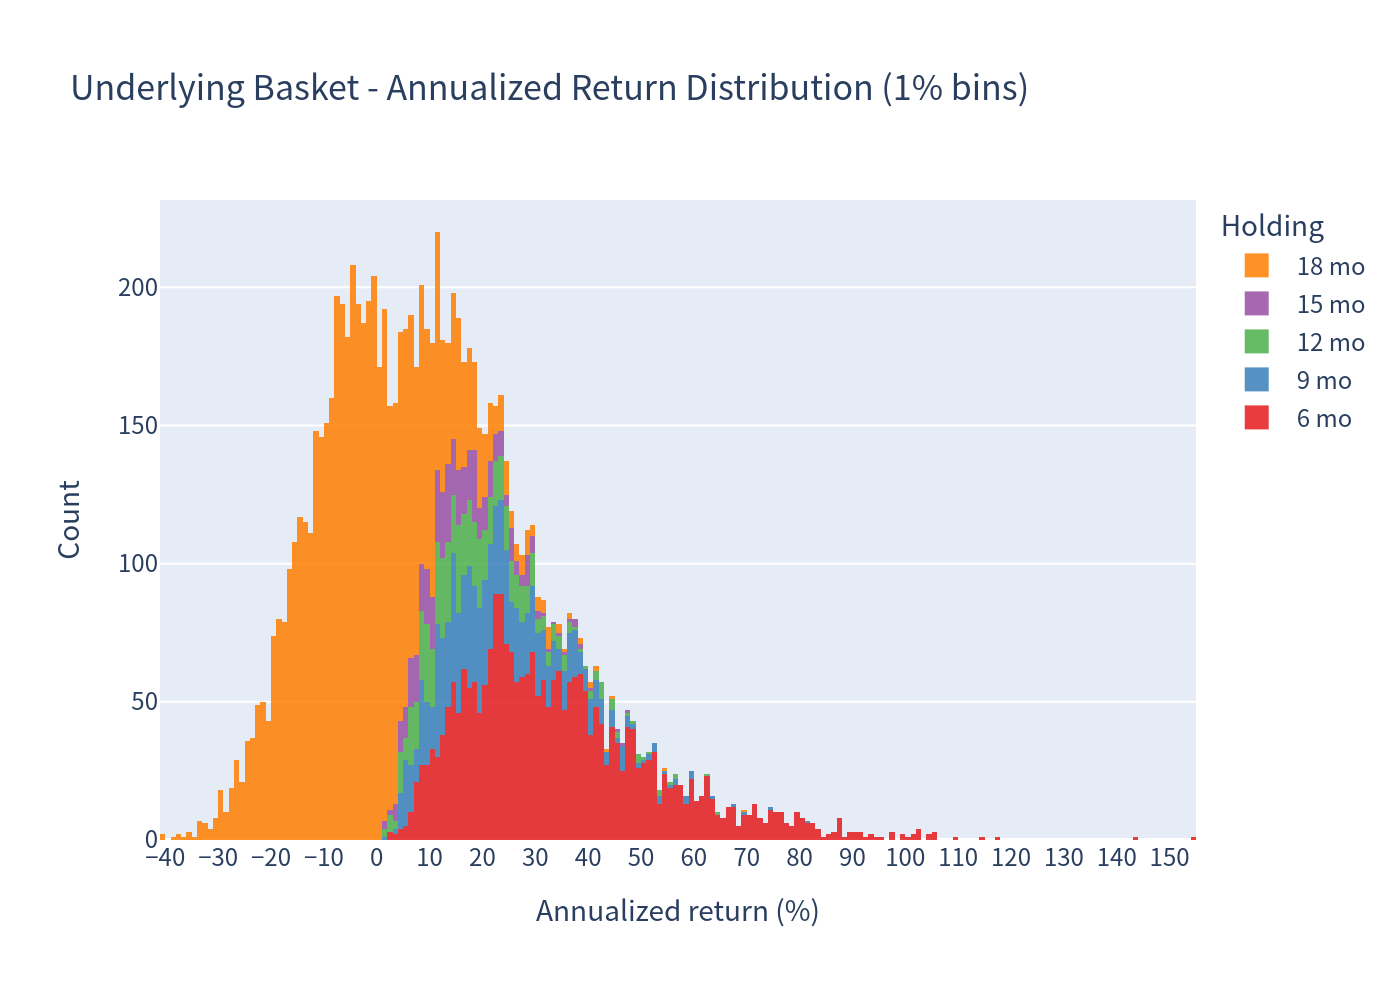
Distribution of annualized returns
Histograms of annualized returns for the underlying basket and the structured product.
Scenario probabilities
Bar chart of outcome scenario probabilities.
Risk / return profile
Risk/return positioning of the structured product versus the underlying basket.
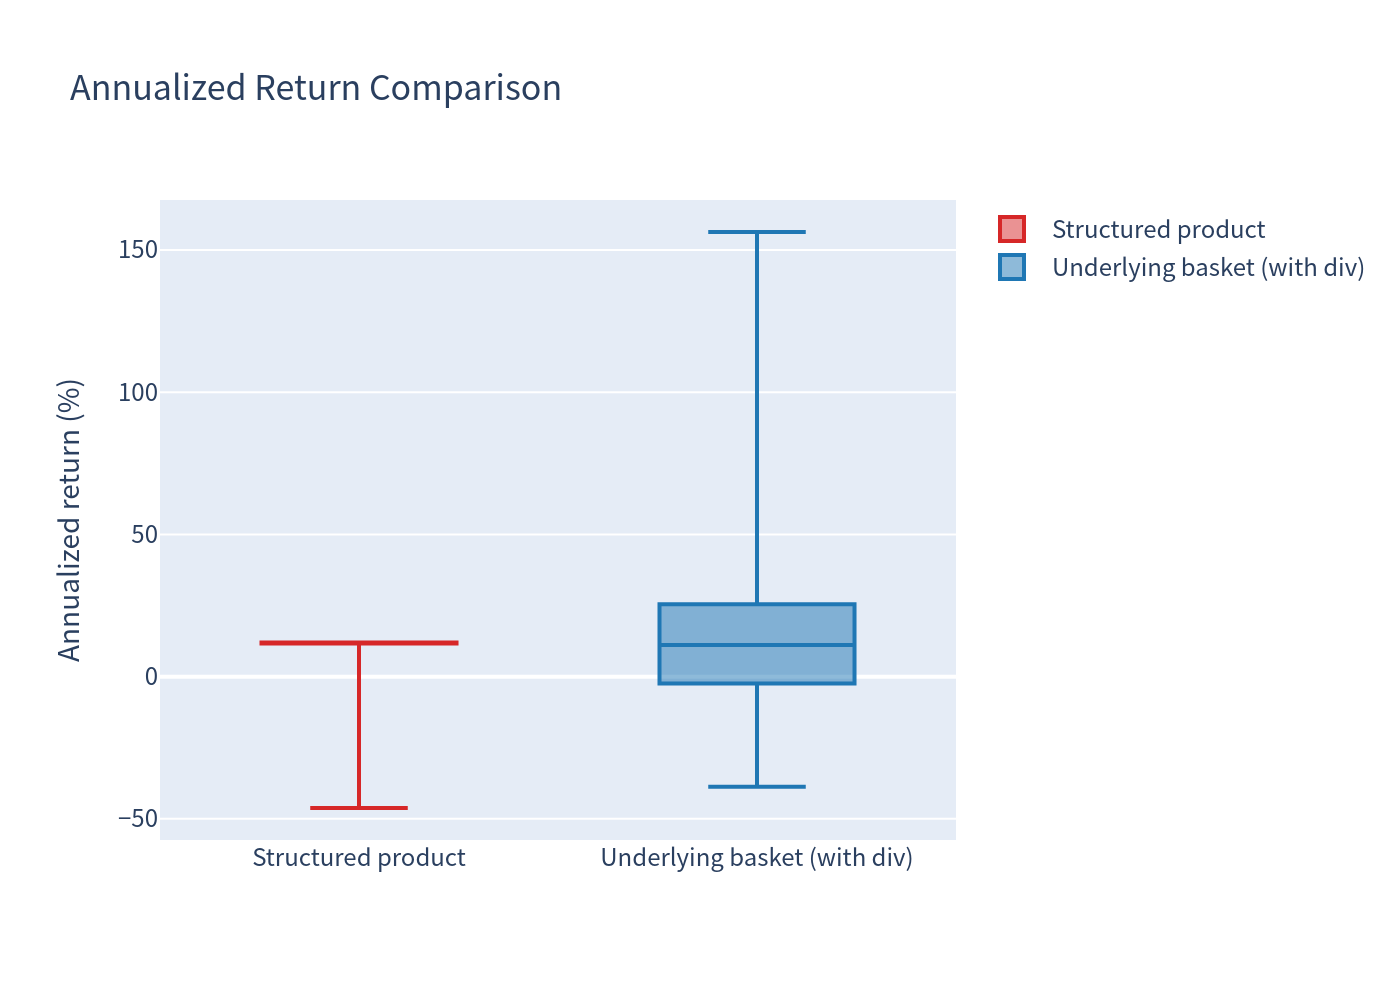
Return distribution comparison (box plot)
Box plot comparing the distribution of outcomes.
Holding period & coupon distributions
Distribution of realized holding periods and number of coupons received.
Investment Commentary
What works in the product's favour
- A high 12.00% p.a. coupon paid quarterly regardless of market performance, with coupons also paid on early redemption dates.
- The 59% barrier provides meaningful cushion: in roughly 83.50% of simulations the investor receives at least par value.
- The probability of a negative return (15.78%) is materially lower than that of the underlying basket (29.78%), and volatility of outcomes is roughly half that of the basket.
- The issuer-call feature frequently locks in par plus coupons in strong markets (≈ 46.98% of scenarios exit early with par + accrued coupons).
Considerations to be aware of
- Upside is capped at par plus coupons (maximum total return 18.00% over the full 18-month term; maximum annualized ≈ 12.00%), so the product gives up the basket's upside in strong markets.
- The worst-of structure concentrates the tail risk on the single worst-performing stock: if a barrier is breached, the redemption can fall sharply with the worst stock, producing a 99% VaR of -32.24% — deeper than the diversified basket's -24.87%.
- A substantial share of simulations (≈ 16.50%) ends with physical delivery of the worst-performing stock at maturity.
- Annualized figures for the many short early-redemption scenarios can look extreme; the expected total return of 6.20% over an expected 13.40-month holding period is the more intuitive reference point.