
9.50% p.a. Multi Barrier Reverse Convertible — Sika / Sonova / Straumann
Headline Simulation Results
Basic Product Information
How it works (layman explanation):
This is a CHF-denominated reverse convertible on three Swiss blue-chip stocks — Sika, Sonova and Straumann. The investor receives a high quarterly coupon of 9.50% p.a. (CHF 23.75 per CHF 1,000 every quarter) regardless of how the underlyings perform, as long as the product is still alive. In exchange, the investor accepts the following conditional payoff profile:
- If none of the three underlyings ever trades at or below 55% of its initial fixing level during the observation period (monitored continuously), the product redeems at 100% (par).
- If any underlying breaches the 55% barrier, redemption at maturity depends on the worst-performing stock: if it finishes below its strike level (100%), the investor receives shares of that stock (worth less than par); if it finishes above strike, par is returned.
- The issuer has the right to call the product on quarterly observation dates from month 6 onwards, paying par plus the coupon for that date. Because the issuer calls when it is economical to do so, the product tends to be redeemed early when the underlyings are healthy — which caps the investor's total coupon income.
Key terms: Denomination CHF 1,000 · 6 quarterly coupons of CHF 23.75 · Barrier 55% (continuous) · Strike 100% · Issuer-callable quarterly from March 2027 · Final fixing 28/02/2028 · Redemption 07/03/2028.
Key Statistics
| Metric | Structured Product | Underlying Basket (equal-weight, total return) |
|---|---|---|
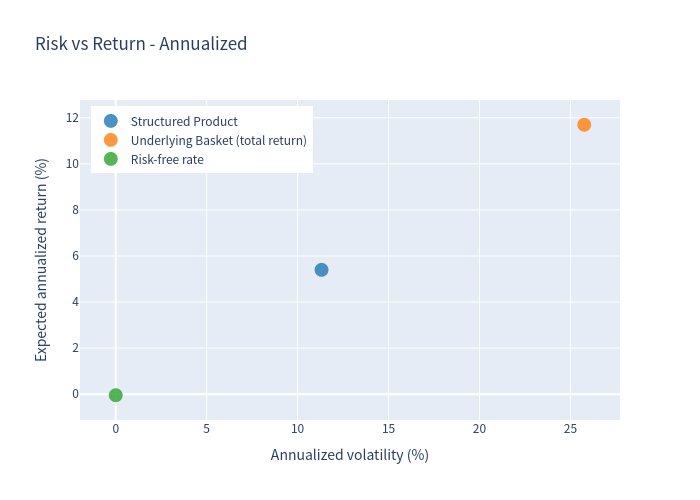
| Expected annualized return | 5.40% | 11.70% |
| Expected annualized volatility | 11.32% | 25.76% |
| Probability of loss | 12.41% | 37.56% |
| 99% confidence VaR (1 year) | -36.96% | -31.73% |
| Expected total return (realized holding period) | 0.95% | — |
| Expected holding period | 8.56 months | — |
| Median annualized return | 9.50% | — |
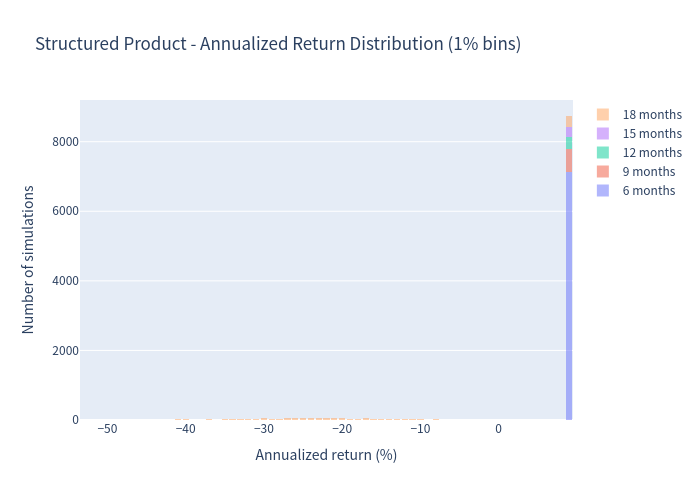
Around 71% of simulated scenarios end at the first call date (6 months). Annualized figures for such short horizons can look flattering (and, in the tail, extreme); they should be interpreted together with the total return and the holding period. The median annualized return of 9.50% equals the headline coupon rate, reflecting the large share of early-call scenarios.
Simulation Outcome Charts
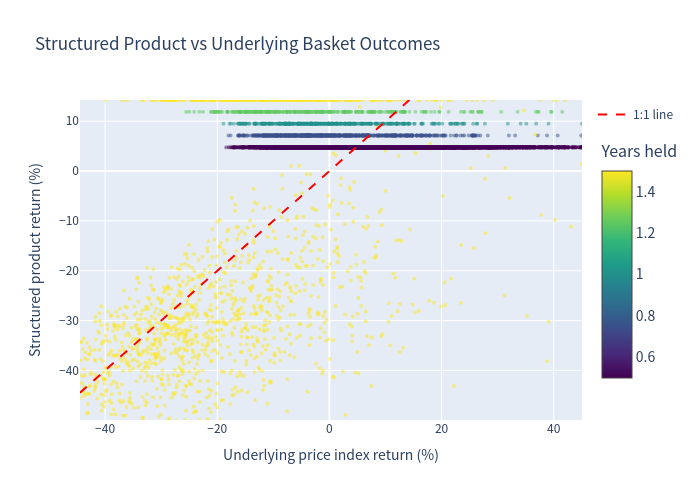
Product vs Underlying Outcomes (scatter)
Simulated total returns of the structured product versus the equal-weight underlying basket.
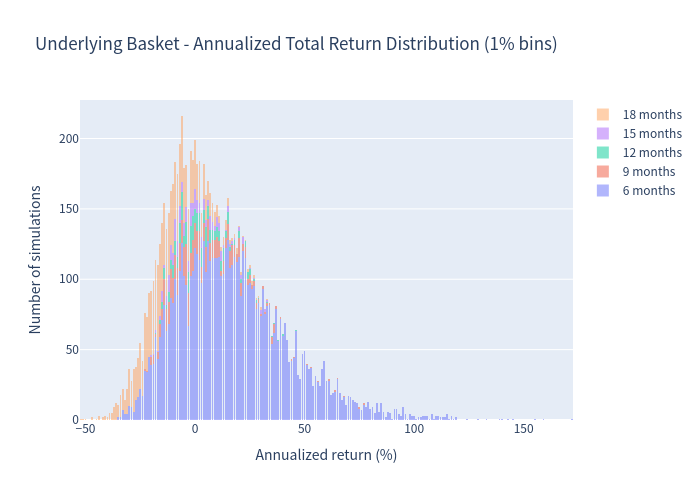
Annualized Return Distributions (1% bins)
Distribution of annualized returns for the underlying basket (left) and the structured product (right), binned in 1% steps.
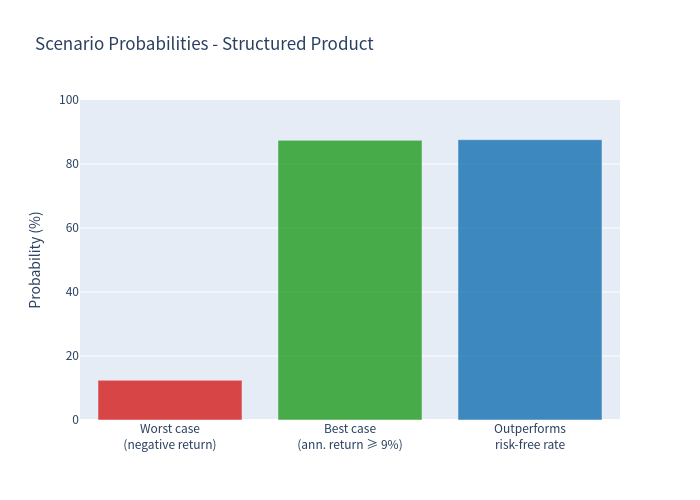
Scenario Probabilities
Probability breakdown across the distinct product outcome scenarios.
Risk / Return Profile
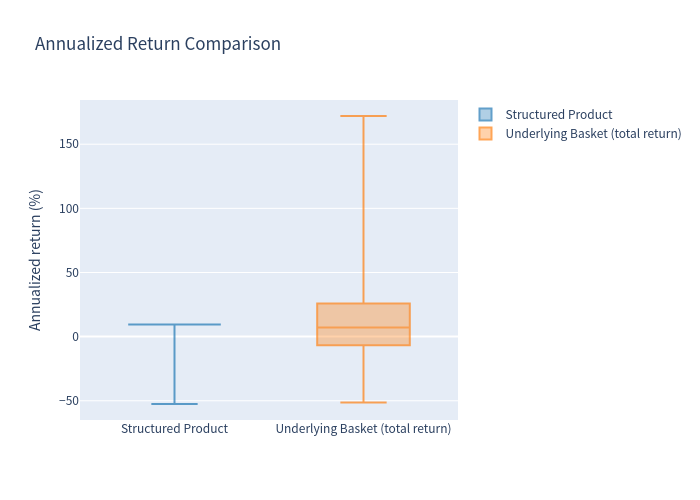
Risk-return positioning of the structured product relative to the underlying basket, with box plot comparison of simulated outcomes.
Holding Period and Coupon Outcomes
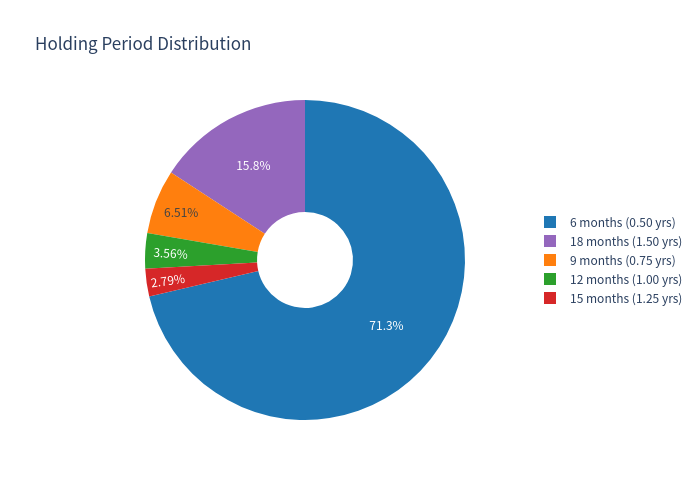
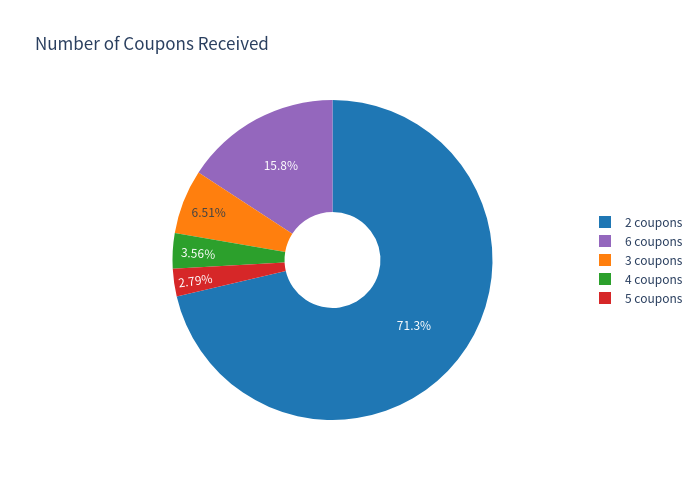
Distribution of realized holding periods and of the number of coupons received across simulations.
Outcome Distribution Highlights
- Holding periods: 71.34% of simulations end at month 6 (first call), 6.51% at month 9, 3.56% at month 12, 2.79% at month 15 and 15.80% at maturity (month 18).
- Coupons received: 2 coupons (71.34%), 3 (6.51%), 4 (3.56%), 5 (2.79%), 6 (15.80%).
- A barrier event occurred in 21.84% of simulated paths; 12.61% of paths ended with redemption below par (physical delivery of the worst performer).
Investment Commentary
Pros:
- Attractive headline coupon of 9.50% p.a., paid quarterly, independent of underlying performance while the product is alive.
- Conditional capital protection: if no underlying ever breaches 55% of its initial level, full par is returned regardless of final levels.
- 87.59% of simulated scenarios deliver a positive return, with a median annualized return equal to the 9.50% coupon rate.
- When early redemption occurs, full par plus the current coupon is paid — no capital loss in those scenarios.
Cons:
- The issuer-call feature works against the investor: the product is typically called at the first observation date (71% of scenarios) precisely when the underlyings are healthy, capping total coupon income well below the full 18-month coupon stream.
- In the 12.41% of scenarios with a loss, losses can be severe — the 99% 1-year VaR is -36.96%, with worst-case simulated outcomes around -52%.
- If any underlying breaches the 55% barrier, the investor is exposed to the worst-performing stock at maturity and may receive shares worth materially less than par.
- The expected annualized return of 5.40% sits below the headline coupon rate, reflecting the combination of early calls and the downside tail.