
10.70% p.a. Multi Barrier Reverse Convertible on Bachem, Nestlé, Novartis, Roche — Simulation Report
Headline Results
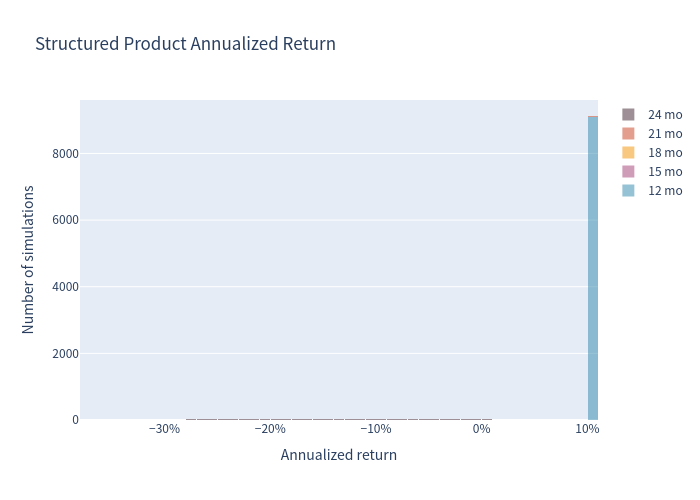
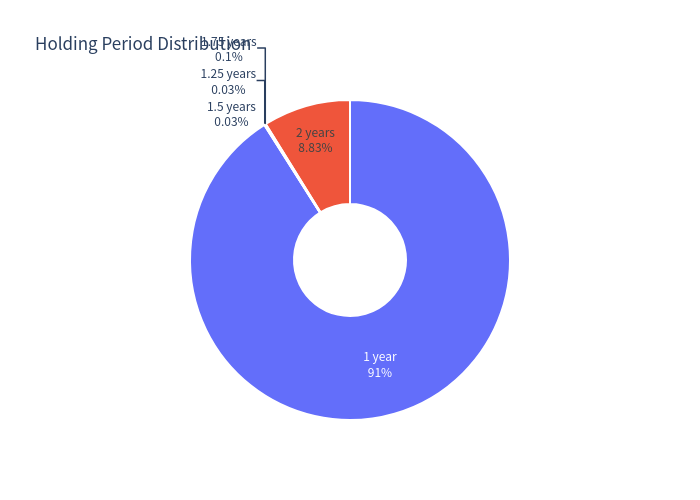
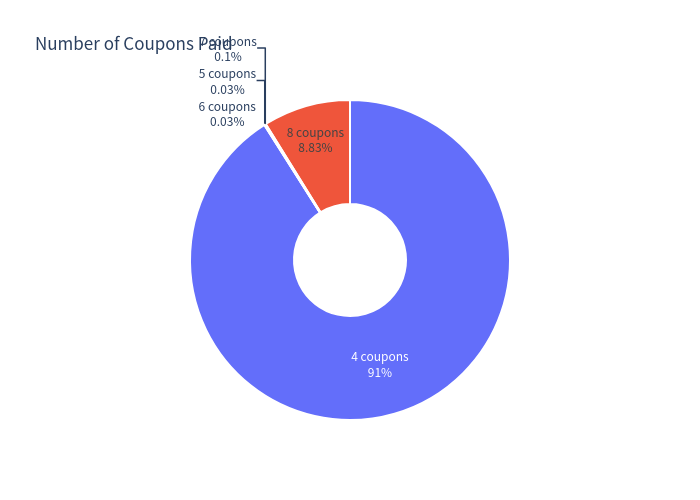
The product pays a 10.70% p.a. coupon (2.675% per quarter) and, under the modelled issuer-call behaviour, is typically early-redeemed after 12 months (91% of simulated paths), returning the full denomination plus four quarterly coupons. Only paths in which a barrier event occurs run to the 24-month maturity, where the investor may receive physical delivery of the worst-performing underlying.
Basic Product Info
| Type | Callable Multi Barrier Reverse Convertible (SSPA 1230), issued in CHF, denomination CHF 1,000. |
| Underlyings | Bachem Holding, Nestlé, Novartis, Roche (all CHF-listed). |
| Coupon | 10.70% p.a., paid quarterly (CHF 26.75 per product) regardless of underlying performance, until early redemption or maturity. |
| Barrier | 59% of the initial fixing level (continuous observation on any underlying). |
| Issuer call | From year 1, the issuer may early-redeem the product at par plus the coupon then due. |
How it works (layman's explanation)
- You receive a high fixed quarterly coupon (2.675% per quarter) for as long as the product runs — this is paid regardless of how the four Swiss stocks perform.
- The issuer can call the product back at quarterly dates from the first anniversary. Because the coupon (10.70% p.a.) is far above current CHF money-market rates, the issuer is expected to call as soon as the product is certain to redeem at par — in which case you get your CHF 1,000 back plus the coupon due, and the product ends.
- If the product is not called, it runs to maturity in 2 years. You still receive all coupons.
- At maturity:
- If no barrier event occurred (all four stocks always stayed above 59% of their initial level), you get back the full CHF 1,000.
- If a barrier event occurred (at least one stock touched 59% or below) and the worst performer is below its initial level, you receive shares of the worst-performing stock (value = its final level), i.e. you participate in the loss of the weakest name.
- If a barrier event occurred but the worst performer is at or above its initial level, you still get back the full CHF 1,000.
In short: a high-coupon yield-enhancement product that works best when the four stocks avoid a severe decline; the main risk is a large drop in any single stock that breaches the 59% barrier and leaves the worst name below its starting level at maturity.
Key Statistics — Structured Product vs Underlying
The benchmark is the equal-weight basket of the four underlying stocks (with dividends included for the total-return comparison).
| Metric | Structured Product | Underlying (benchmark, total return) |
|---|---|---|
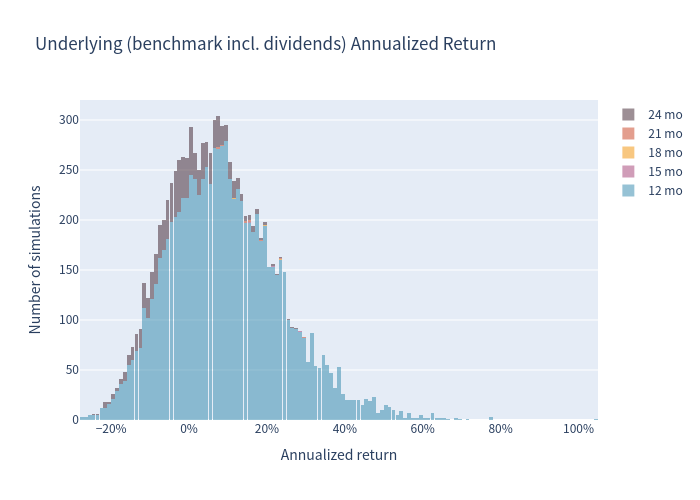
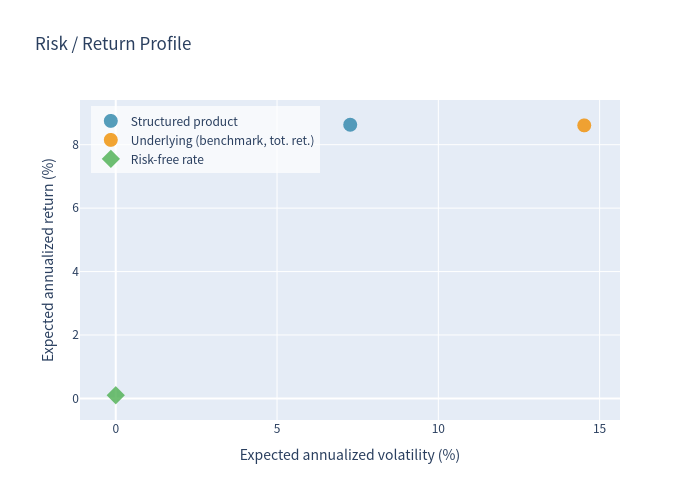
| Expected annualized return | 8.63% | 8.61% |
| Expected annualized volatility | 7.27% | 14.52% |
| Probability of loss | 7.87% | 29.91% |
| 99% confidence VaR (1 year) | −25.09% | −18.86% |
Charts
Simulated outcomes: structured product vs underlying
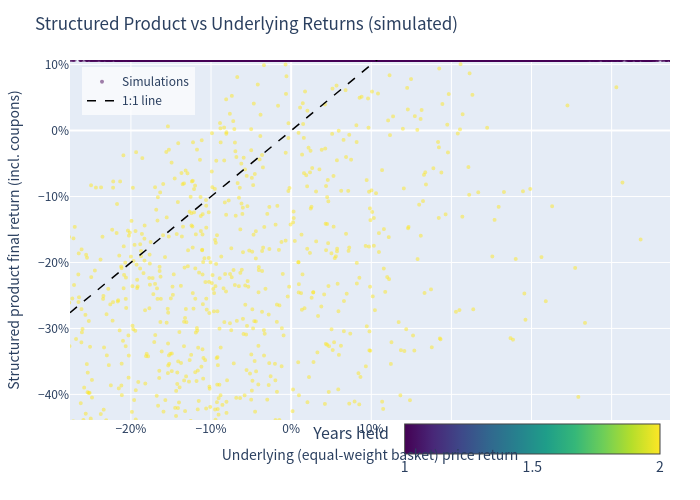
Scatter plot of simulated annualized outcomes for the structured product against the underlying benchmark.
Annualized return distributions (1% bins, coloured by holding period)
Distribution of simulated annualized returns for the structured product, coloured by the realized holding period.
Annualized return distribution — underlying benchmark
Distribution of simulated annualized total returns for the equal-weight underlying basket.
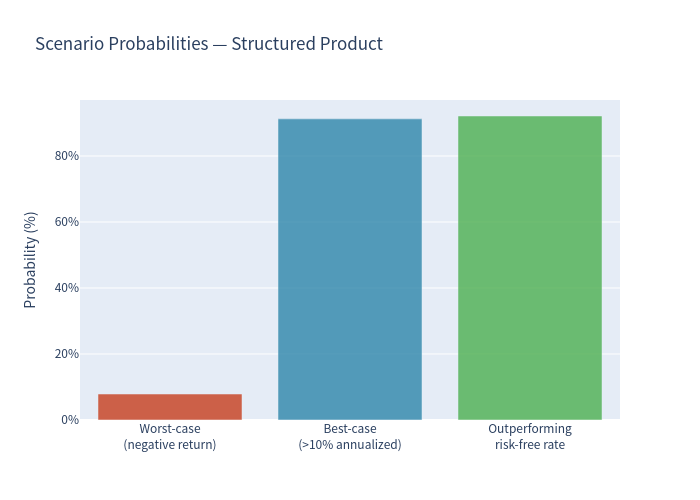
Scenario probabilities
Probability of the main outcome scenarios across simulated paths (early call, barrier event, redemption at par, etc.).
Risk / return profile
Risk–return positioning of the structured product relative to the underlying basket and cash benchmark.
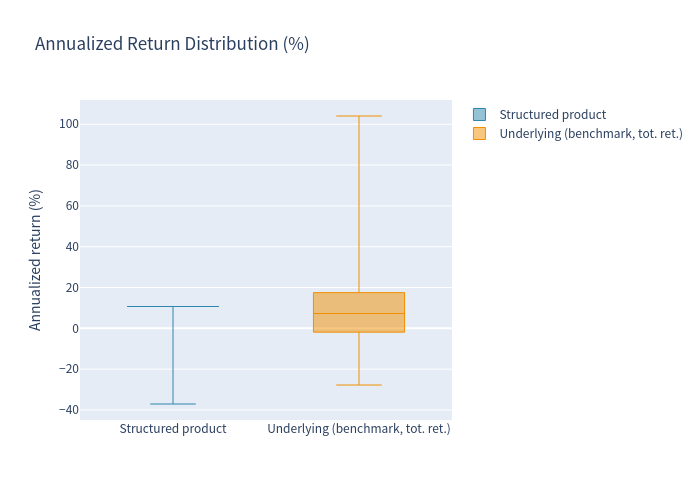
Annualized return comparison (box plot)
Distributional comparison of annualized returns between the structured product and the underlying basket.
Holding period and coupon distributions
Distribution of realized holding periods and the number of coupons collected across simulated paths.
Number of coupons collected across simulated paths.
Investment Commentary
Key strengths
- Attractive coupon in a low-rate environment: 10.70% p.a. is far above the CHF money-market rate (~0%), and the coupon is paid unconditionally while the product is alive.
- High probability of a positive outcome: ~92% of simulated paths outperform the risk-free rate and ~91% are redeemed at the first call date with a +10.70% total return over 12 months.
- Conditional downside protection: the 59% barrier cushions declines of up to ~41% before capital is at risk at maturity; without a barrier event the denomination is repaid in full.
- Lower volatility than direct equity exposure: expected annualized volatility of 7.27% versus 14.52% for the equally-weighted basket, driven by the capped upside and frequent early redemption.
- Risk diversification of the payoff: the product's expected annualized return (8.63%) matches the basket's expected total return (8.61%) while roughly halving volatility.
Risk considerations (factual)
- If a barrier event occurs and the worst-performing stock finishes below its initial level, the investor receives shares worth less than the denomination — the 99% VaR of −25.09% reflects these tail scenarios (worst simulated total return ≈ −60%).
- The issuer call shortens the expected holding period to ~13 months, limiting the number of coupons actually collected to four in most cases; the headline annualized return therefore reflects a short-lived product.
- Capital is exposed to the credit risk of the issuer.