
Buffered Jump Securities with Auto-Callable Feature due May 1, 2031
Based on the S&P U.S. Equity Momentum 40% VT 4% Decrement Index
Headline Simulation Results
| Metric | Result |
|---|---|
| Expected annualized return | 9.53% |
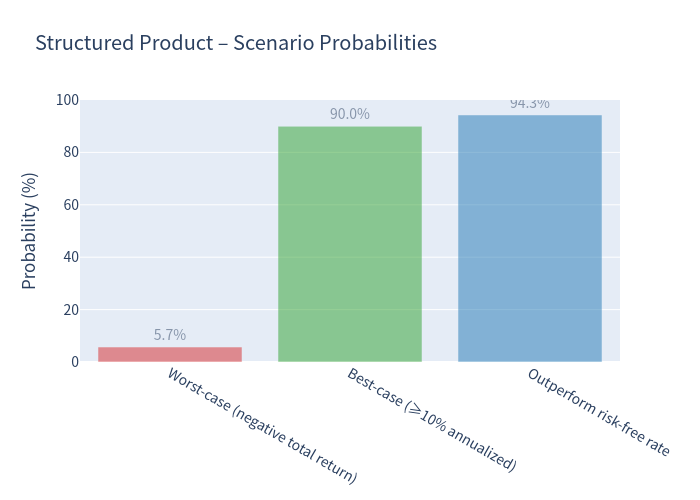
| Probability of a negative return | 5.71% |
| 99% confidence 1-year VaR | -14.18% |
| Probability of outperforming the risk-free rate (3.73%) | 94.29% |
| Expected holding period | ~16.7 months |
| Expected total return over the holding period | 9.84% |
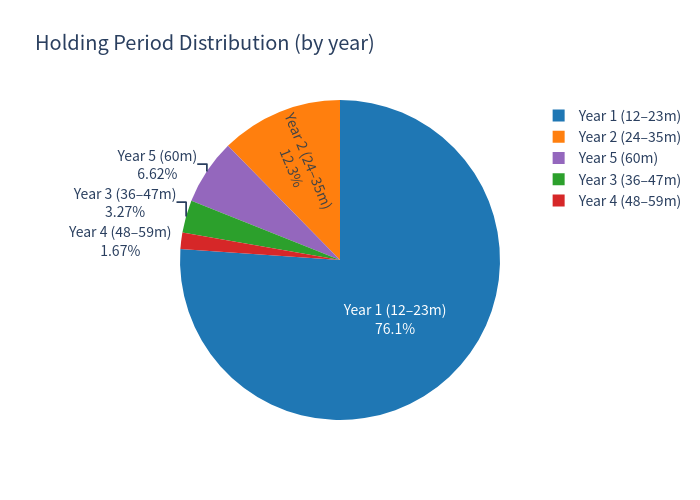
The note behaves like a high-probability, capped-return "carry" trade: the simulated autocall rate is 94.05%, and 76.1% of paths redeem on the very first observation date (month 12). Because the redemption trigger (85% of the starting level) is set well below par, the note is very likely to end early with a modest, fixed positive return, but there is a small (~5.7%) chance of a meaningful loss if the index stays depressed throughout the term.
How the Product Works (in plain terms)
- No periodic coupon. The return is delivered all at once, either when the note is automatically redeemed early or at maturity.
- Automatic early redemption (autocall). Beginning one year after issue and checked monthly thereafter, if the index closes at or above 85% of its starting level, the note is redeemed immediately for a fixed payment equal to a ~10.75% per-annum accrual of principal (i.e., roughly +10.75% after year 1, rising over time).
- Maturity "jump". If the note is never called and the index finishes at or above 85% of its starting level, the investor receives a fixed ~+53.75% return (settled at the 5-year point).
- Buffer / downside. If the index finishes below 85%, the investor absorbs the decline below the 85% level (a 15% buffer) and can lose principal, subject to a 15% minimum payment (i.e., a worst case of -85% of principal).
- Upside is capped. The investor does not participate in index appreciation; returns are fixed once the trigger conditions are met.
Key Statistics
| Metric | Structured Product | Underlying (Total Return) |
|---|---|---|
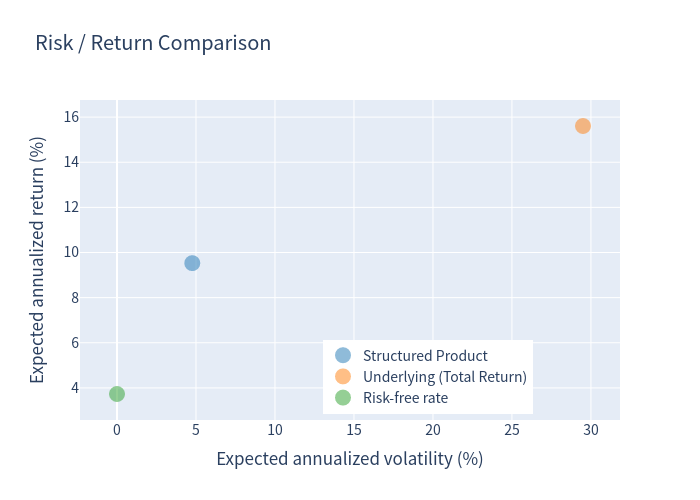
| Expected annualized return | 9.53% | 15.61% |
| Expected annualized volatility | 4.77% | 29.50% |
| Probability of loss | 5.71% | 41.31% |
| 99% confidence VaR (1 year) | -14.18% | -19.89% |
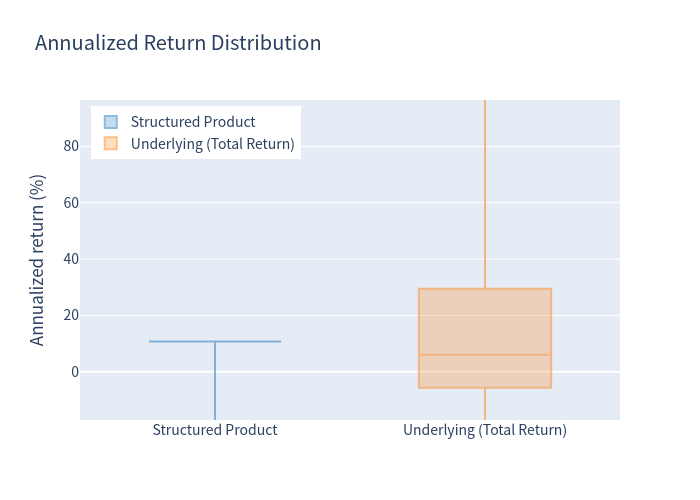
| Median annualized return | 10.75% | 6.03% |
The product trades a large amount of upside (the underlying's expected 15.61% is capped at ~10.75% per year) for a very large reduction in risk (volatility 4.77% vs 29.50%; loss probability 5.71% vs 41.31%). This is the classic autocallable profile.
Charts
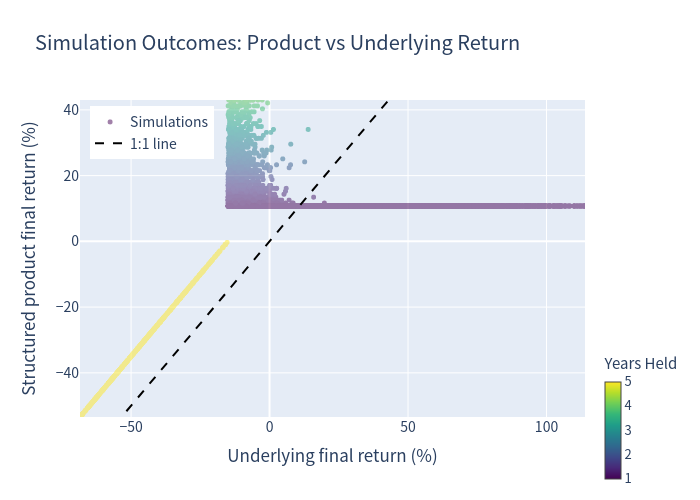
Simulation outcomes — product vs. underlying
Each point is one simulated path; the dashed line is 1:1. The product's returns are tightly capped (vertical band clustering near +11%) while the underlying spreads widely.
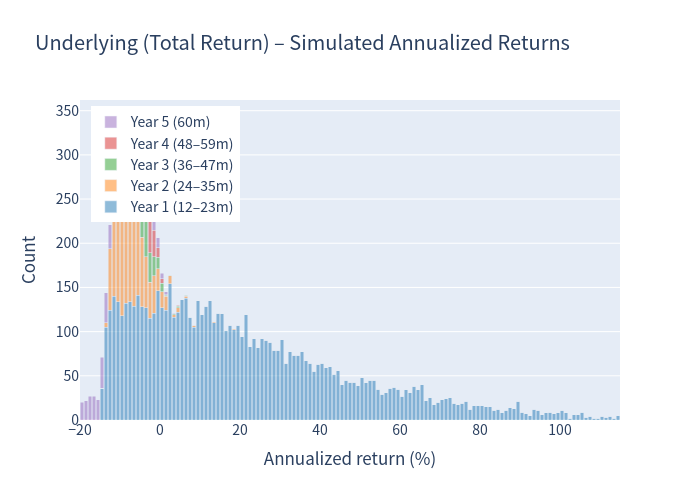
Annualized return distribution — underlying (total return)
Simulated annualized returns over the realized holding period (1% bins, colored by holding year); display truncated to the 1st–99th percentile range for readability.
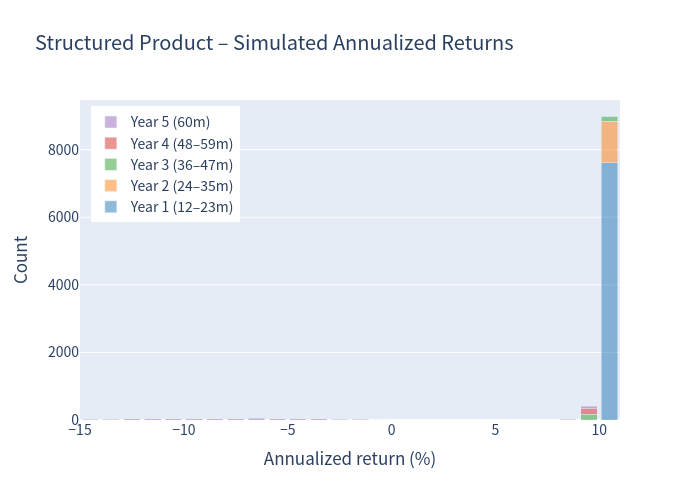
Annualized return distribution — structured product
The dominant bar is the year-1 autocall (~10.75%); a small left tail captures the loss scenarios.
Risk / return comparison
Annualized return box plot
Holding-period distribution
Scenario probabilities
Investment Commentary
Observations that favour the note
- Very high probability (94.29%) of beating a cash / T-bill alternative, and a 94.05% simulated autocall rate, with most redemptions occurring after only one year.
- Buffer mechanic and a 15% floor mean that even in the small fraction of paths that continue to maturity, losses are bounded by the 15% buffer structure rather than a full principal wipe-out.
- Low realized volatility of outcomes (4.77%) versus the underlying (29.50%), producing a much tighter, more predictable return profile — useful for investors seeking a defined, yield-like outcome while accepting tail risk.
Observations that work against the note
- Capped upside. Over a 5-year window the index has a materially higher expected return (~15.61%); in the strong scenarios the investor forgoes essentially all of that.
- Concentrated, conditional tail risk. Despite a modest 5.71% unconditional loss probability, the loss is concentrated: conditional on not being autocalled, 95.97% of paths lose money, with the 1st-percentile annualized loss at -14.18%.
- Single, specialised underlier. The payoff depends on one momentum / volatility-targeted index, so outcomes are sensitive to that factor's performance and to the index's construction (decrement drag), with no diversification.
- Credit exposure to the issuer/guarantor, and the note's estimated value at pricing (~$901 vs. a $1,000 offer price) reflects embedded costs.
This material is a quantitative evaluation of the product's simulated risk/return characteristics and is not investment advice or a suitability assessment.