
1. Headline Simulation Results
| Measure | Result |
|---|---|
| Expected annualized return | -1.38% (median outcome: +11.83%) |
| Probability of a negative return | 31.81% |
| 99% confidence VaR (1 year) | -57.09% |
| Expected total return over the realised holding period | -5.92% |
| Expected holding period | 12.67 months (6.0 to 18.0) |
| Probability of early redemption by the issuer | 53.32% |
| Probability of a barrier event (continuous, worst-of) | 41.08% |
| Best possible outcome | +18.00% (6 quarterly coupons of 3% over 18 months + par redemption) |
| Worst simulated outcome | -80.24% |
The distribution is strongly bimodal: 53.3% of all paths are redeemed early by the issuer with a clean, certain gain of +6.00% / +9.00% / +12.00% / +15.00%, while the 46.7% of paths that survive to maturity lose -21.81% on average (the 18% of accumulated coupons do not compensate for an average ~40% hit on the redemption amount). The median investor earns the coupon (11.8% annualized); the mean is pulled below zero by the knock-in tail.
2. Basic Product Information — How It Works
A worst-of barrier reverse convertible: the investor lends CHF 1,000, receives a fixed 12.00% p.a. coupon (CHF 30 per quarter), and in exchange sells the issuer a put on the worse of two stocks — NVIDIA and SpaceX.
In plain terms:
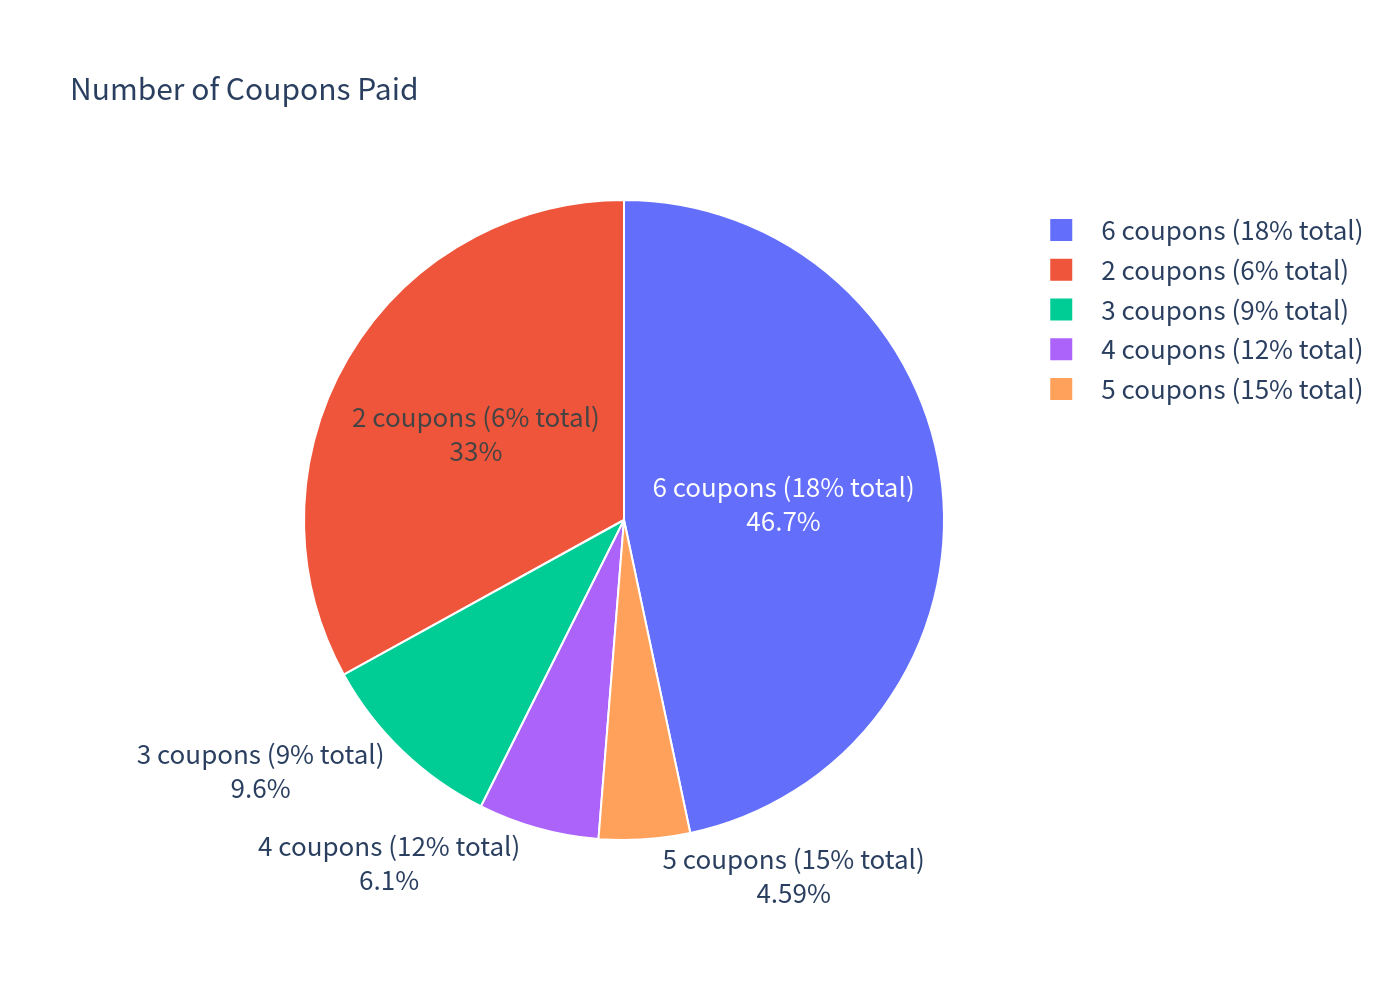
- The coupon is paid unconditionally — CHF 30 per CHF 1,000 every quarter (6 coupons, 18% in total), regardless of what the stocks do, unless the product has already been redeemed.
- If neither stock ever trades at or below 49% of its starting level (observed continuously over the whole 1.5 years), the investor gets 100% of the denomination back at maturity — even if one stock ends 40% lower. Total return: +18%.
- If either stock touches 49% at any moment (a knock-in / "barrier event"), the protection disappears. At maturity the investor then receives the worse-performing stock: par back only if that stock has recovered to at least its starting level, otherwise a 1:1 loss on it (physical delivery of shares, fractions cash-settled).
- The issuer may call the product on four quarterly dates (months 6, 9, 12, 15) and repay par plus the coupon of that date. The investor has no such right.
- Upside is capped: the maximum redemption is par — the investor participates in none of the stocks' upside, only in their downside.
- Quanto CHF: the USD exposure of both stocks is currency-hedged into CHF at a fixed rate, so there is no USD/CHF risk.
| Term | Detail |
|---|---|
| Coupon | 12.00% p.a., CHF 30.00 quarterly per CHF 1,000 (3.00 index points) |
| Coupon dates | 28/01/2027, 28/04/2027, 28/07/2027, 28/10/2027, 28/01/2028, 28/04/2028 |
| Barrier (both stocks) | 49.00% of initial level — continuous observation, 23/10/2026 to 21/04/2028 |
| Strike (both stocks) | 100.00% of initial level (used for the conversion ratio) |
| Issuer call dates | 28/04/2027, 28/07/2027, 28/10/2027, 28/01/2028 (redemption = par + coupon) |
| Maturity / redemption | 21/04/2028 / 28/04/2028 |
| Underlyings | NVIDIA Corp (NVDA); Space Exploration Technologies Corp (SPCX) — both NASDAQ, USD |
3. Key Statistics
| Metric | Expected annualized return (%) | Median annualized return (%) | Annualized volatility (%) | Probability of loss (%) | 99% VaR (%) |
|---|---|---|---|---|---|
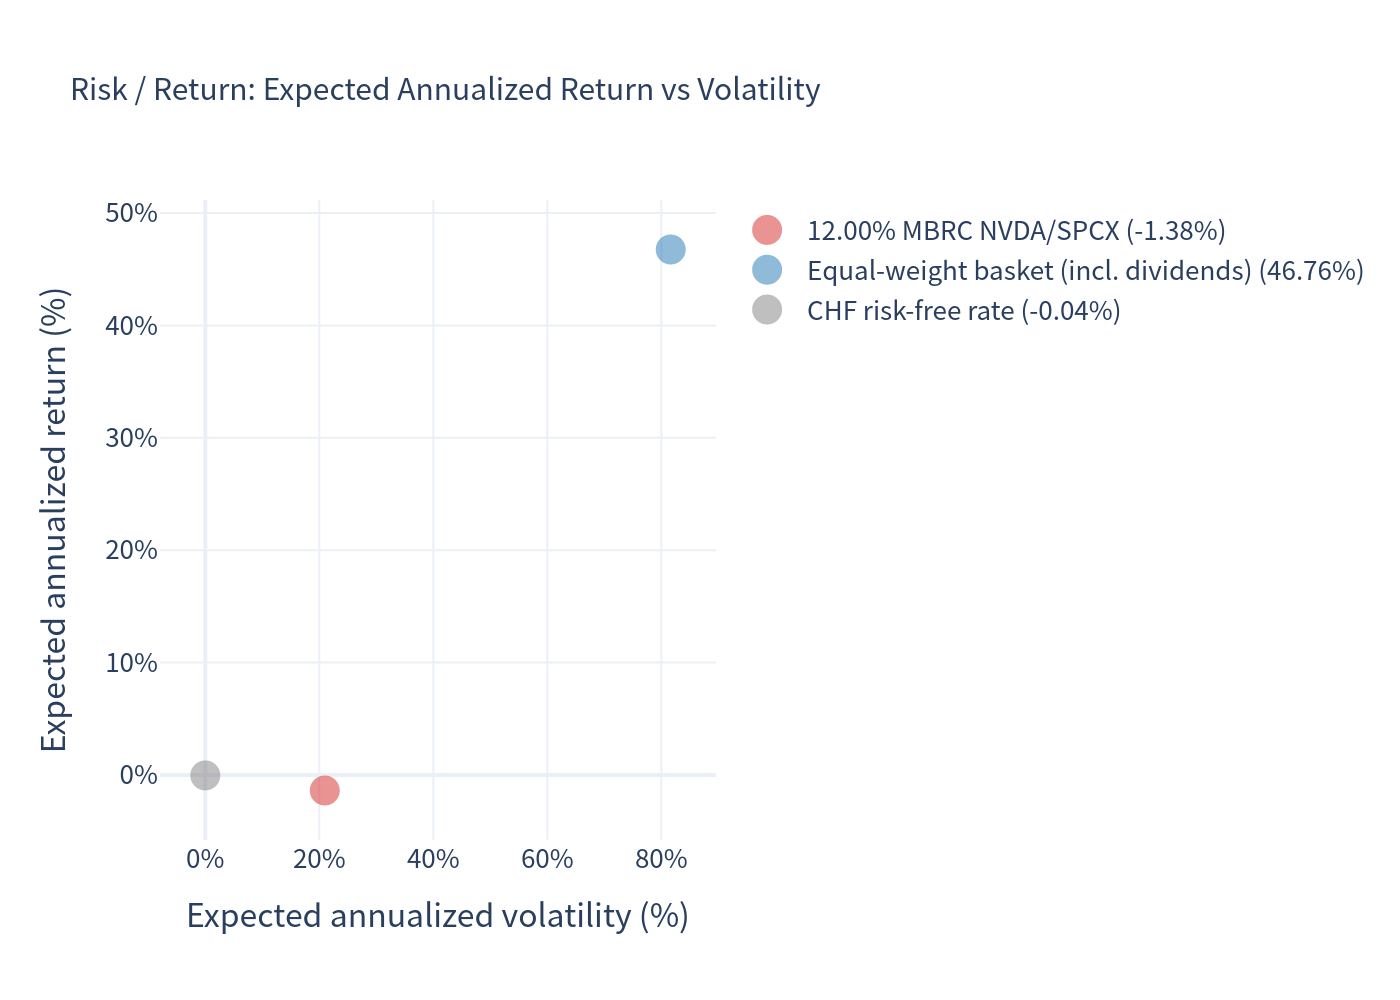
| 12.00% MBRC on NVDA/SPCX (worst-of) | -1.38 | 11.83 | 20.96 | 31.81 | -57.09 |
| Equal-weight basket NVDA/SPCX (price only) | 46.53 | 27.28 | 81.65 | 29.95 | -51.54 |
| Equal-weight basket NVDA/SPCX (incl. dividends) | 46.76 | 27.51 | 81.65 | 29.83 | -51.30 |
| NVIDIA (price only) | 22.51 | 12.94 | 46.28 | 29.94 | -47.92 |
| SpaceX (price only) | 67.75 | 28.58 | 142.34 | 31.95 | -78.30 |
| CHF risk-free rate (1-year money market) | -0.04 | -0.04 | 0.00 | 0.00 | -0.04 |
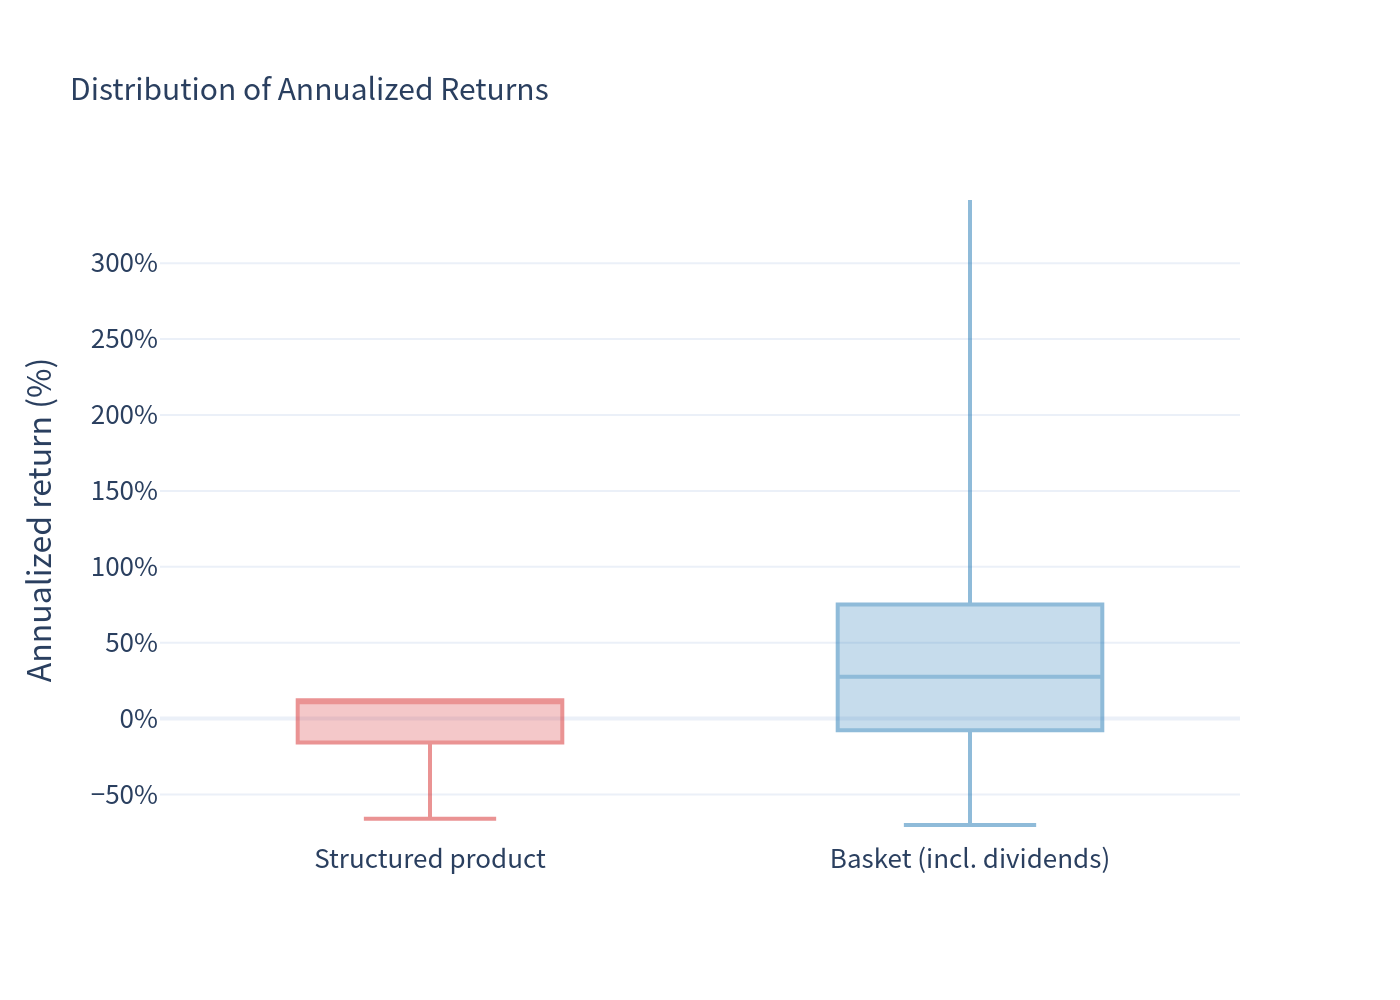
Volatility for the underlying rows is the dispersion of per-simulation annualized returns; it is amplified for individual names because a large share of paths is annualised over a short (6-month) holding period and is therefore not the 83% input volatility of the SpaceX leg. The arithmetic mean of the basket is inflated by extreme right-tail outcomes (SpaceX at 83% volatility has a 95th-percentile terminal value of 5.5x its starting level); the median is the more instructive comparison. The product deliberately gives up that right tail — its upside is capped at +18%.
Return decomposition by holding period
| Redemption | Share of paths | Average total return |
|---|---|---|
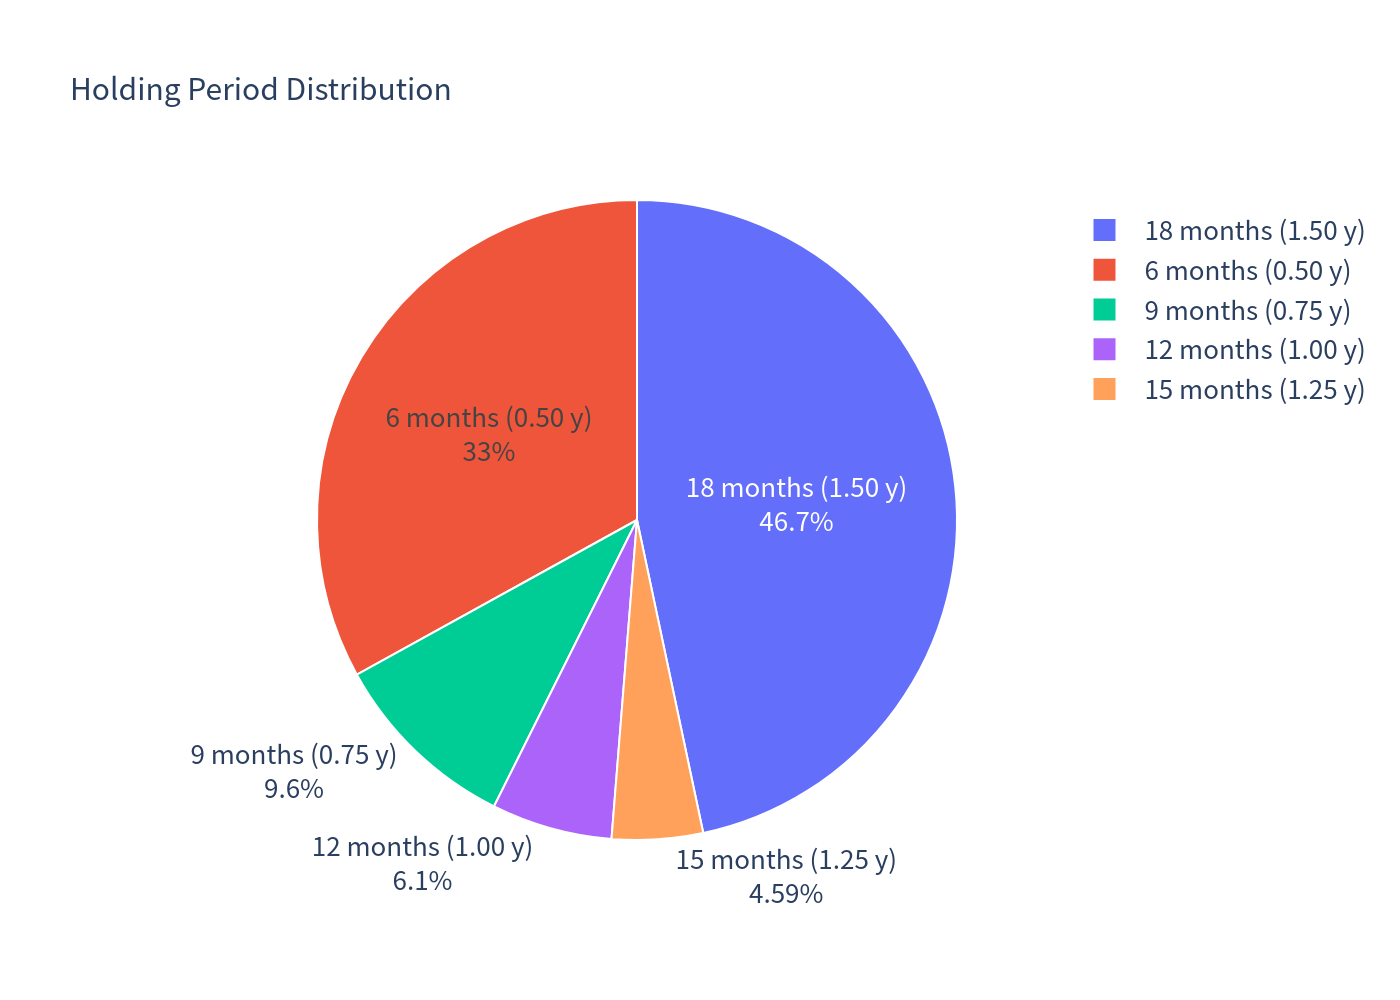
| Called at month 6 | 33.03% | +6.00% |
| Called at month 9 | 9.60% | +9.00% |
| Called at month 12 | 6.10% | +12.00% |
| Called at month 15 | 4.59% | +15.00% |
| Held to maturity (month 18) | 46.68% | -21.81% |
4. Charts
4.1 Simulation outcomes — product vs underlying basket
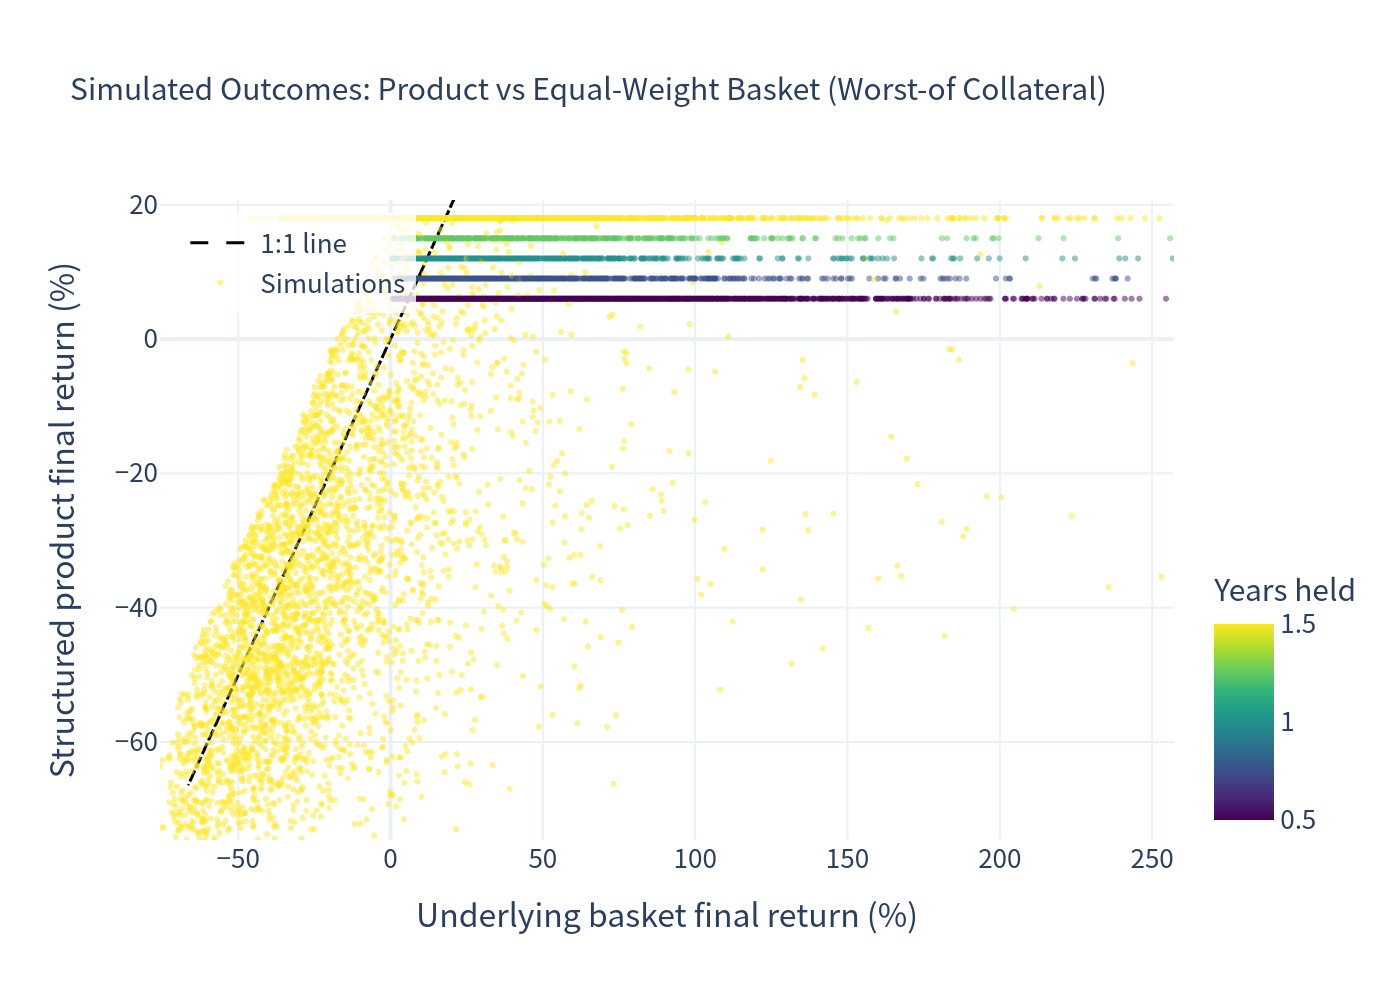
Product returns are capped at +18% and cannot fall below roughly -80%; the equal-weight basket has a far wider dispersion. The horizontal band structure reflects the discrete coupon steps (2, 3, 4, 5, 6 coupons) and the vertical line at 0% underlying return marks the strike.
4.2 Distribution of the product's annualized returns
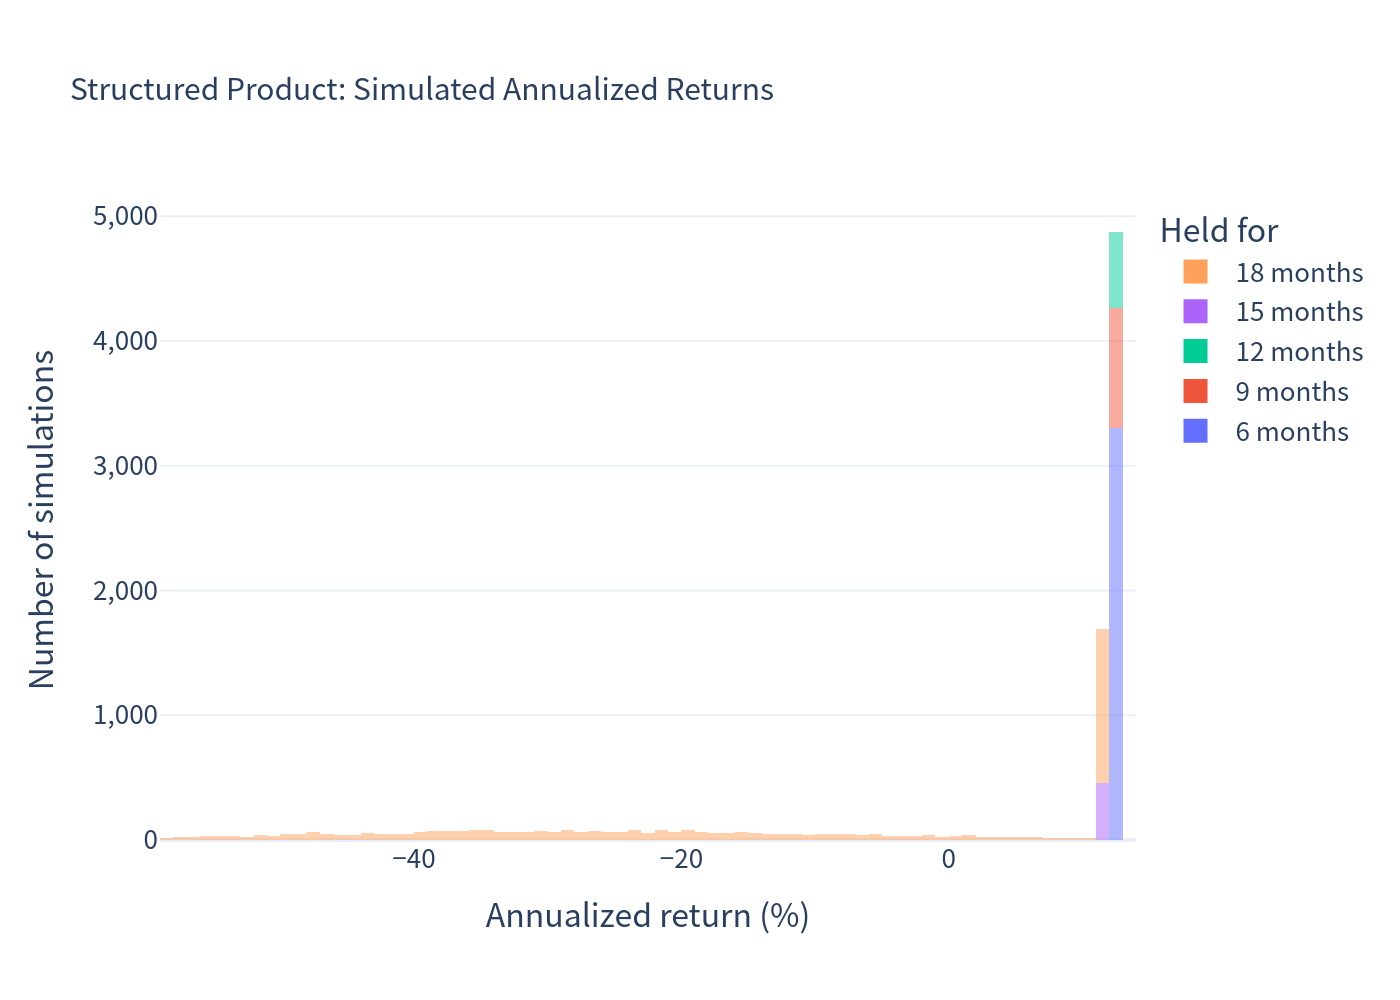
Only 0.2% of paths fall between +15% and +18%: the return is almost always either an exact coupon-driven gain (called at 6/9/12/15 months) or a loss driven by the worst-performing stock.
4.3 Distribution of the underlying basket's annualized returns
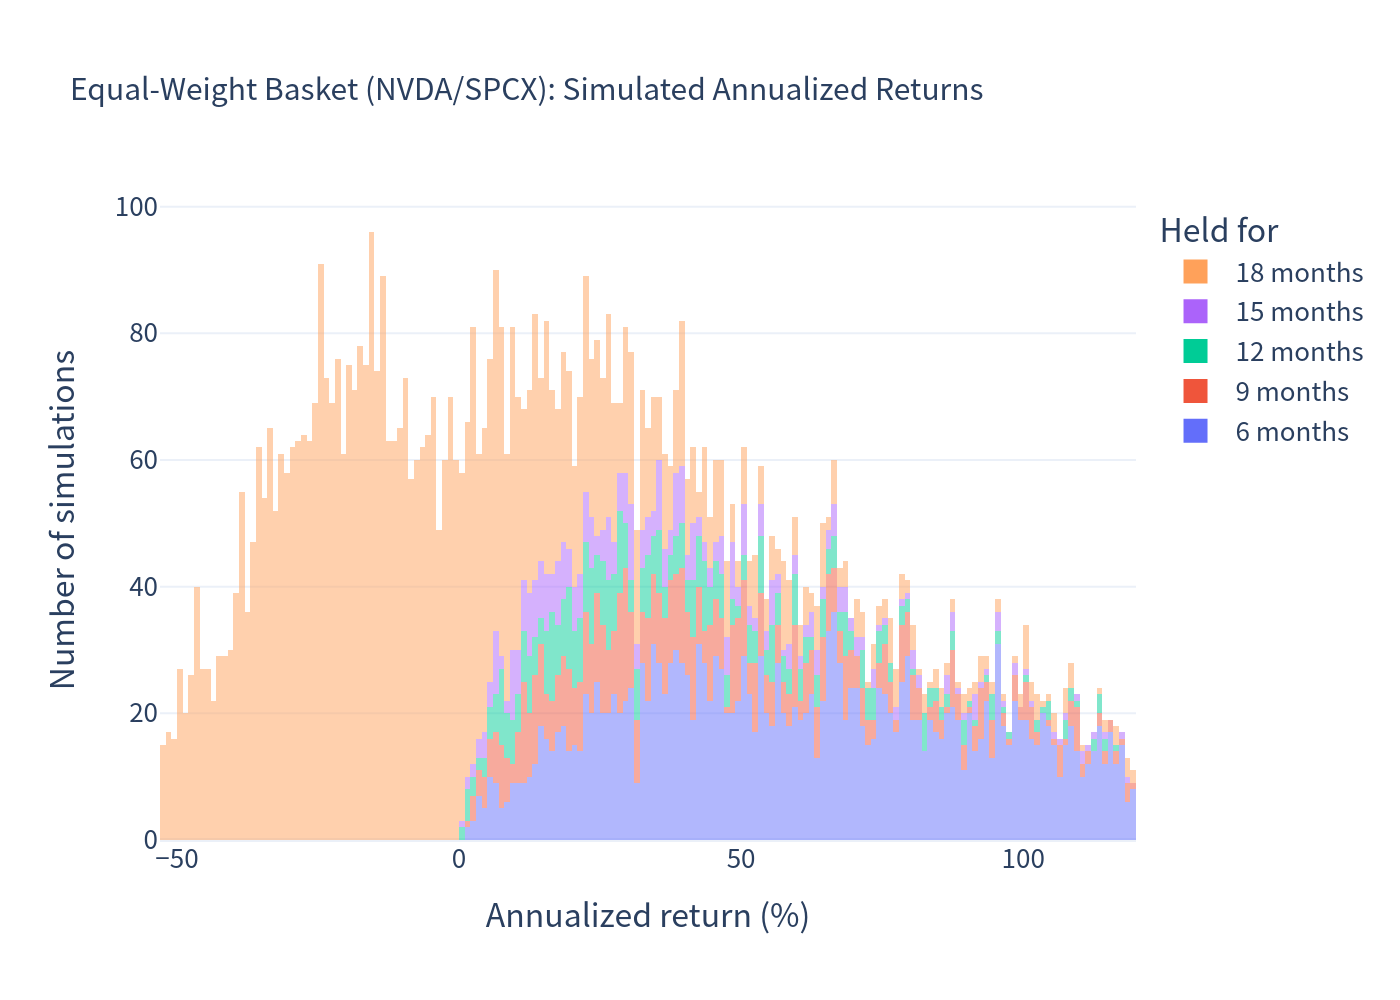
Long right tail (5% of paths above +200%); the left tail is comparable in depth to the product's, which is why the note does not eliminate equity risk.
4.4 Scenario probabilities
4.5 Risk / return profile
The product converts an ~82%-volatility exposure into a ~21%-volatility exposure, at the cost of giving up the upside and of a mean return slightly below the CHF money-market rate.
4.6 Annualized return distributions
4.7 Holding period and coupon count probabilities
5. Sensitivities
| Scenario | E[total return] (%) | E[annualized] (%) | Median annualized (%) | Volatility (%) | P(loss) (%) | 99% VaR (%) | P(barrier) (%) | E[months] |
|---|---|---|---|---|---|---|---|---|
| Base case (issuer call modelled; SpaceX vol 83.3%) | -5.92 | -1.38 | 11.83 | 20.96 | 31.81 | -57.09 | 41.08 | 12.67 |
| SpaceX volatility normalised to 60% p.a. | -1.33 | 2.10 | 11.83 | 17.48 | 26.03 | -47.95 | 29.51 | 12.59 |
| Product never called by the issuer | -4.42 | -4.23 | 11.67 | 21.49 | 38.94 | -57.09 | 48.11 | 18.00 |
The result is sensitive to the volatility of the SpaceX leg, which has only four months of trading history: at a normalised 60% volatility the expected return turns slightly positive (+2.10%) and the probability of a negative return falls to 26.03%.
6. Investment Commentary
Attractive features
- The headline coupon is high relative to CHF cash. 12.00% p.a. versus a CHF money-market rate of about 0.0% — the note yields roughly 12 percentage points more per year than 18-month CHF cash, paid in six quarterly instalments.
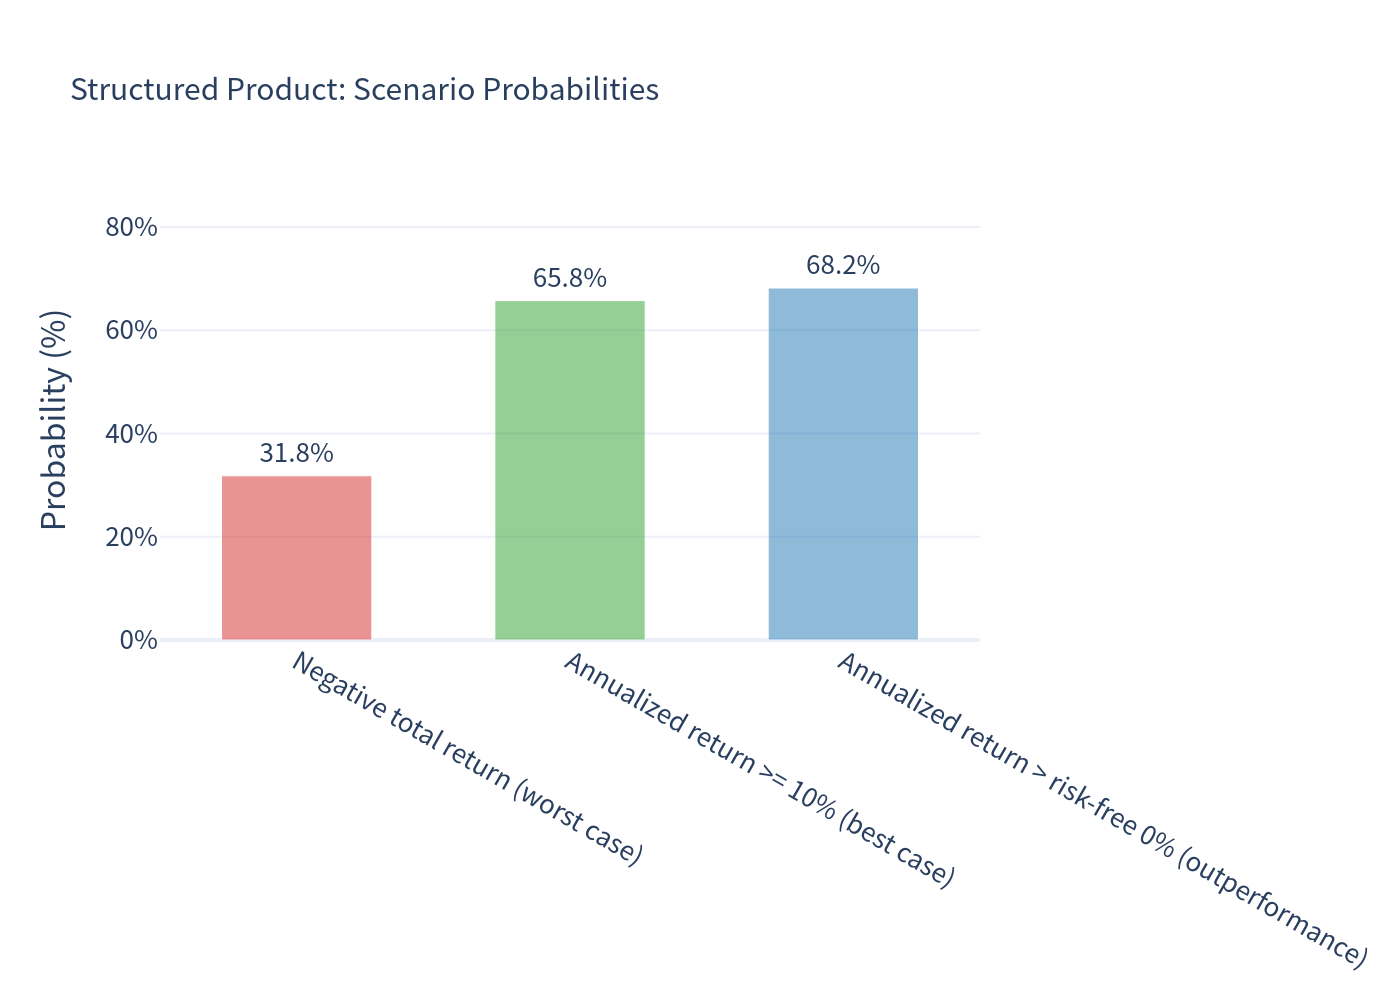
- The coupon is unconditional. Coupons are paid even if the barrier is breached; only the redemption amount carries risk. In 65.75% of simulations the investor earns at least 10% annualized and in 68.19% of simulations the return beats the risk-free rate.
- Wide 49% barrier with a 1.5-year cap on tenor. A stock must fall more than 51% and be traded at that level before it can damage the redemption — and the worst case is limited to holding the worse of two large-cap technology names, not to a total loss of capital in normal market conditions.
- Quanto structure removes currency risk on top of the equity exposure, and the maximum tenor is short (18 months), with four chances to be repaid early at par plus coupon.
- Volatility reduction is substantial. Annualized return volatility of 20.96% against 81.65% for simply holding the two stocks equally weighted; the median annualized return (11.83%) is delivered with one quarter of the dispersion.
Risks and drawbacks
- The mean is below the risk-free rate. The 12% coupon is the price of the worst-of put the investor sells, not extra expected return: the simulated expected total return is -5.92% and the expected annualized return -1.38%. The bulk of the payoff sits in a minority of adverse paths.
- Asymmetric, "called when winning" structure. Every early redemption locks in a modest, certain gain (+6% to +15%), while paths that are not called — i.e. exactly those where the stocks are struggling — are the ones that carry the -21.81% average loss at maturity. The investor keeps the risk precisely when the position is losing.
- Worst-of, low-correlation exposure doubles the risk. Knock-in needs only one of the two names to breach 49% (realised correlation 0.20, and 0.26 across the simulated paths). The probability of a barrier event is 41.08%, and the 1% worst case is -57.09% annualized — a deeper tail than the underlying basket itself (-51.54%), because the investor is short a put on the worse performer.
- SpaceX is a very young, extremely volatile listing (83% annualized volatility since its June 2026 IPO, with single months of -37% and +33% already observed, and lock-up expiry still ahead). Model risk on this leg is material — a normalised 60% volatility already shifts the expected return by roughly 3.5 percentage points.
- No upside participation: the return is capped at +18.00% in the best case, whereas 25% of basket paths return more than roughly +75% annualized.
- Dividends are forgone (NVIDIA 0.47%, SpaceX none) and the investor is exposed to the credit risk of the issuer (Leonteq, BBB-) for the entire term.
Simulated with 10,000 monthly Monte Carlo paths over the 18-month term, applying the contractual payoff, the continuous 49% knock-in and the issuer's discretionary call. Values are in index points, 100 = par.