
7.00% p.a. Multi Barrier Reverse Convertible — Simulation Report
Headline Simulation Results
| Headline metric | Result |
|---|---|
| Expected annualized return | 3.83% |
| Probability of a negative return | 12.86% |
| 99% confidence VaR (1 year) | −27.40% |
| Expected total return over realized holding period | 4.79% |
| Expected holding period | ~18.1 months (1.5 years) |
| Average number of coupons received | 6.02 (of 8) |
Over 10,000 simulated scenarios the product delivers a positive total return in ~87% of cases and redeems at par with full coupon collection when no barrier loss occurs. The expected annualized return of 3.83% reflects the 7.00% p.a. coupon minus the effect of (i) early issuer calls, which stop the coupon stream after ~4–7 payments, and (ii) tail scenarios in which the 60% barrier is breached and the investor receives the worst-performing index below par.
Basic Product Information
How it works
- The investor buys a CHF 1,000 certificate linked to the worst of three equity indices: European banks (SX7E), the S&P 500 and the Swiss SMI.
- In exchange for giving up upside participation, the product pays a fixed quarterly coupon of 1.75% (7.00% p.a.) regardless of how the indices perform, as long as the product is still alive.
- The invested capital is protected unless one of the three indices falls to or below 60% of its starting level at any time during the 2-year observation window ("barrier event"). If no barrier event occurs, the investor gets 100% back at maturity (plus all coupons).
- If a barrier event does occur, redemption at maturity depends on the worst-performing index: if it finishes below 100% of its start level, the investor receives Denomination × worst performance (a capital loss); otherwise par is returned.
- The issuer may call (redeem) the product early at four quarterly observation dates starting after 1 year. When called, the investor receives par plus that period's coupon and the product ends (no further coupons). The simulation assumes the issuer calls whenever all three indices are at or above their starting levels on an observation date (an economically rational call policy — see assumptions).
Key Statistics — Structured Product vs Underlying Basket
Benchmark: equal-weighted basket of the three underlying price indices (not the worst-of), shown on a total-return basis (dividends reinvested) over the same holding horizon as each product scenario.
| Metric | Structured product | Underlying basket (total return) |
|---|---|---|
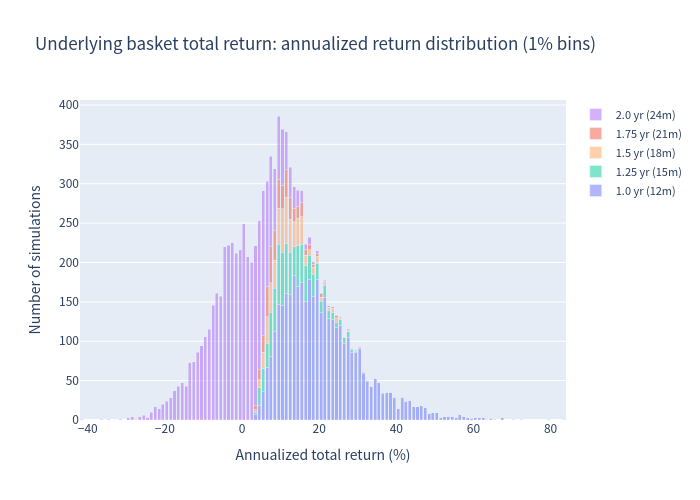
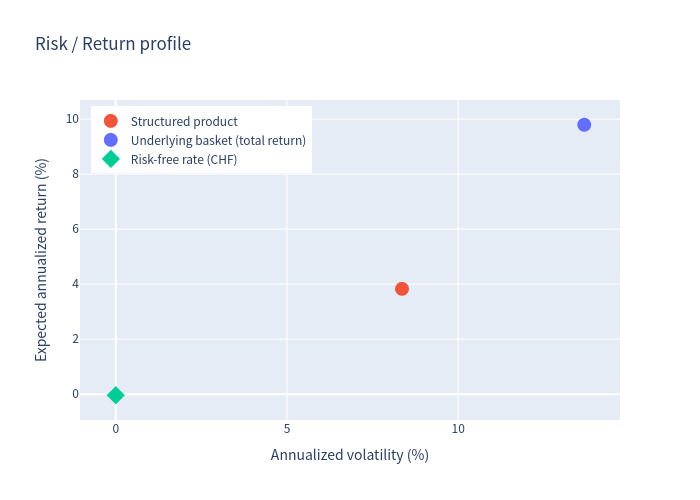
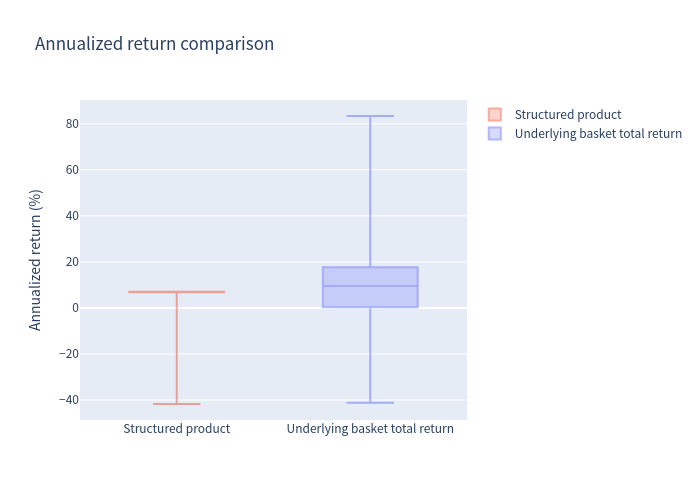
| Expected annualized return | 3.83% | 9.80% |
| Expected annualized volatility | 8.36% | 13.68% |
| Probability of loss | 12.86% | 24.15% |
| 99% confidence VaR (1 year) | −27.40% | −19.29% |
| Expected total return (realized holding period) | 4.79% | 10.29% |
| Expected holding period | 18.05 months | 18.05 months |
Simulation Charts
Simulated outcomes: product vs underlying basket
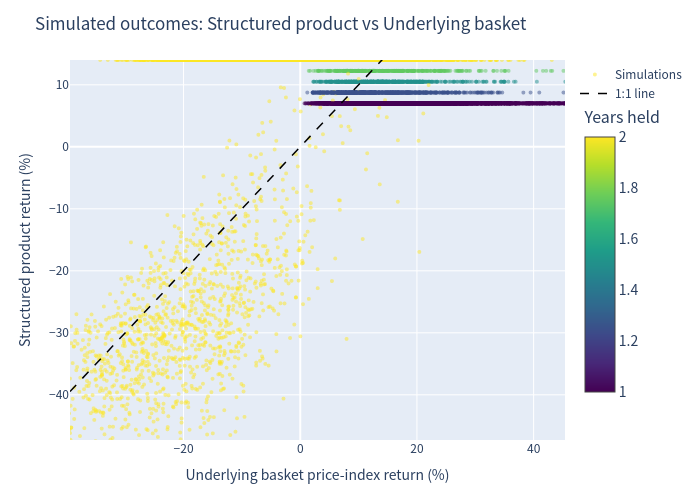
Scatter of per-scenario total returns (x = basket price-index return, y = product return, colour = years held) with a 1:1 reference line. Points below the line are cases where the product underperformed simply holding the basket. The coupon-only ceiling (product total return capped between roughly +7% and +14%, depending on when the product is called) is clearly visible as a horizontal band, as is the downside tail along the diagonal in barrier-loss scenarios.
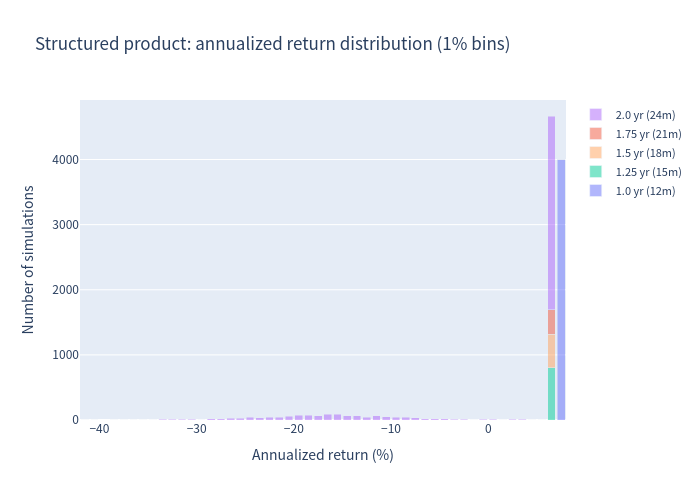
Annualized return distributions (1% bins, stacked by holding period) — Structured product
Annualized return distributions (1% bins, stacked by holding period) — Underlying basket
Risk / return profile
Annualized return box plot
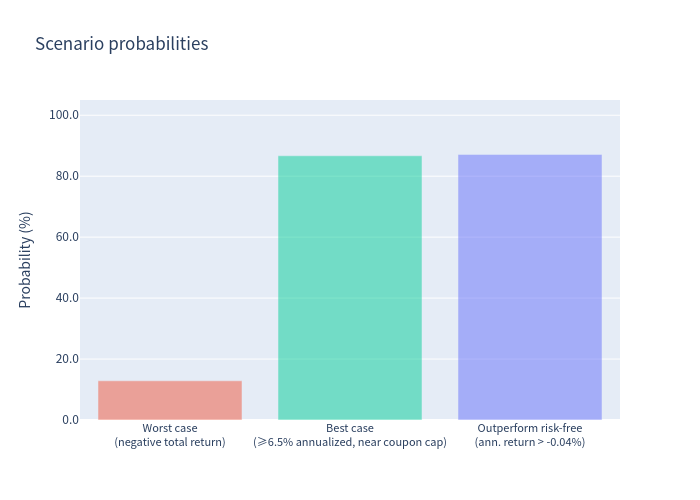
Scenario probabilities
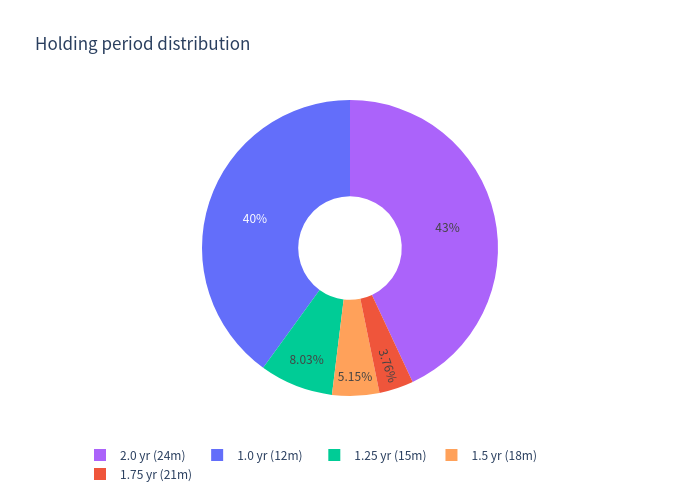
Holding period outcomes
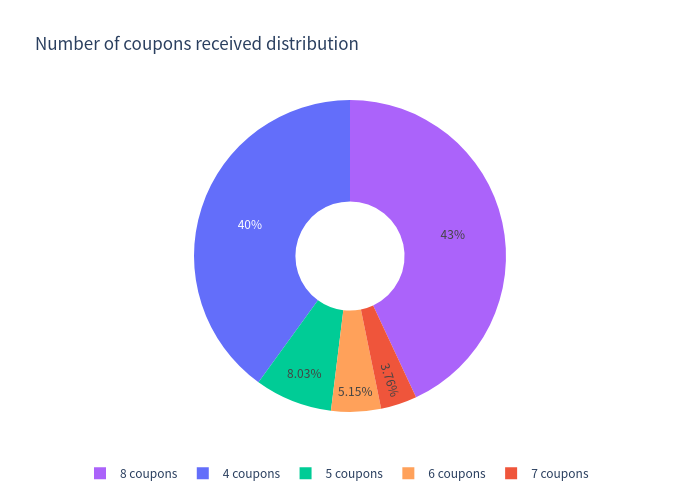
Coupon outcomes
Outcome Breakdown
| Outcome | Probability |
|---|---|
| Early redemption (issuer call) — product ends before maturity | 56.96% |
| – called after 12 months (4 coupons) | 40.02% |
| – called after 15 months (5 coupons) | 8.03% |
| – called after 18 months (6 coupons) | 5.15% |
| – called after 21 months (7 coupons) | 3.76% |
| Held to full 24-month maturity (8 coupons) | 43.04% |
| Barrier event (any index ≤ 60% at any monthly observation) | 14.20% |
| Negative total return | 12.86% |
| Best case — annualized return ≥ 6.5% (near coupon cap) | 86.70% |
| Outperforming the risk-free rate | 87.15% |
Comment on variable holding periods
~57% of simulations are called early, most often after exactly 12 months, locking in a +7.0% total return (par + 4 coupons). The 43% held to maturity are, by construction, scenarios where at least one index stayed below its start level through the observation dates; within that group ~31% experience a barrier event and the average maturity redemption is 86.66 points, giving an average maturity total return of just +0.66% (the 14 coupon points minus barrier losses). Losses on the product are therefore concentrated in the barrier/maturity bucket: the probability of loss given the product runs to maturity is ~29.9%, versus 0% for called scenarios.
Investment Commentary
Pros
- Attractive nominal coupon (7.00% p.a., paid quarterly) with a high probability (~87%) of collecting a meaningful number of coupons — average 6.0 payments.
- Conditional downside protection at 60% on all three underlyings: in 85.8% of simulated scenarios no barrier event occurs and capital is returned at par.
- Quanto CHF structure removes currency risk for a CHF investor; SMI component adds domestic exposure alongside USD and EUR beta.
- Probability of a positive return ≈ 87%, and the product has never-negative returns in the called scenarios; worst realised tail loss (~−66% total, ~5th percentile −33.6%) only occurs after a 60% barrier breach.
Cons
- Upside fully capped — expected annualized return (3.83%) is far below the expected total return of simply holding the underlying basket (9.80%), which is the opportunity cost in a rising market.
- Issuer call works against the investor: the product is called precisely when all indices are high, truncating the coupon stream (57% of scenarios end after 4–7 coupons instead of 8).
- Worst-of and any-of barrier design: a barrier event needs only one index to fall 40%, and maturity losses are then tied to the worst index — the left tail (99% VaR −27.40%) is deeper than the basket's.
- Credit risk of the issuer (Leonteq Securities AG, Fitch BBB-).
Key modelling assumptions
- Issuer call exercised at the first observation date where all three indices are at or above their initial fixing levels (rational issuer policy; the term sheet grants the issuer discretion).
- Barrier monitored on monthly simulated levels (a discretisation of the continuous daily barrier, which may understate barrier-event frequency).
- Benchmark dividend yields applied on a non-compounded basis for total-return comparison.