
15.00% p.a. Multi Barrier Reverse Convertible on Bayer, Eli Lilly & Novo Nordisk
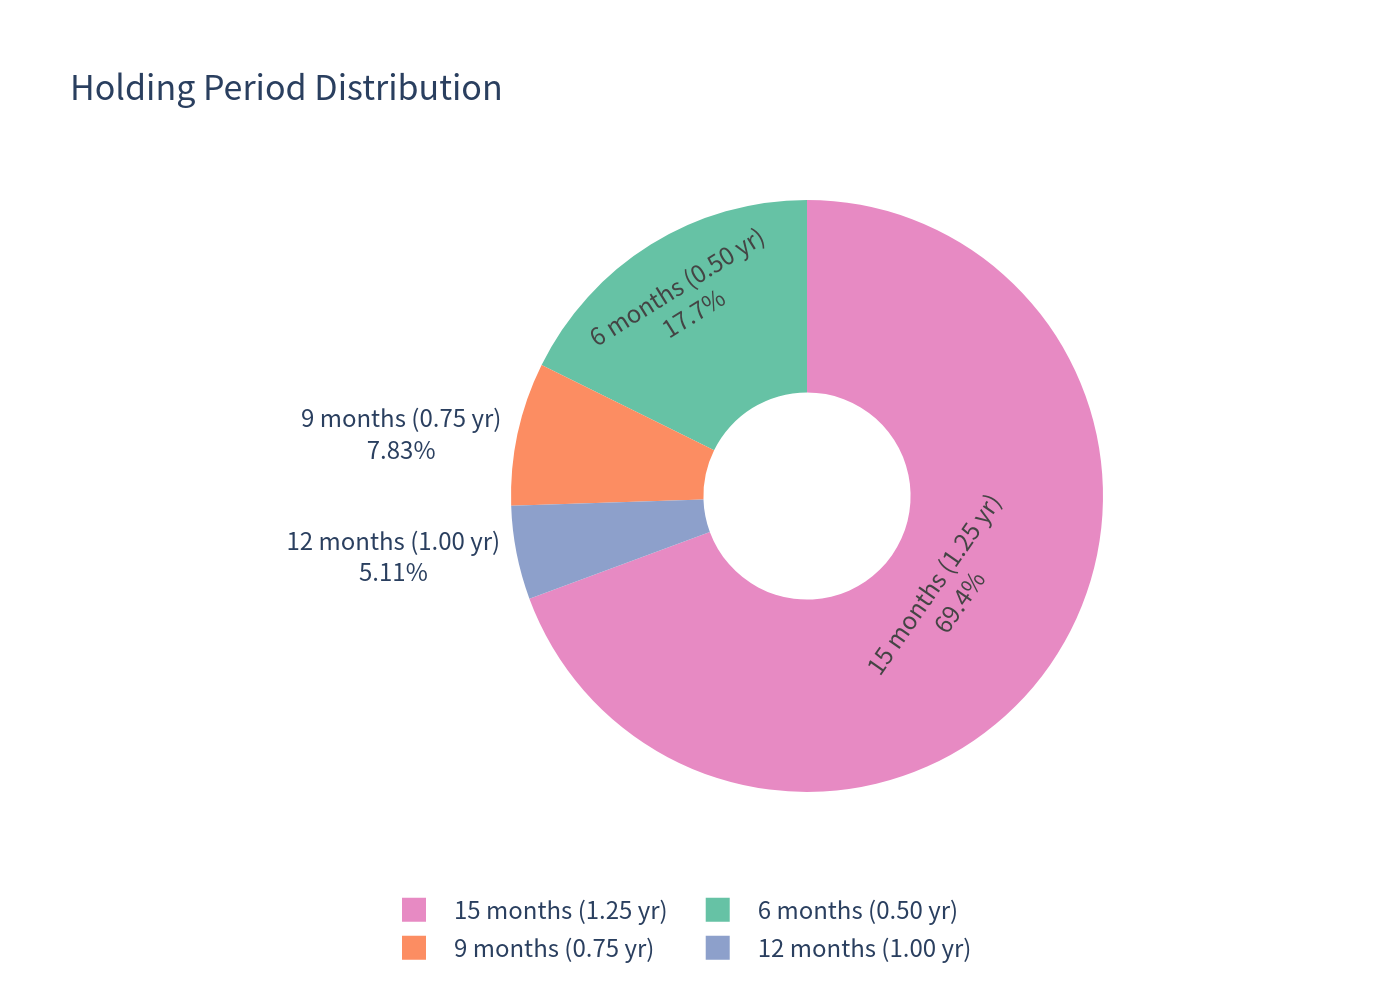
The product offers a high fixed coupon (15.00% p.a., paid quarterly = 3.75% per coupon) with conditional downside protection via a 59% barrier. It is callable by the issuer on three quarterly observation dates. In simulation, the product was called early in 30.6% of scenarios (17.70% at 6 months, 7.83% at 9 months, 5.11% at 12 months) and ran to full maturity in 69.4% of scenarios.
- No Barrier Event → par (100) + all coupons.
- Barrier Event occurred and worst underlying ≥ strike (100) → par (100) + all coupons.
- Barrier Event occurred and worst underlying < strike → delivery of the worst underlying (value = worst performance × 100) + all coupons.
How it works (layman explanation)
You receive a high quarterly coupon (3.75% per quarter) regardless of market moves. Your capital is at risk only if any one of the three pharma stocks falls below 59% of its starting level at any point during the 15-month term. If that never happens, you get your full money back (100) plus all coupons — even if the stocks fell moderately. If the barrier is breached, your redemption at maturity is tied to the worst performing stock: if it is below its start level you receive that stock (equivalently, a loss equal to its decline); if it is at or above its start level you still receive par. The issuer can call the product early, in which case you receive par plus the coupon due on that date.
| Metric | Structured Product | Underlying Basket (price only) | Underlying Basket (total w/ dividends) |
|---|---|---|---|
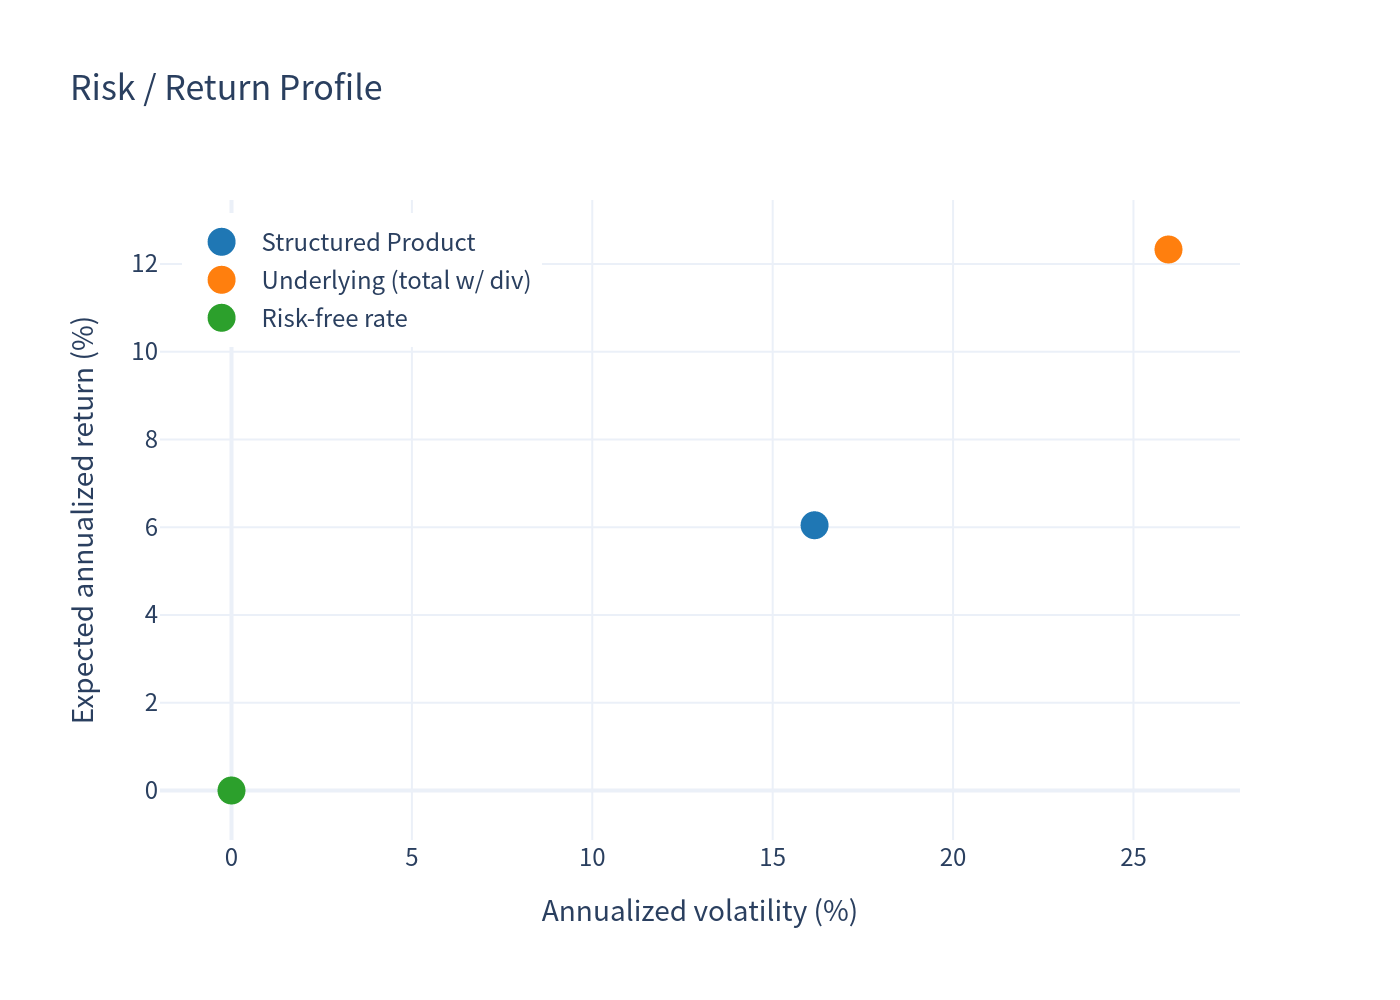
| Expected annualized return | 6.05% | 10.32% | 12.33% |
| Annualized volatility | 16.16% | 26.01% | 25.97% |
| Probability of loss | 23.86% | 39.89% | 36.08% |
| 99% VaR (1 year) | −37.28% | −33.79% | −31.58% |
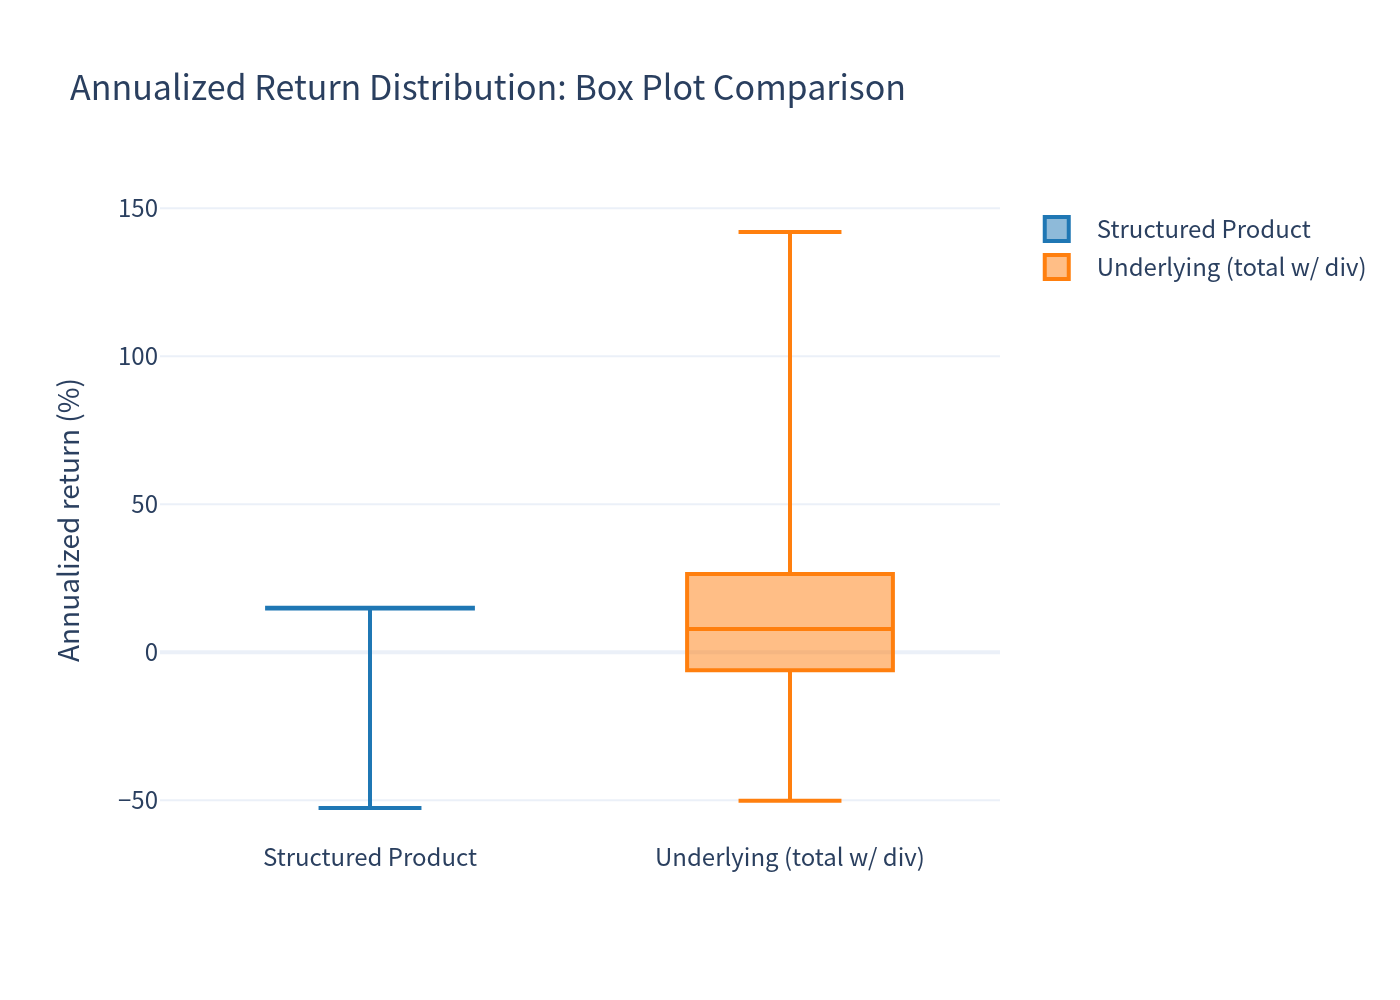
- Best-case total return: +18.75% (held to maturity, par returned)
- Worst-case total return: −60.68% (barrier breached, worst underlying collapses)
- Risk-free rate (CHF): ~0.00%
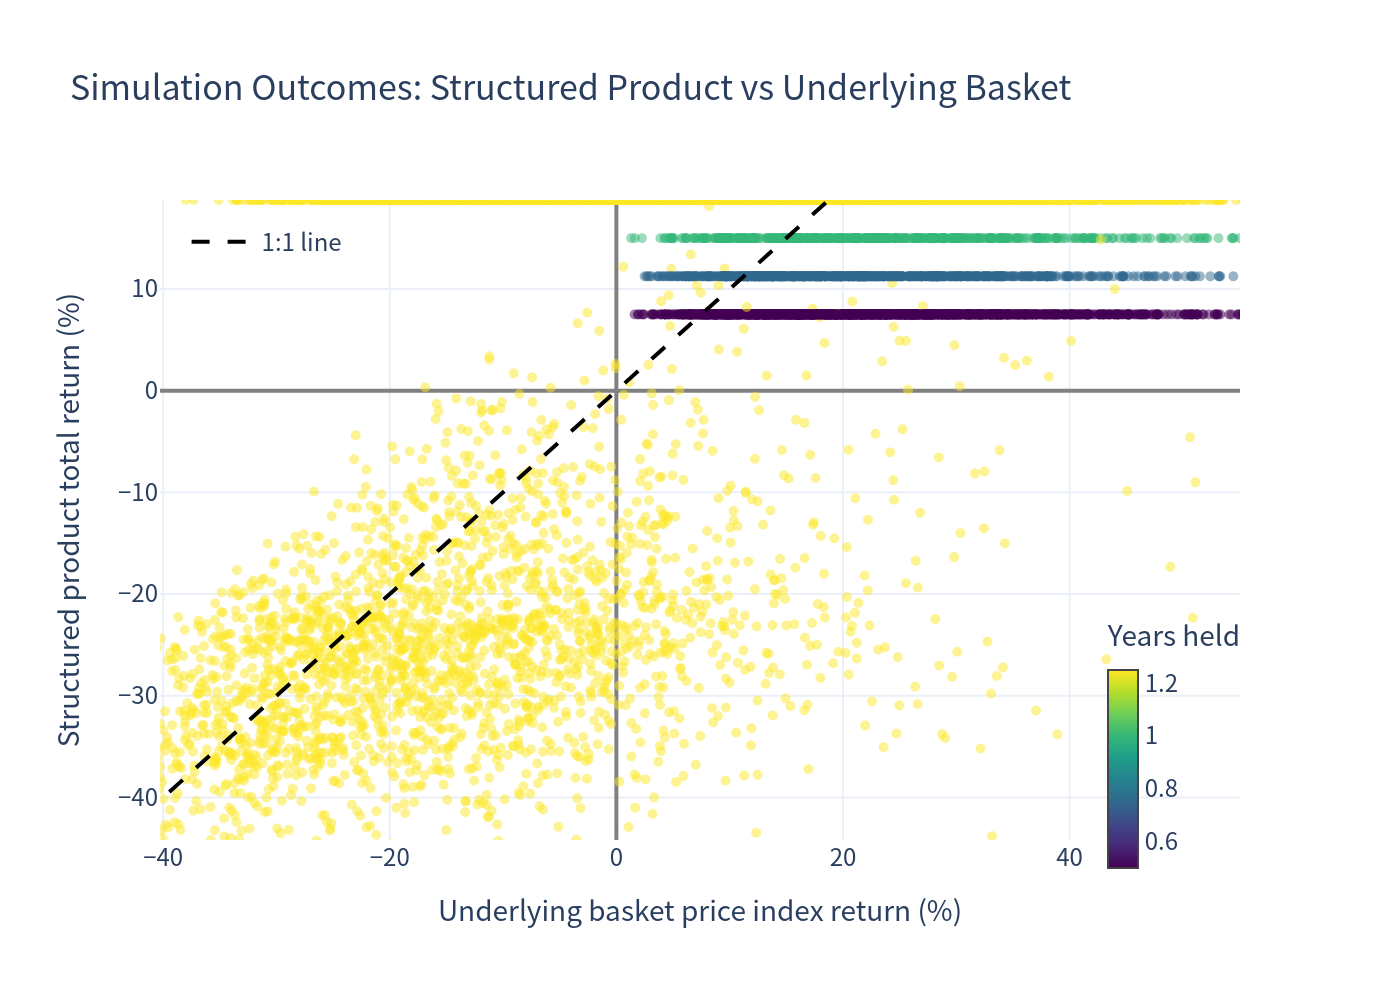
Simulation Outcomes — Structured Product vs Underlying Basket
Scatter of simulated annualized outcomes comparing the structured product against the underlying basket.
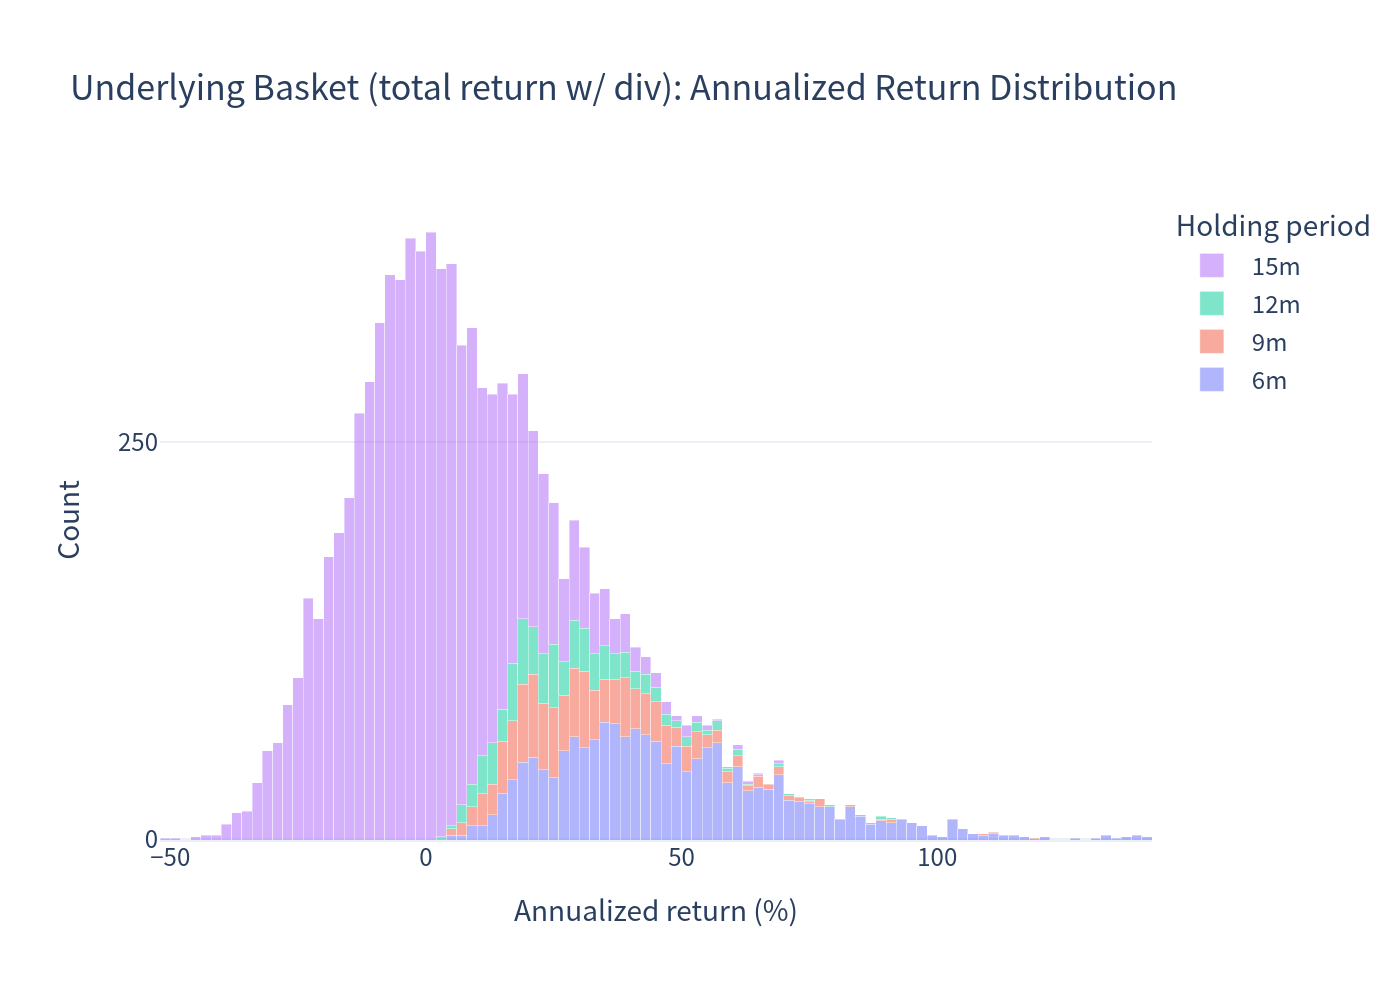
Annualized Return Distribution — Underlying Basket (total return with dividends)
Distribution of simulated annualized returns for the underlying basket, including dividends.
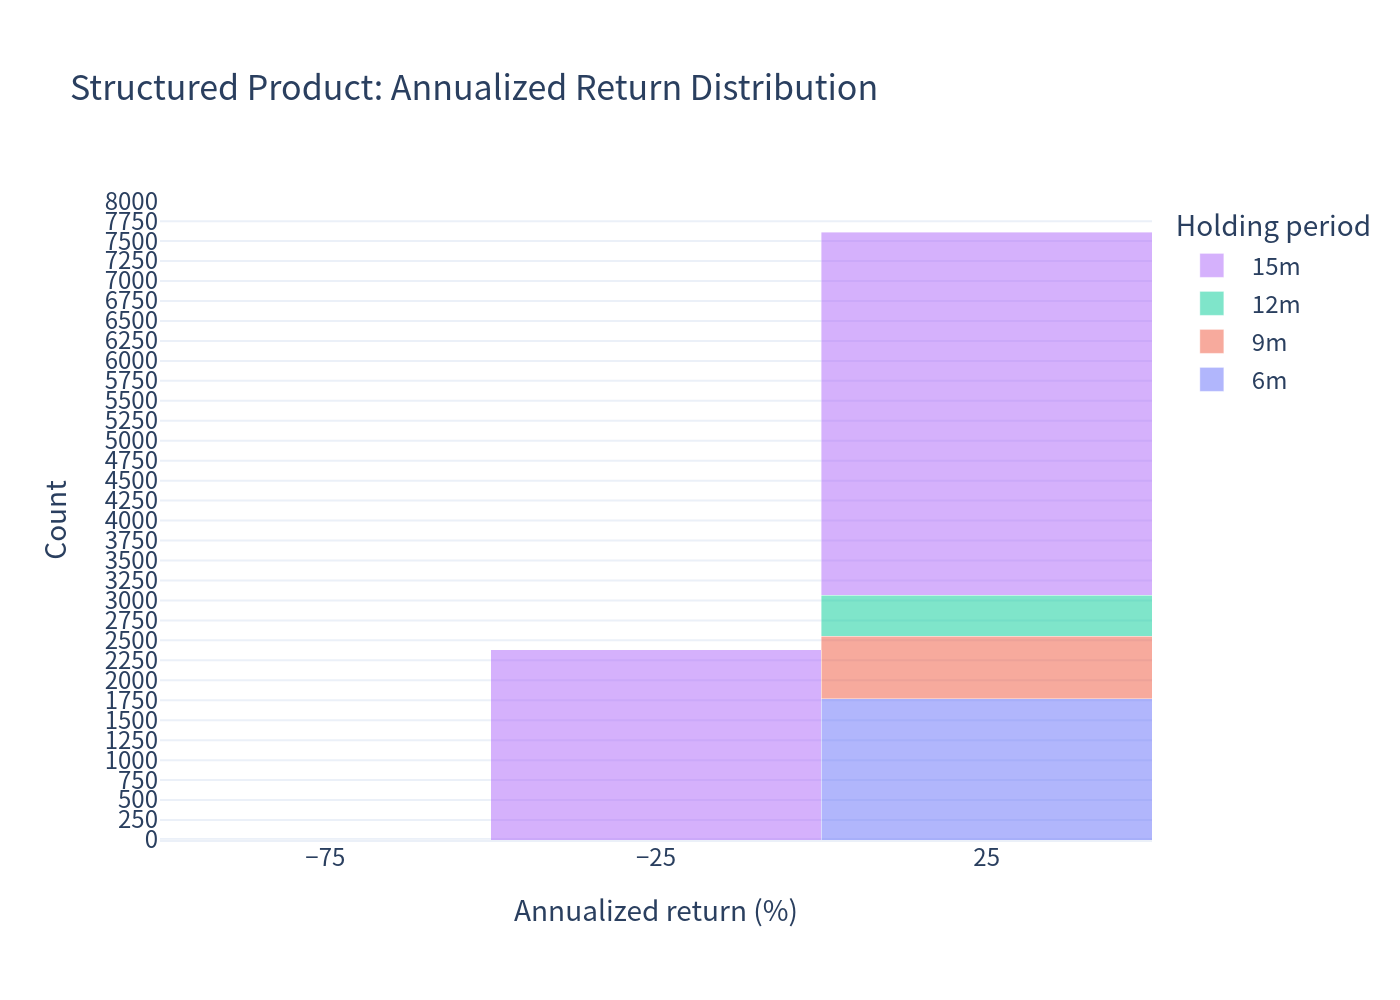
Annualized Return Distribution — Structured Product
Distribution of simulated annualized returns for the structured product, showing the coupon-supported payoff profile.
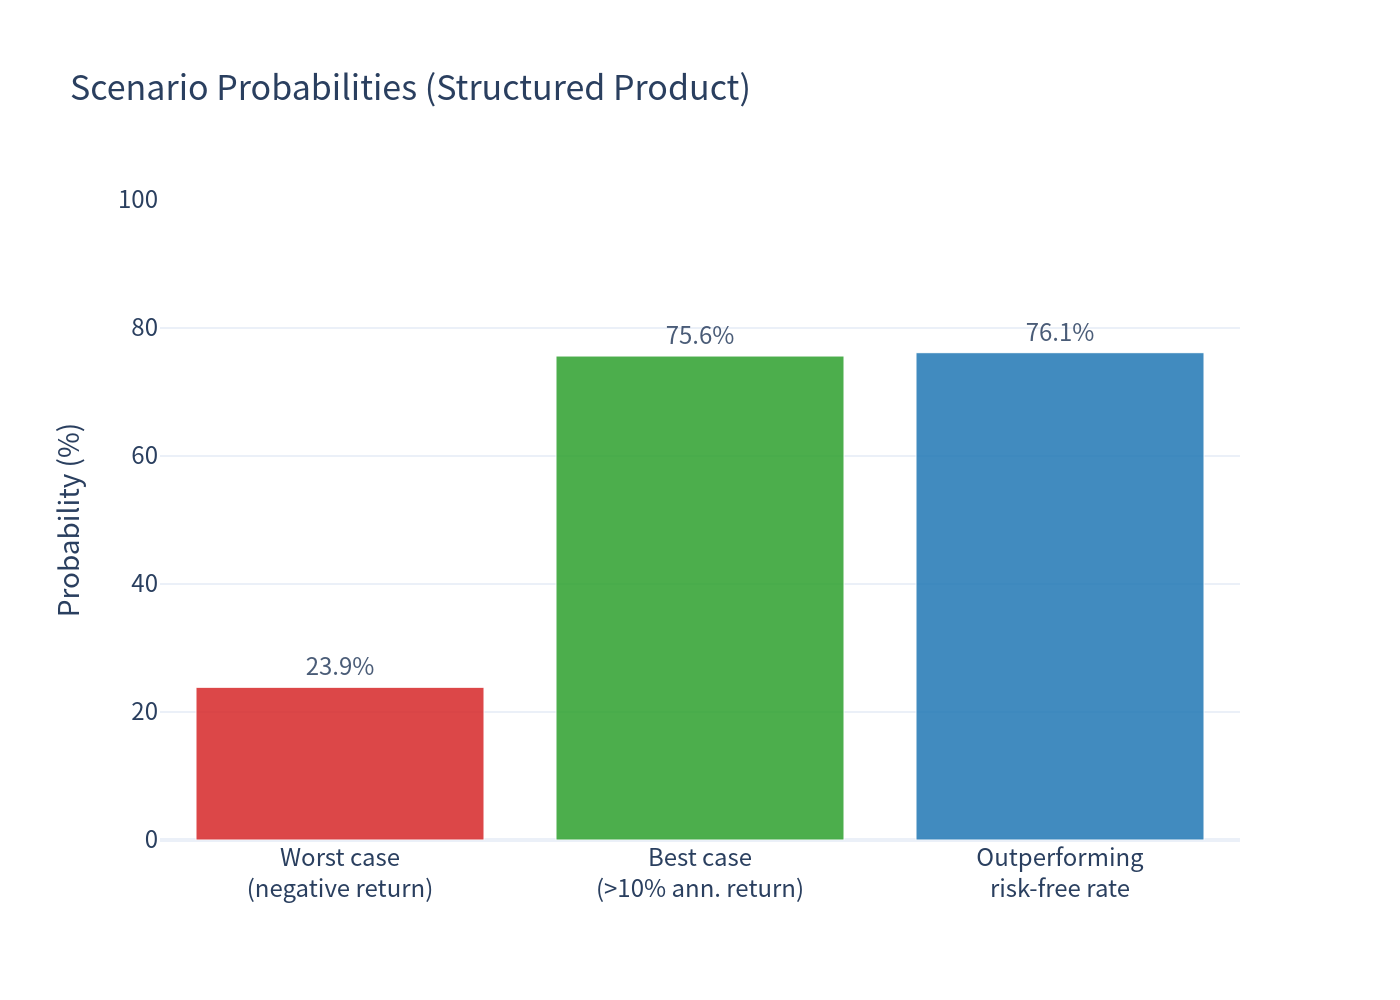
Scenario Probabilities
Breakdown of simulated outcome scenarios, including early call, barrier events and maturity redemptions.
Risk / Return Profile
Risk-return positioning of the structured product relative to the underlying basket and the risk-free rate.
Box Plot Comparison — Annualized Returns
Distributional comparison of annualized returns across product and basket variants.
Holding Period Distribution
Distribution of realized holding periods driven by the issuer call feature and maturity.
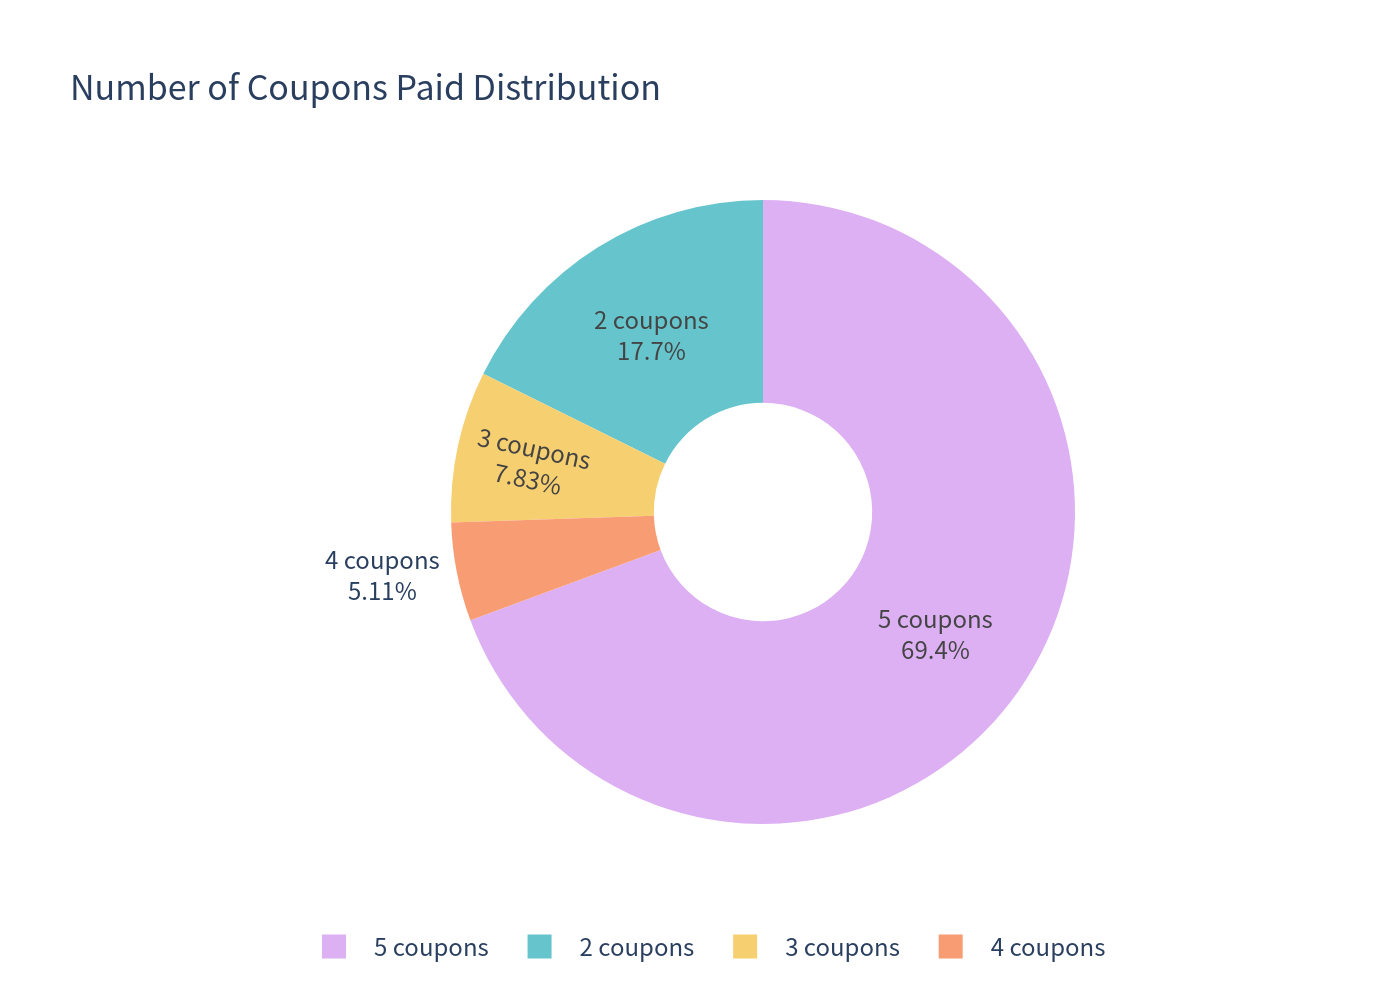
Number of Coupons Paid Distribution
Distribution of the number of coupons actually paid over the life of the product.
Pros (highlights)
- Attractive headline coupon of 15.00% p.a. (3.75% per quarter), paid regardless of underlying performance while the product is alive, including on early redemption dates.
- Conditional protection: a 59% barrier (≈41% cushion per underlying) means moderate market declines do not impair capital; ~65% of maturity scenarios kept full par.
- Quanto CHF structure removes FX risk for Swiss investors despite EUR/USD/DKK-denominated underlyings.
- High probability of positive outcomes: ~76% of scenarios outperform the (near-zero) CHF risk-free rate, and ~76% deliver more than 10% annualized return.
Cons (considerations)
- Capital is not protected; worst-of barrier exposure means a single weak name (e.g., Bayer) can trigger a loss of up to ~60% in extreme scenarios.
- Upside is fully capped — the investor forgoes equity upside beyond the fixed coupon.
- Early call (issuer option) shortens the effective coupon stream; the product was called in ~31% of scenarios, typically after just 6–12 months.
- 99% VaR of −37.28% (1 year) highlights meaningful left-tail risk relative to the modest expected return.
This document is a quantitative analysis of the product mechanics and simulated outcomes. It does not constitute investment advice or a suitability assessment.
Simulated statistics based on 10,000 Monte Carlo paths over the 15-month product horizon.