
Full Report: 10.00% p.a. Multi Barrier Reverse Convertible on Alcon, Bachem, Lonza
2.90%
Expected Annualized Return
25.29%
Probability of Negative Return
-32.10%
99% Confidence VaR (1-year)
Headline Simulation Results
| Metric | Value |
|---|---|
| Expected Annualized Return | 2.90% |
| Probability of Negative Return | 25.29% |
| 99% Confidence VaR (1-year) | -32.10% |
| Expected Holding Period | 15.96 months (1.33 years) |
| Expected Total Return | 1.71 points on 100 notional |
Basic Product Information
Product Description
This is a Multi Barrier Reverse Convertible (SSPA Type 1230) issued by Leonteq Securities AG with guarantee from Aargauische Kantonalbank. It offers a 10.00% p.a. coupon paid quarterly, regardless of underlying performance, while providing conditional downside protection through a 59% barrier.
How It Works (Layman Explanation)
- Investment: Investor pays CHF 1,000 per product (100% of notional)
- Quarterly Coupons: Investor receives CHF 25 (2.5%) every quarter regardless of how the underlyings perform
- Issuer Callable: The issuer can choose to redeem the product early on quarterly observation dates. If called, the investor receives their full CHF 1,000 back plus that quarter's coupon
- Barrier Protection: If none of the three stocks (Alcon, Bachem, Lonza) ever falls below 59% of its initial level during the entire 21-month period, the investor gets full CHF 1,000 back at maturity
- Downside Risk: If any stock breaches the 59% barrier AND the worst-performing stock at maturity is below its initial level, the investor receives shares of that worst stock instead of cash
Product Details
| Underlyings | Alcon Inc., Bachem Holding AG, Lonza Group AG (all SIX Swiss Exchange) |
| Currency | CHF |
| Term | 21 months (July 2026 – April 2028) |
| Coupon | 10.00% p.a., paid quarterly (CHF 25 per quarter per CHF 1,000) |
| Barrier Level | 59% of Initial Fixing Level (Continuous Observation) |
| Strike Level | 100% of Initial Fixing Level |
| Early Redemption | Issuer callable quarterly starting from month 6 |
Key Statistics
| Metric | Structured Product | Benchmark (Equal-Weight Basket) |
|---|---|---|
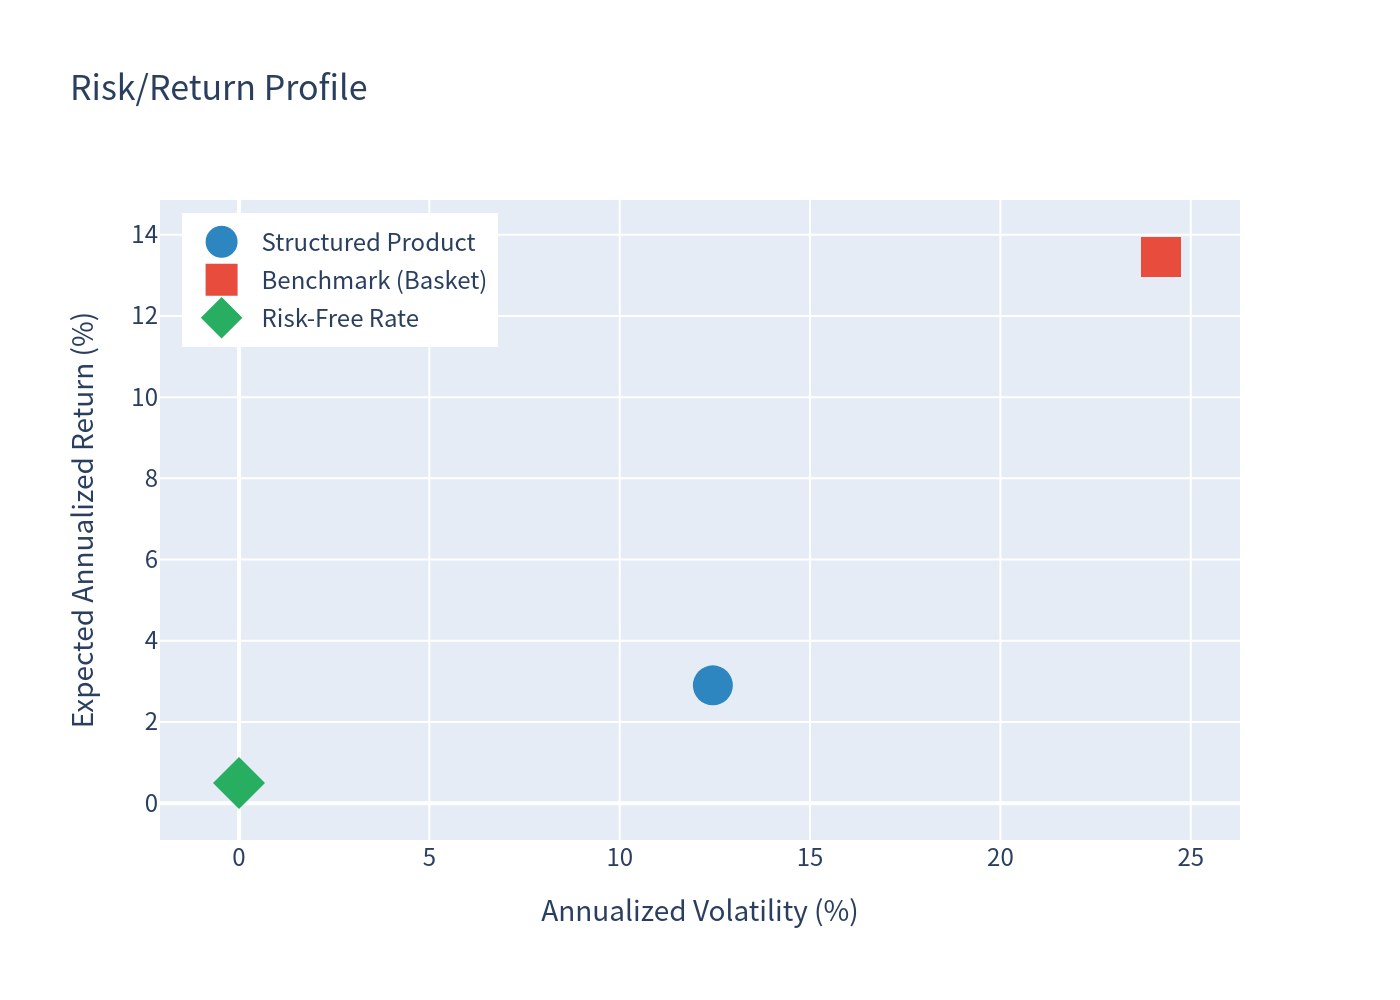
| Expected Annualized Return | 2.90% | 13.45% |
| Expected Annualized Volatility | 12.45% | 24.22% |
| Probability of Loss | 25.29% | 32.89% |
| 99% Confidence VaR (1-year) | -32.10% | -25.98% |
Note: Benchmark returns include dividend yields (avg. 0.88% for the basket). The benchmark is an equal-weight basket of the three underlying stocks.
Simulation Outcomes
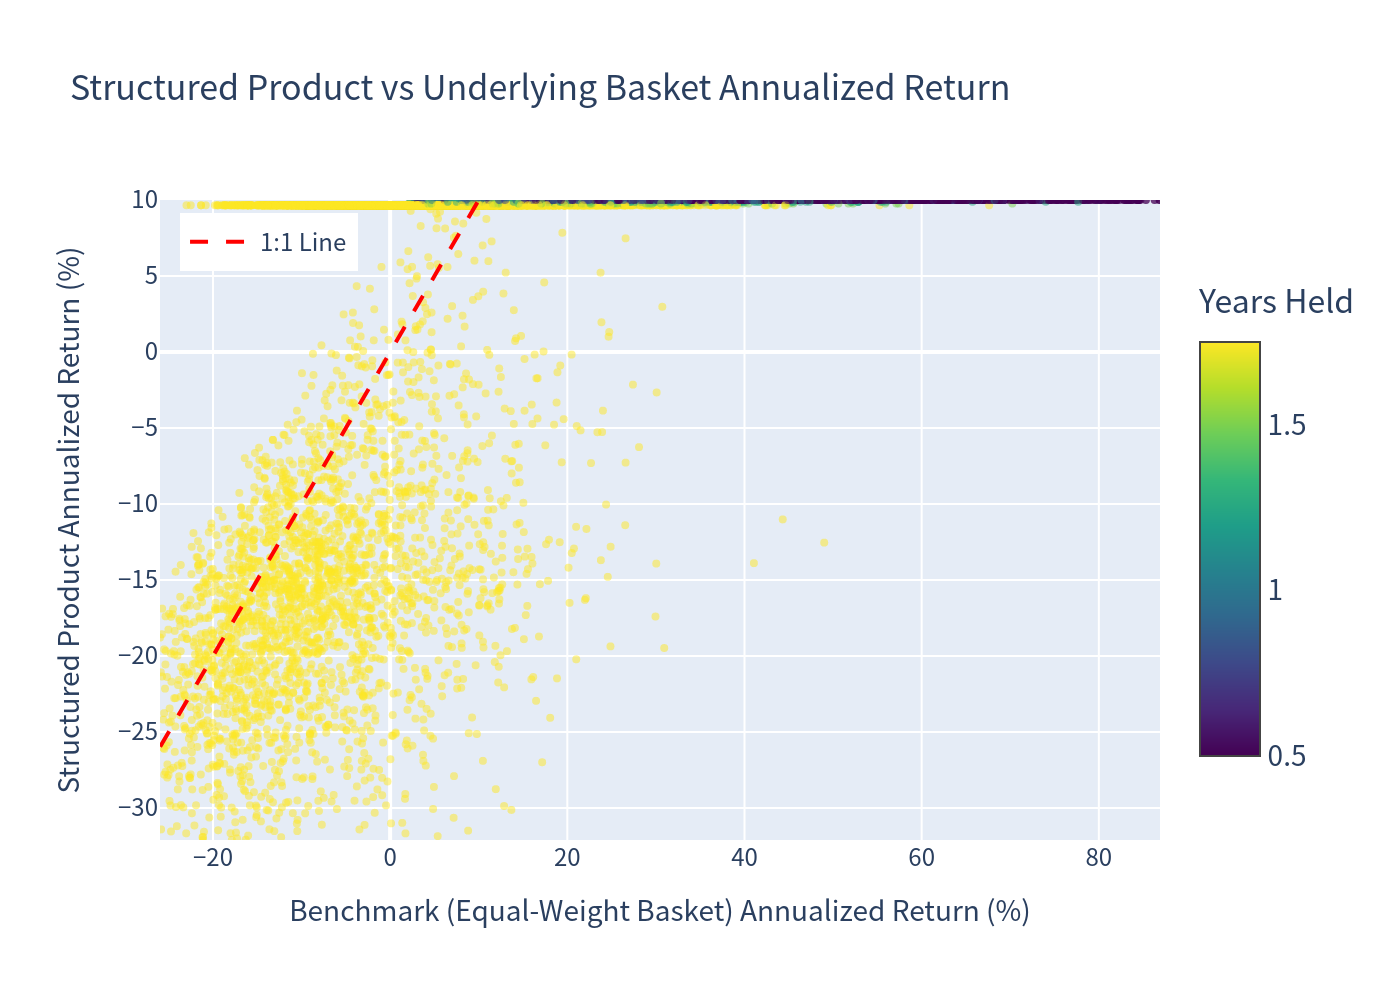
Scatter Plot: Product Return vs Benchmark Return
Each point represents one simulation. Color indicates how many years the product was held. The red dashed line is the 1:1 line — points above it show the product outperforming the benchmark.
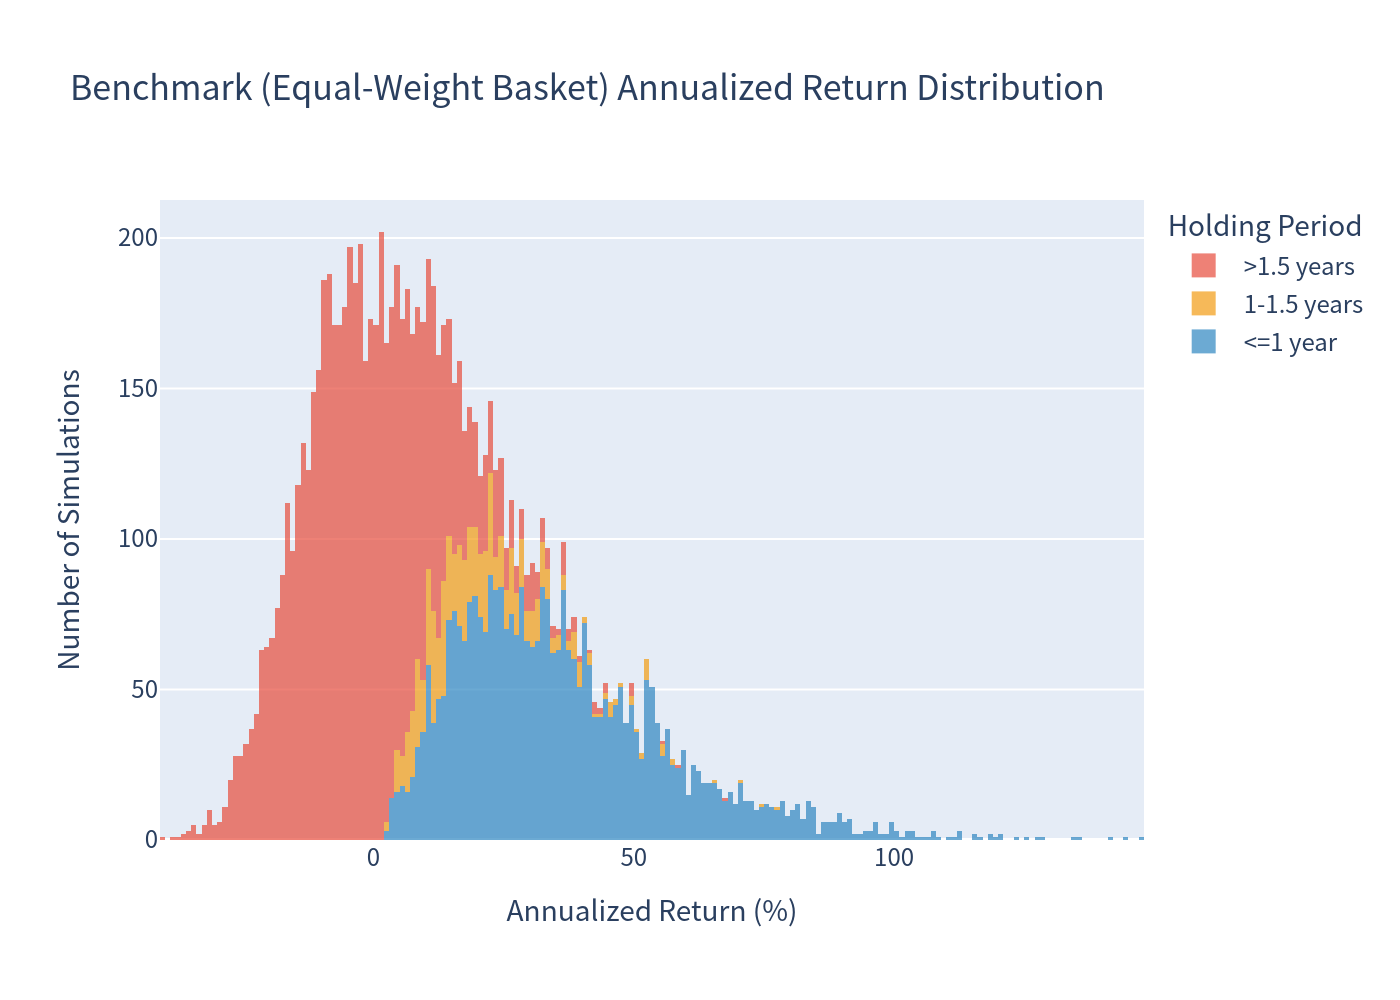
Annualized Return Distribution – Benchmark
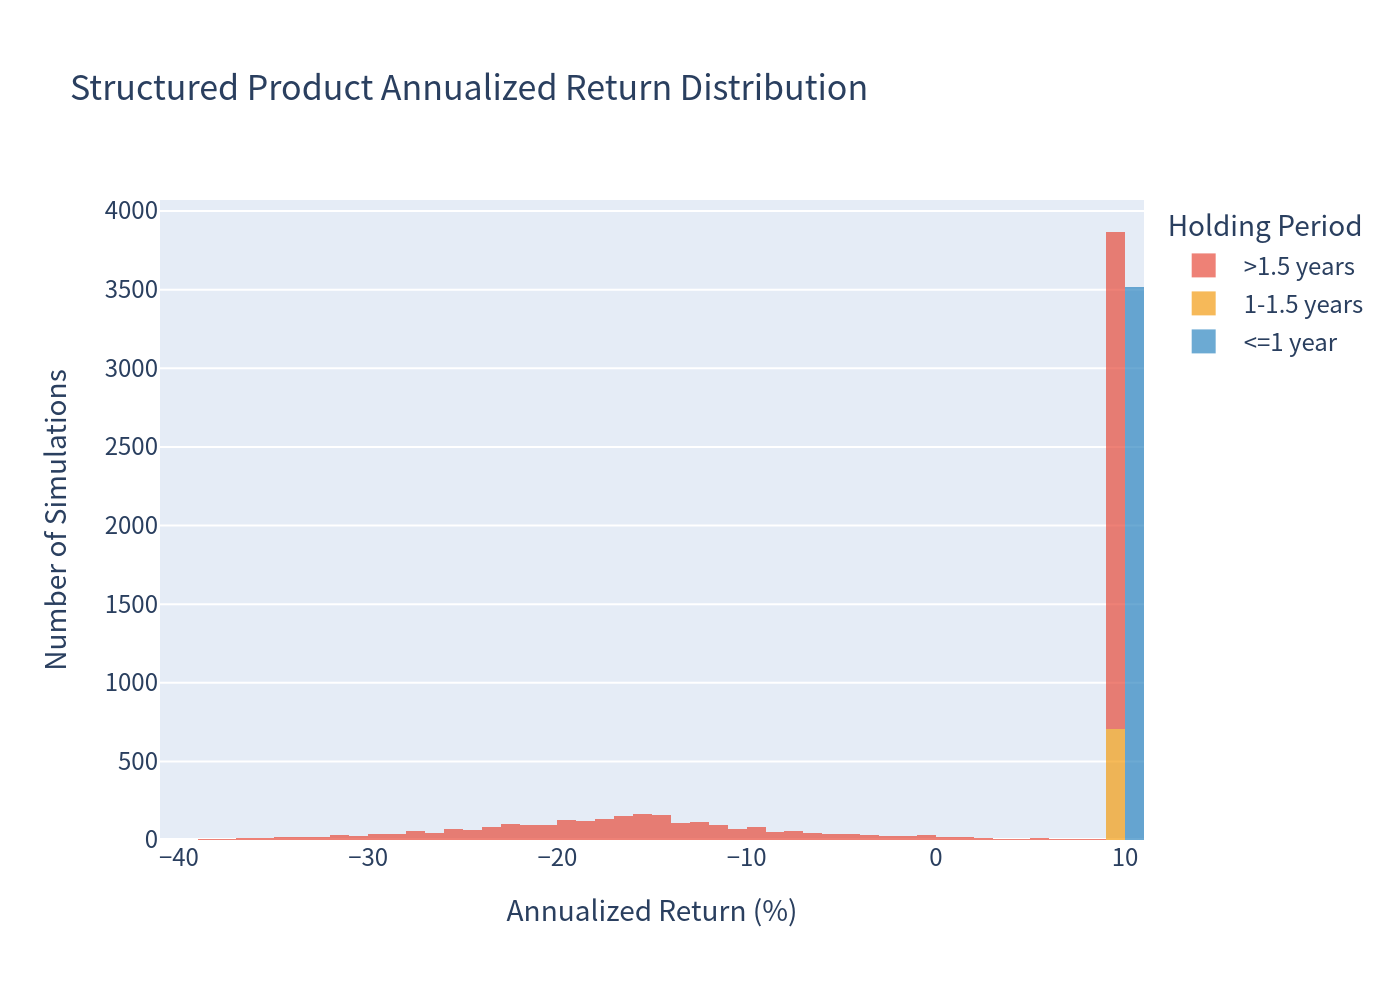
Annualized Return Distribution – Structured Product
Risk/Return Analysis
Risk/Return Profile
Box Plot Comparison
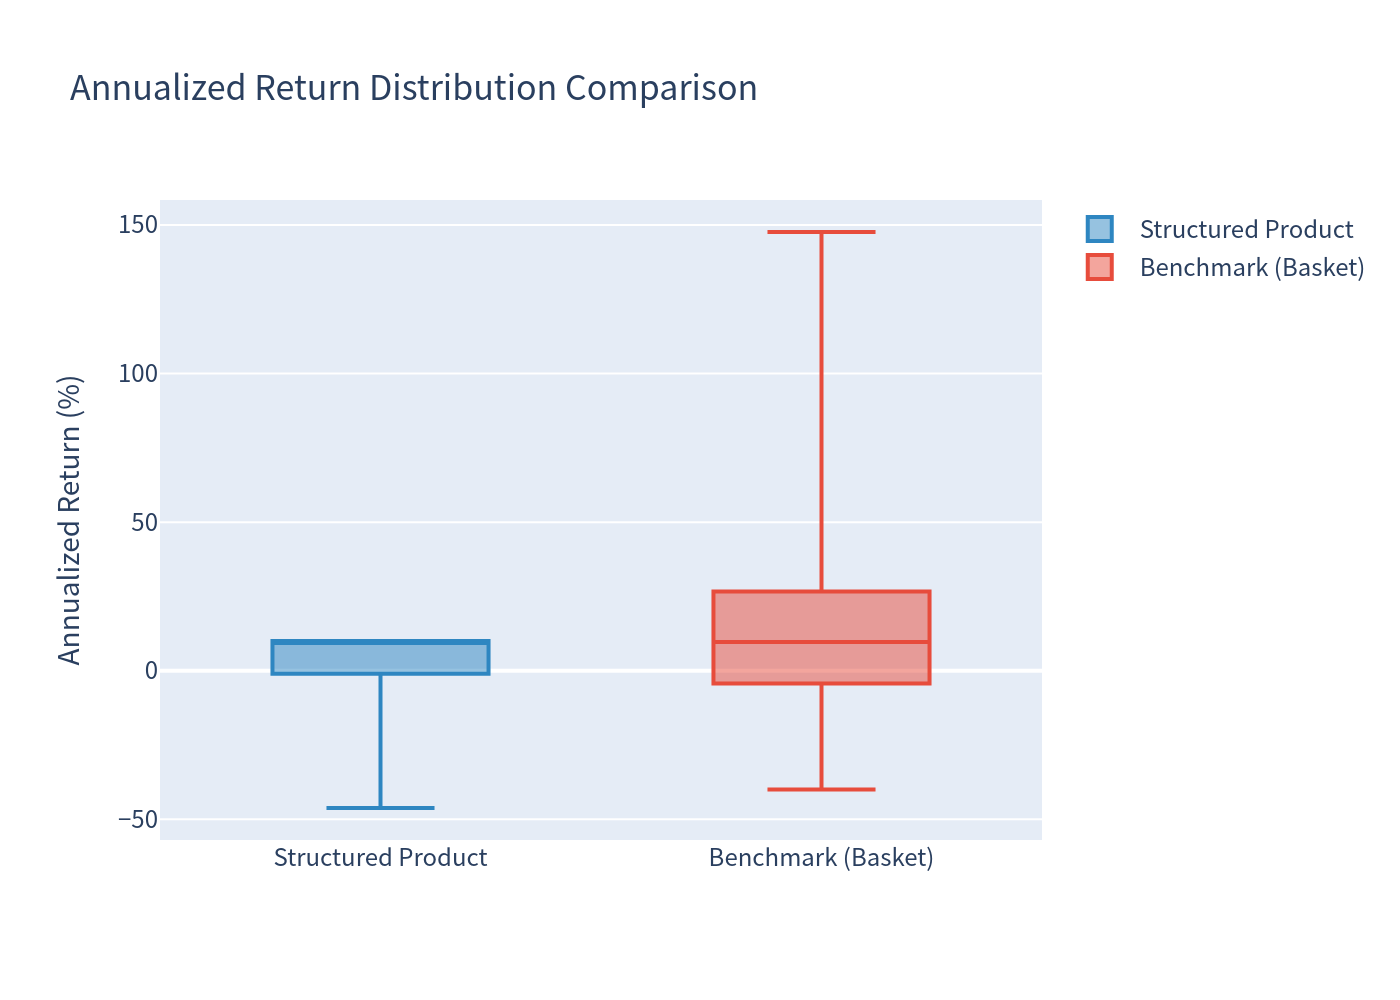
Scenario Analysis
Scenario Probabilities
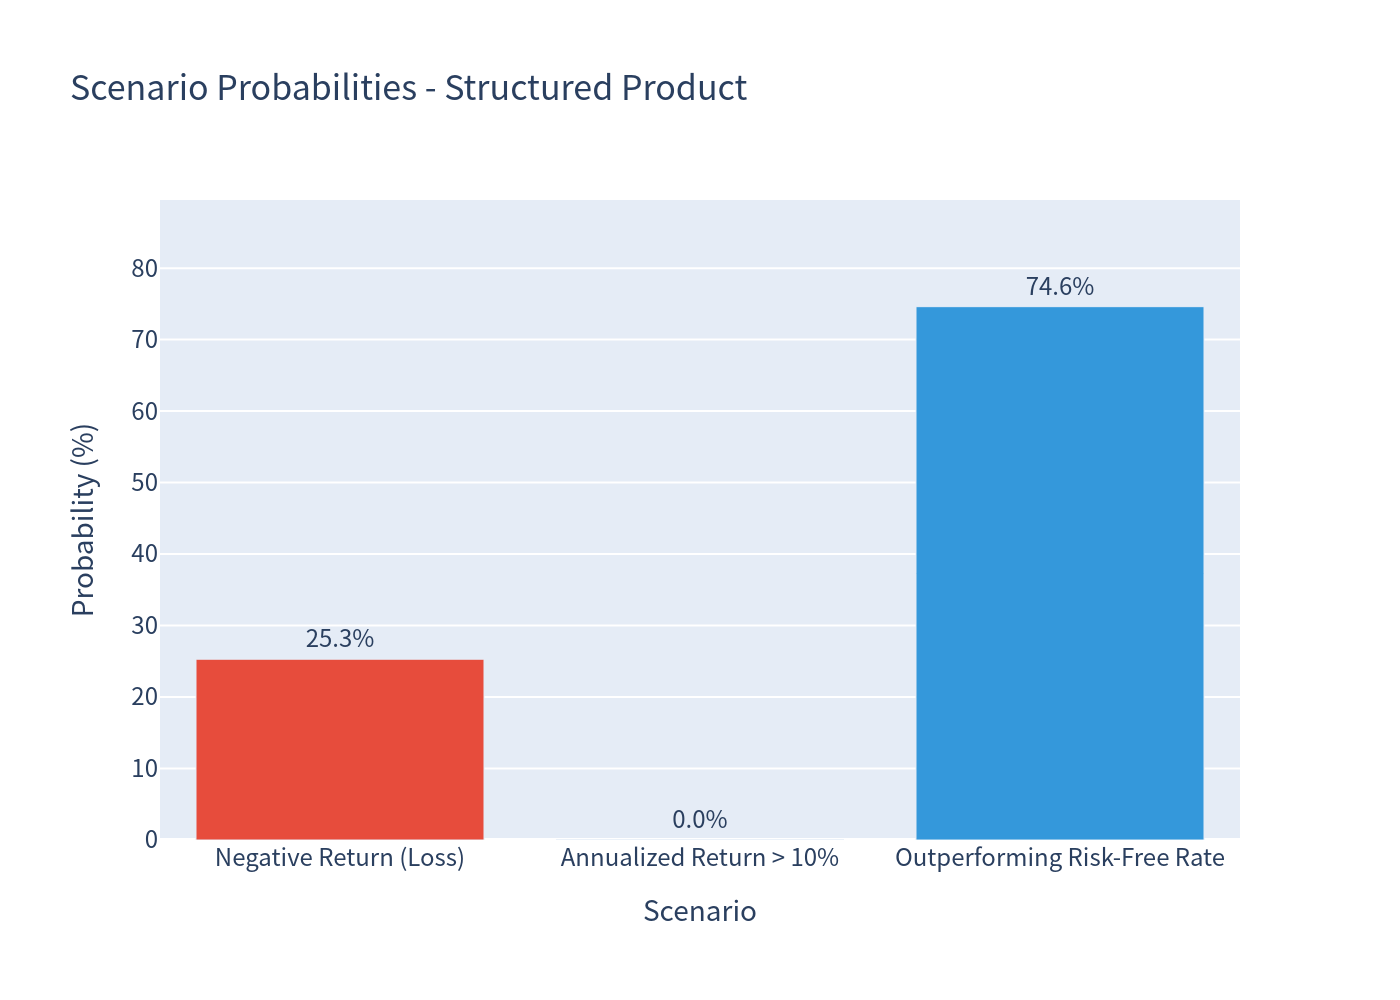
25.29%
Probability of Negative Annualized Return
21.51%
Probability of Annualized Return Exceeding 10%
51.44%
Probability of Outperforming the Risk-Free Rate
Holding Period Distribution
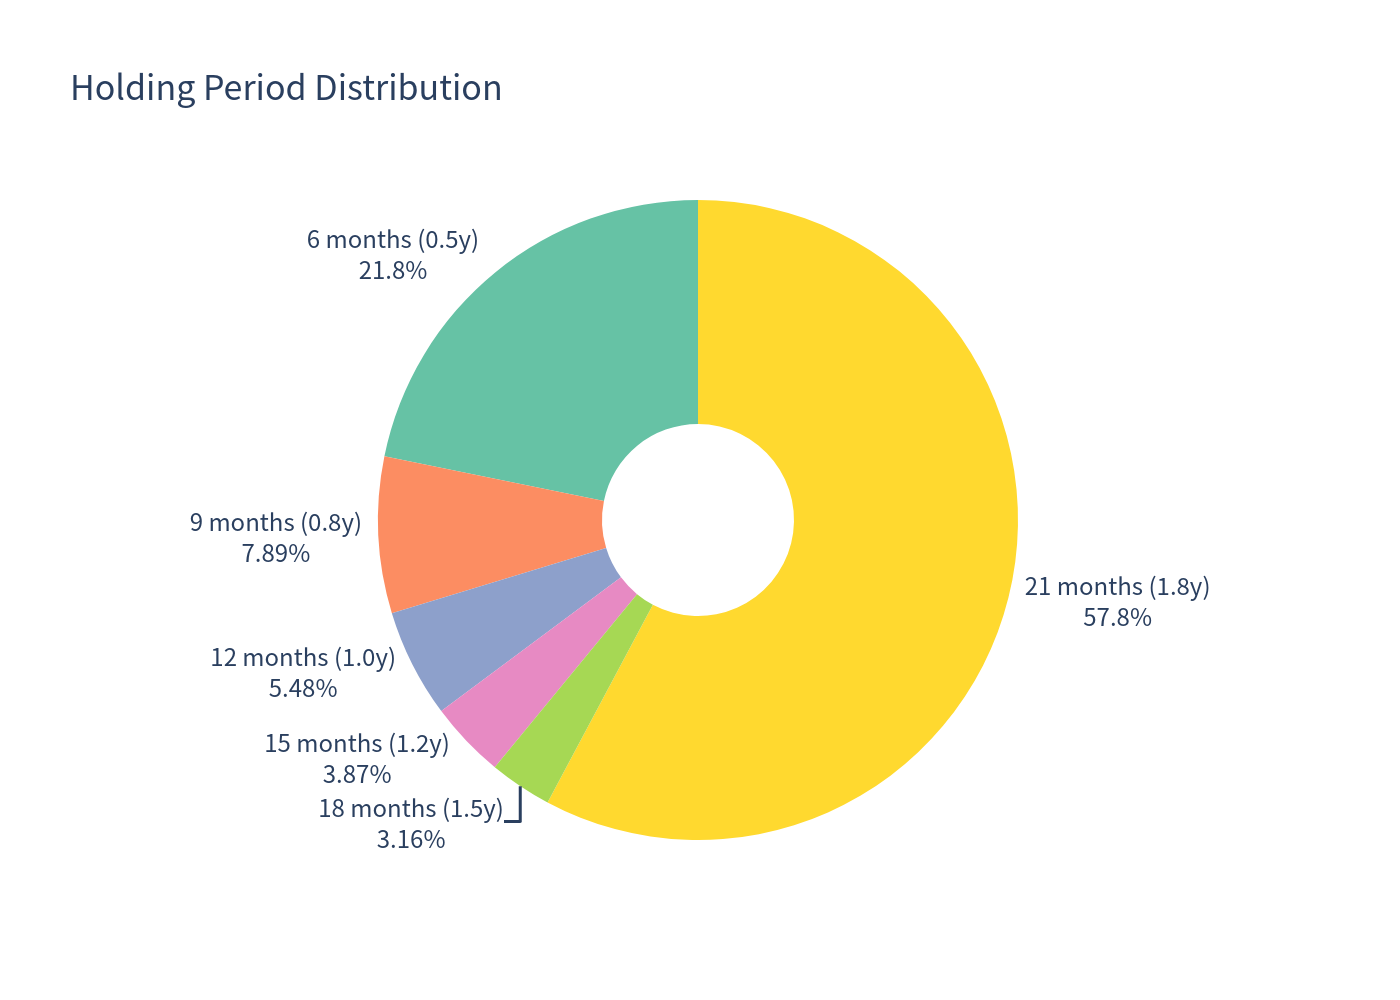
- 42.21% of simulations result in early redemption (issuer calls the product)
- 57.79% held to maturity (21 months)
- Among early redemptions, most occur at month 6 (21.8% of total)
Coupon Distribution
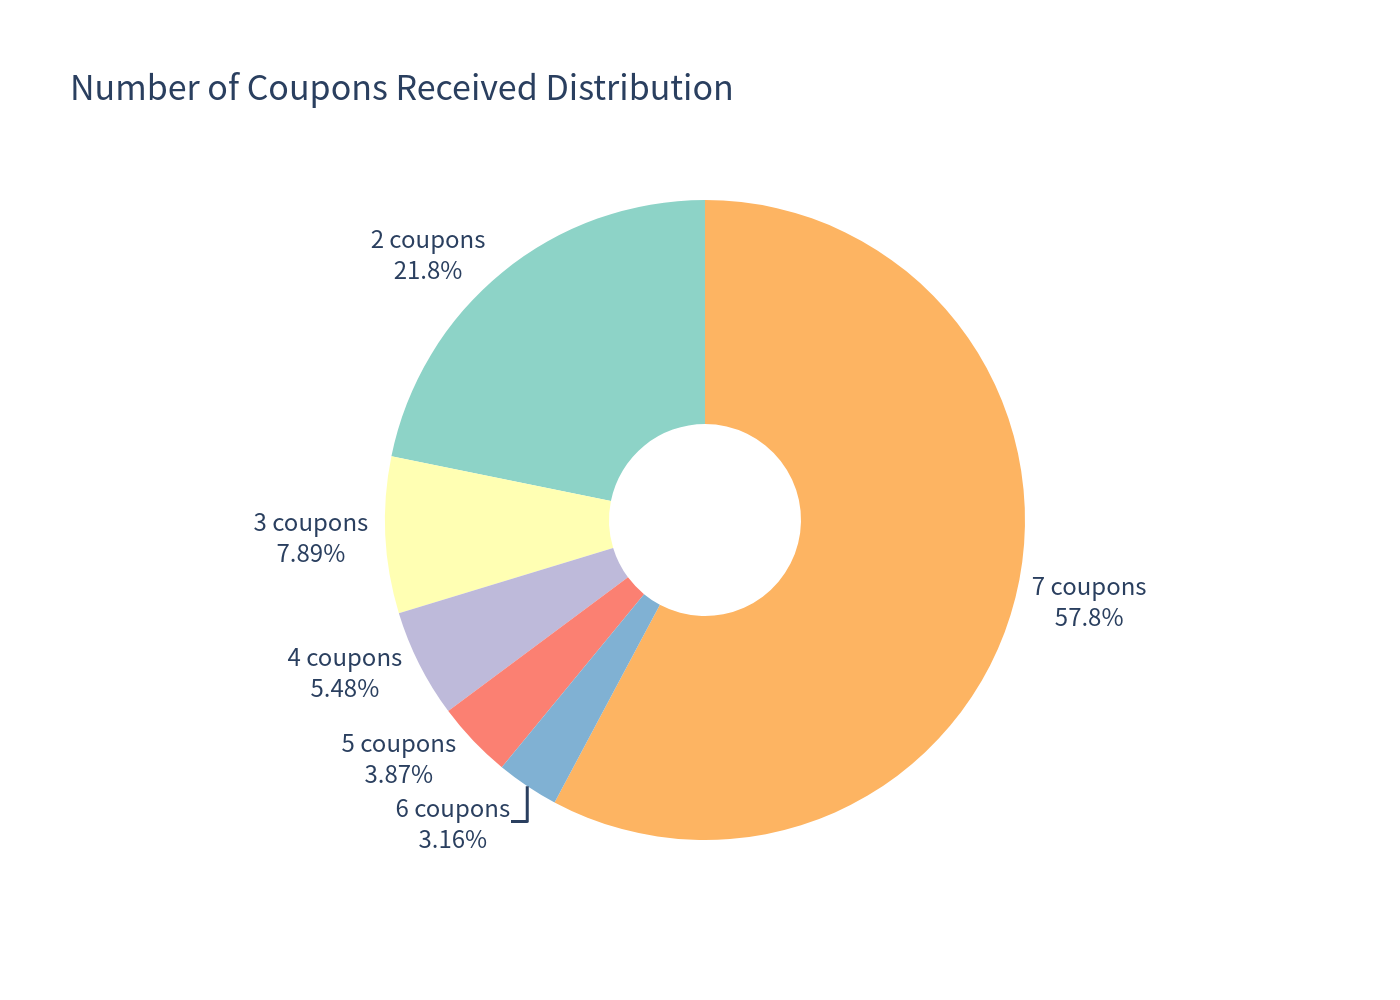
- Average number of coupons received: 5.32
- Average total coupon income: 13.30 points (on 100 notional)
- 57.8% receive all 7 coupons (held to maturity)
- 21.8% receive only 2 coupons (called at first observation)
Investment Commentary
Key Strengths
- High Coupon Income: 10.00% p.a. is an attractive yield in the current low interest rate environment
- Regular Cash Flow: Quarterly coupon payments provide consistent income regardless of market conditions
- Downside Buffer: The 59% barrier provides significant protection against moderate declines (up to 41% drop in any single stock)
- Limited Downside on Barrier Breach: Even if the barrier is breached, losses only occur if the worst stock is below its initial level at maturity
Key Risks
- Issuer Call Risk: The product can be called early (42% probability), shortening the investment horizon and potentially reducing total coupon income
- Credit Risk: The product is unsecured debt of Leonteq Securities AG (Fitch BBB-), guaranteed by Aargauische Kantonalbank (S&P AA+)
- Worst-of Structure: Payoff depends on the worst-performing stock, making it riskier than a single-stock or diversified investment
- Capital at Risk: If barrier is breached and worst stock falls, investor can lose significant capital (up to ~84% in extreme scenarios)
- Limited Upside: Maximum return is capped at the coupon payments (max 17.5 points over 21 months); the product does not participate in upward market movements
tokenengine.ai | Structured Product Evaluator | info@tokenengine.ai
This analysis is based on Monte Carlo simulation (10,000 paths) using GJR-GARCH(1,1) with Student's t distribution. Historical data from the past 20 years was used to calibrate model parameters. The risk-free rate is estimated at 0.50% (CHF). The issuer call decision is modeled assuming the issuer calls when all underlyings are at or above their initial level on observation dates. Past performance and simulation results are not indicative of future returns.