
tokenengine.ai
Structured Product Evaluator | info@tokenengine.ai
Structured Product Evaluation
22.00% p.a. Multi Barrier Reverse Convertible (Quanto CHF) on Dell, Microsoft & SanDisk
1. Headline Simulation Results
Based on 10,000 Monte-Carlo simulations of the underlying basket over the product's life:
| Metric | Result |
|---|---|
| Expected annualized return | +18.18% |
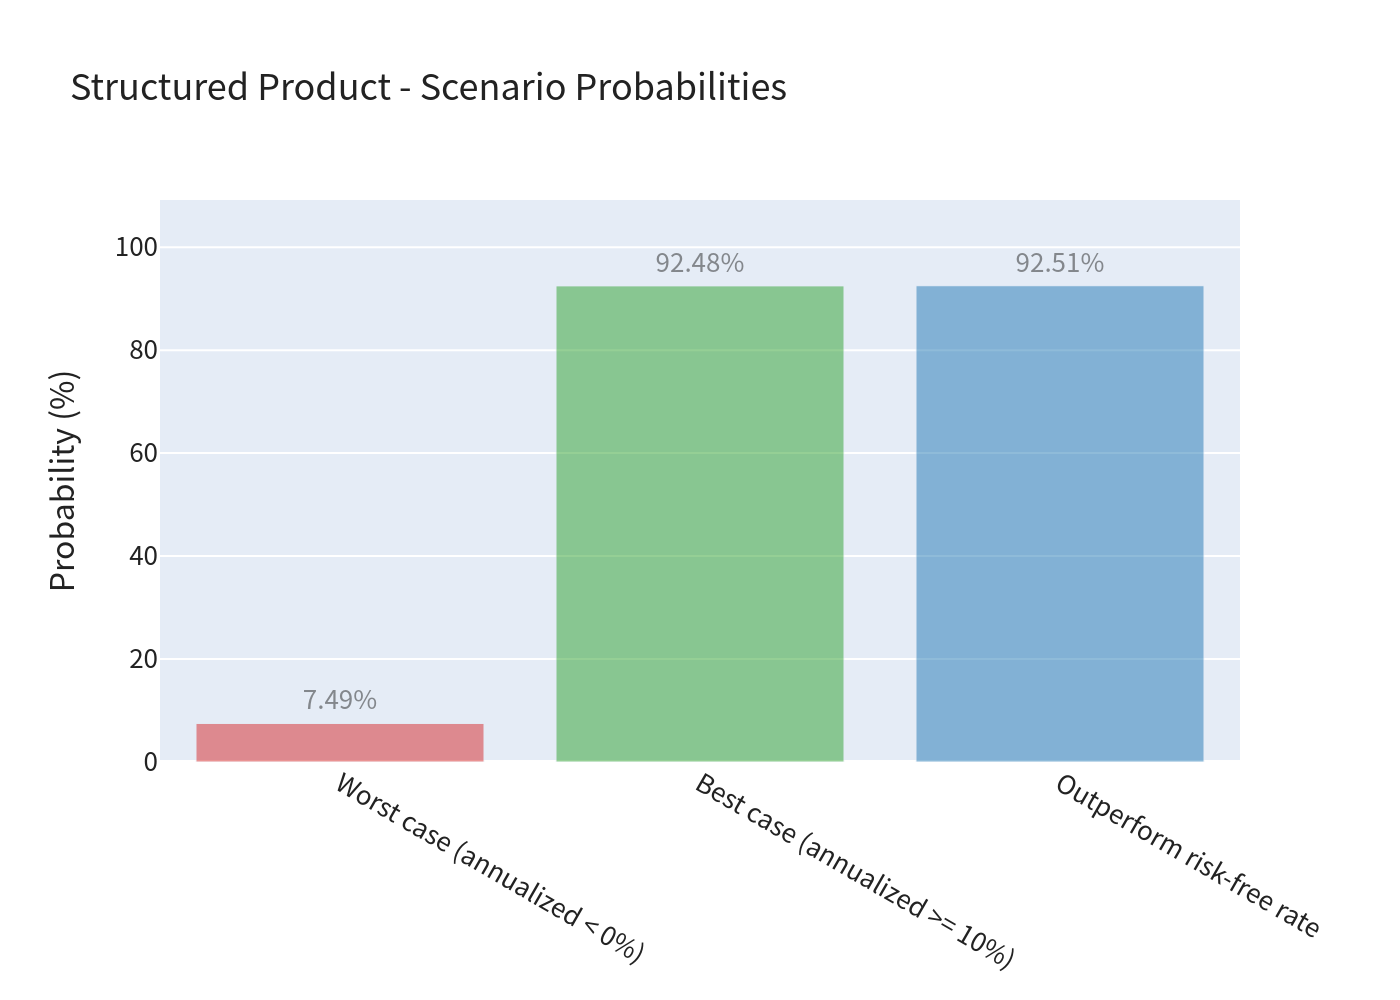
| Probability of a negative return | 7.49% |
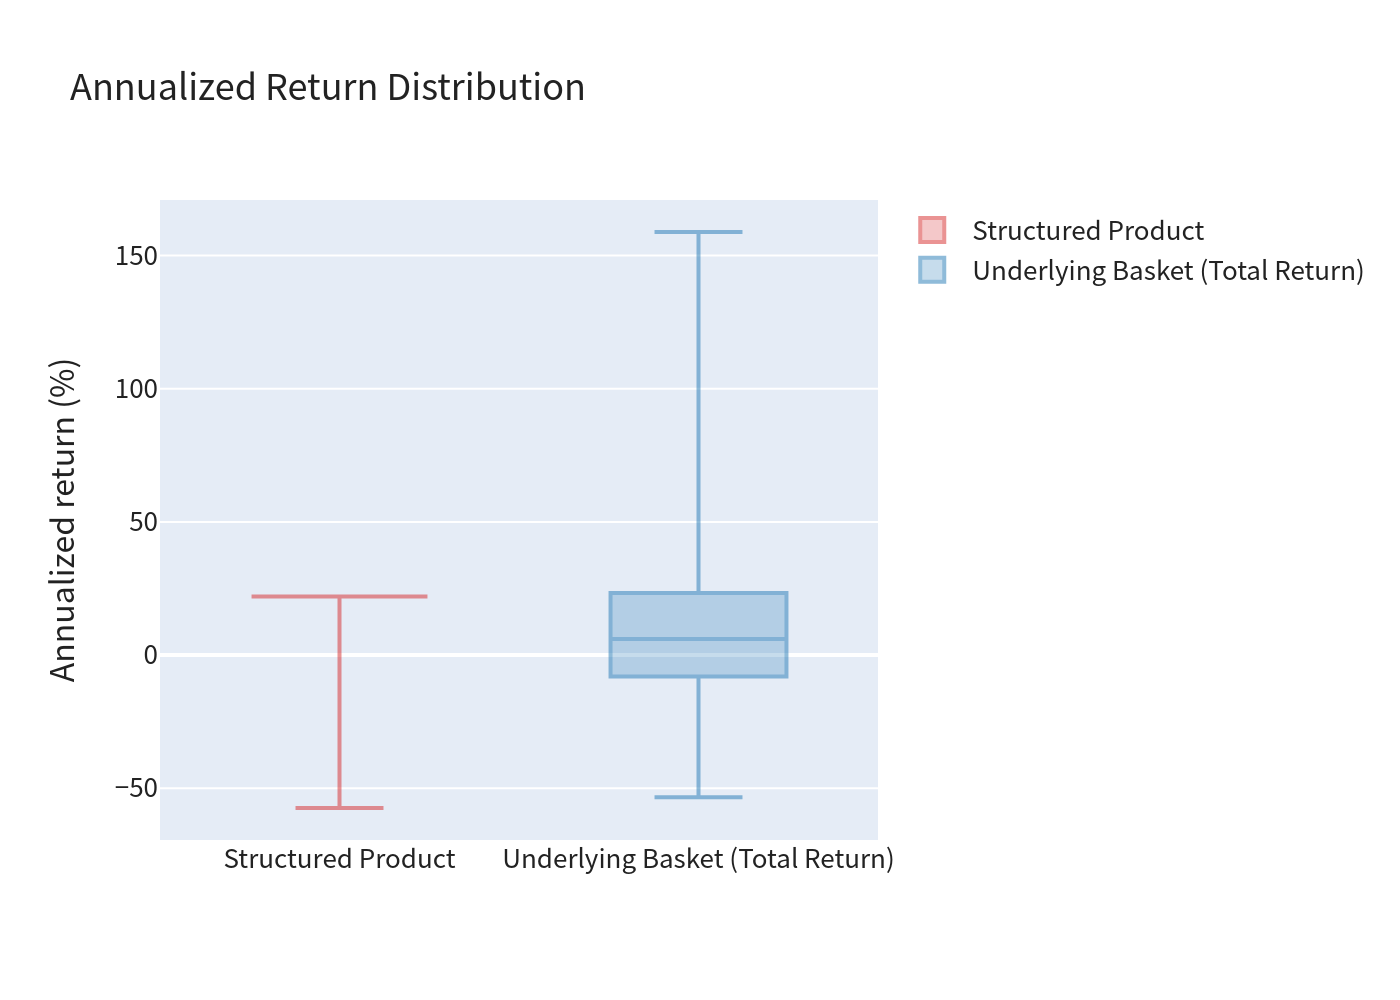
| 99% confidence VaR (1 year) | −36.64% |
| Expected total return over the realized holding period | +15.99% |
| Expected holding period | 10.81 months |
| Probability of outperforming the risk-free rate | 92.51% |
The product is a yield-enhancement structure: most of the time it simply pays its fixed coupon, but it carries a tail risk of capital loss if the worst-performing stock breaches the 49% barrier and finishes below its initial level. The simulation shows an attractive expected return with a moderate probability of loss, driven by the deep 49% barrier.
2. How the Product Works (plain language)
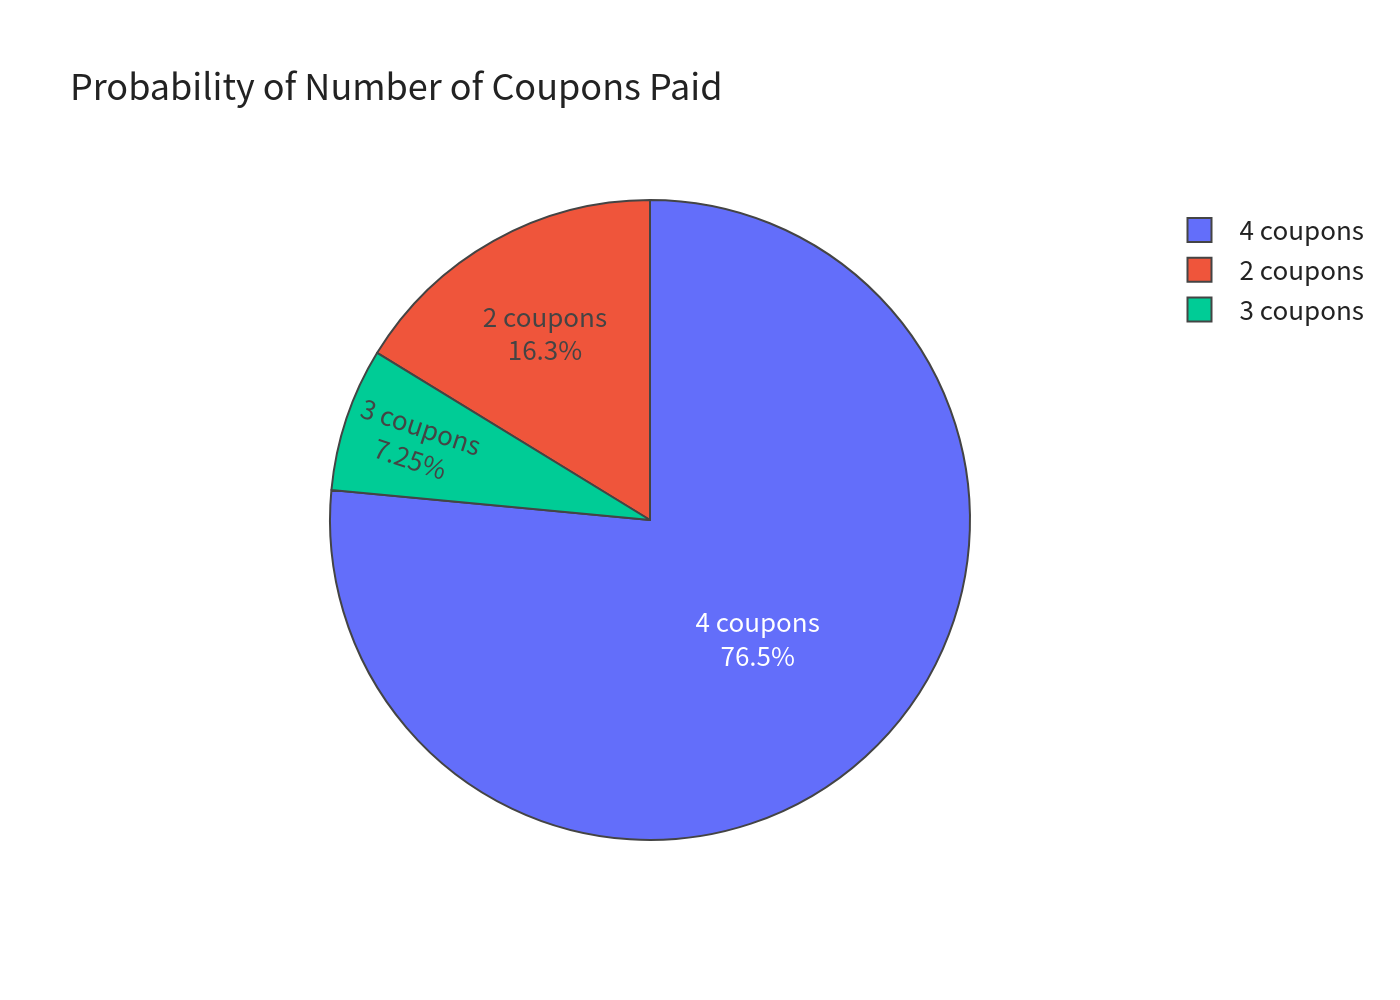
- The note pays a fixed 22.00% per year coupon in four quarterly instalments (5.50% each), regardless of how the three shares perform during the term.
- At maturity you normally get your full 100% nominal back — unless any one of Dell, Microsoft or SanDisk ever trades at or below 49% of its starting level at any point during the year (a "barrier event").
- If that barrier is never touched, you receive par (100%) at the end. If it is touched, your redemption becomes linked to the worst-performing of the three shares: if that worst share ends at or above its starting level you still get par; if it ends below its starting level you effectively receive that share's value − i.e., you participate in its downside, with no participation in any upside.
- The issuer additionally holds a call right: it may redeem the note early (at the two scheduled call dates around month 6 and month 9), in which case you receive par plus that period's coupon. Upside is therefore capped.
3. Key Statistics (Annualized)
| Metric | Structured Product | Underlying Basket | Underlying Basket (incl. dividends) |
|---|---|---|---|
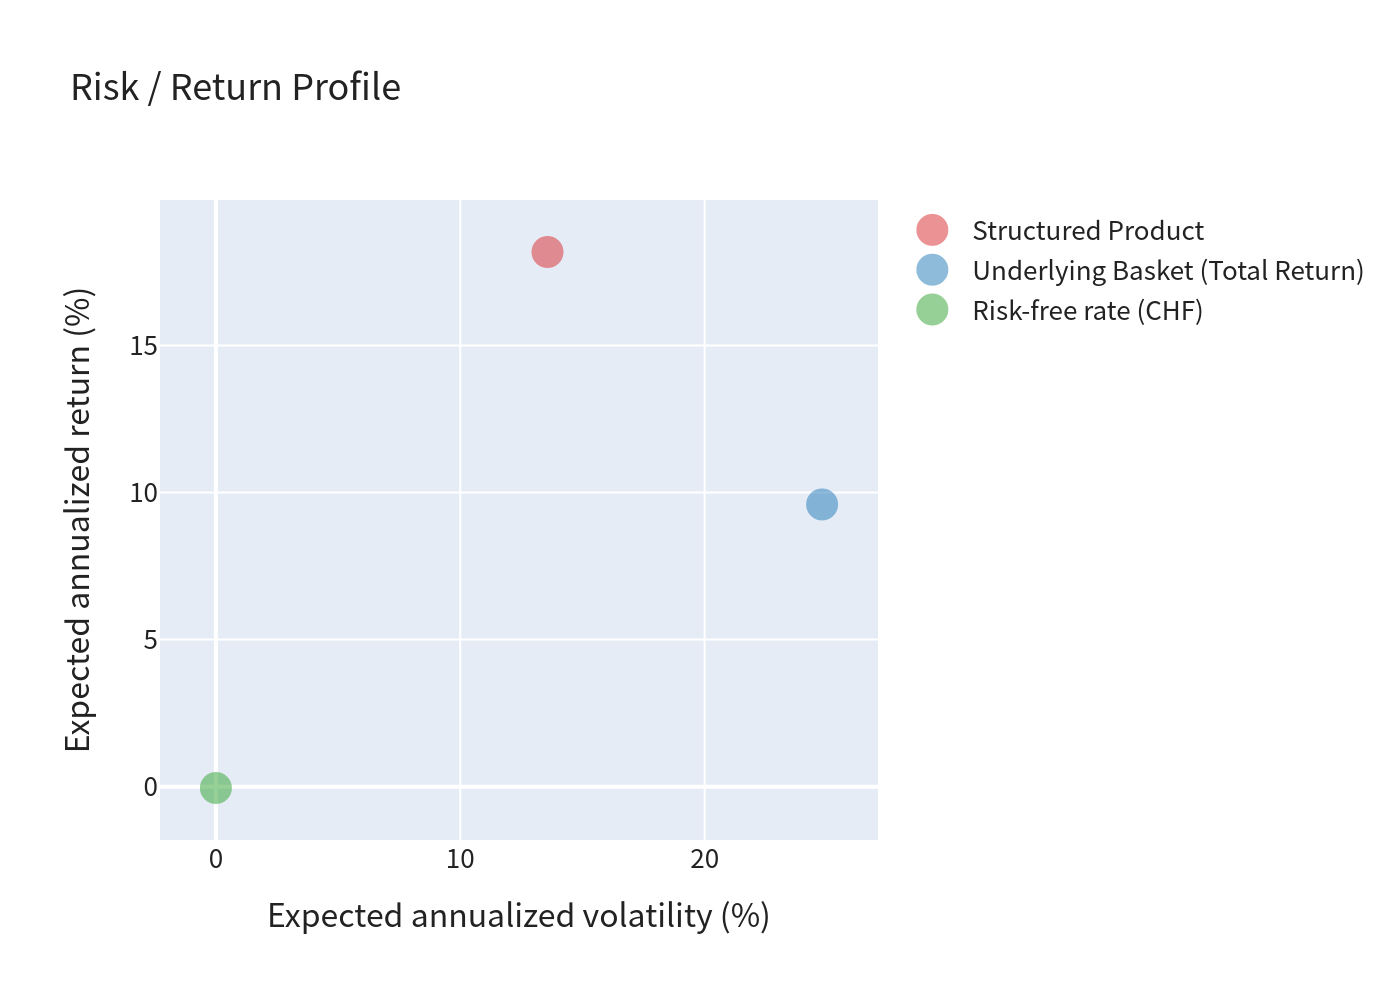
| Expected annualized return | 18.18% | 9.20% | 9.59% |
| Expected annualized volatility | 13.57% | 24.81% | 24.81% |
| Probability of loss | 7.49% | 40.35% | 39.67% |
| 99% VaR (1 year) | −36.64% | −33.47% | −33.07% |
The underlying basket is an equally weighted index of Dell, Microsoft and SanDisk, evaluated over the same holding period as the product in each simulation.
Outcome distribution
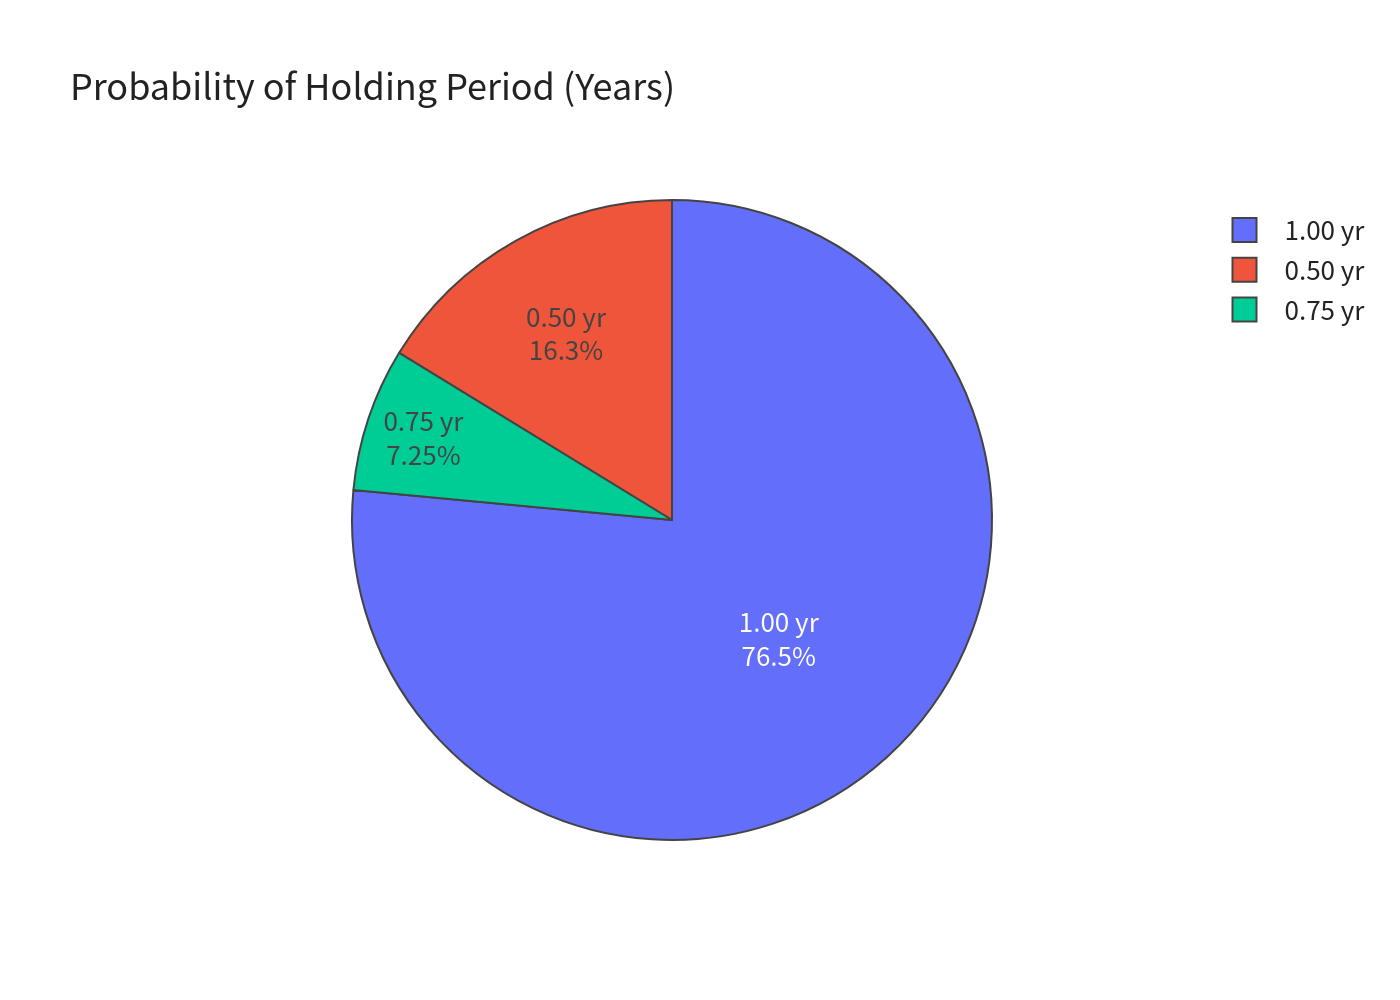
- Called early at ~month 6: 16.25% of simulations
- Called early at ~month 9: 7.25% of simulations
- Held to maturity (month 12): 76.50% of simulations
- Continuous barrier breached during the year: 7.55% of simulations
4. Charts
Simulation outcomes vs the underlying
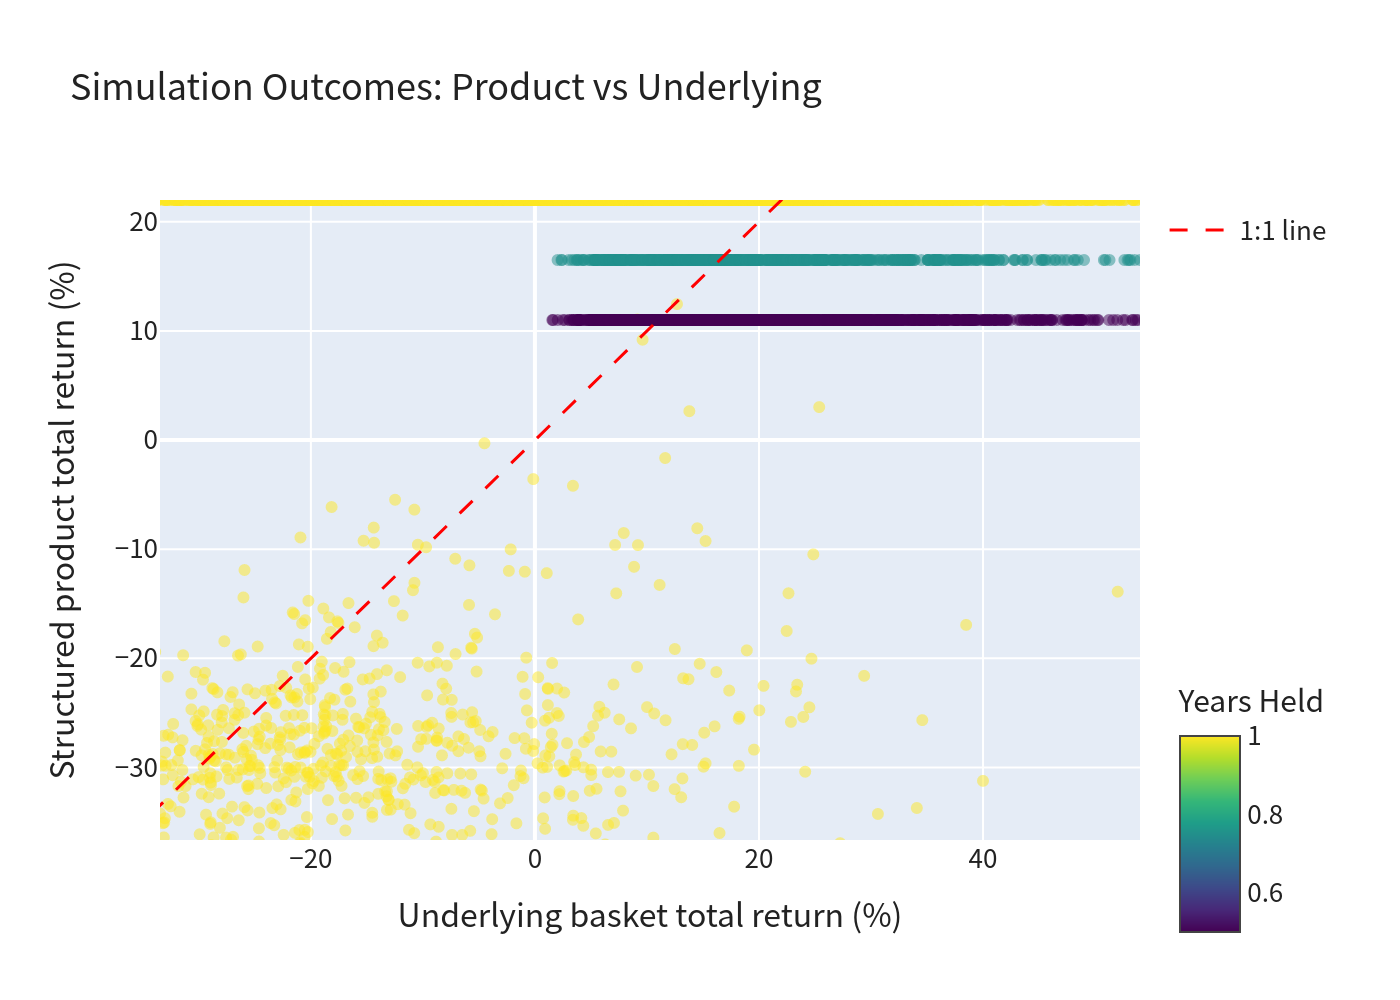
Each point is one simulation. The vertical cluster near +22% (annualized) corresponds to the "coupon paid, par returned" outcomes; the downward tail (below the 1:1 line) captures the barrier-breach losses.
Underlying basket and product return histograms
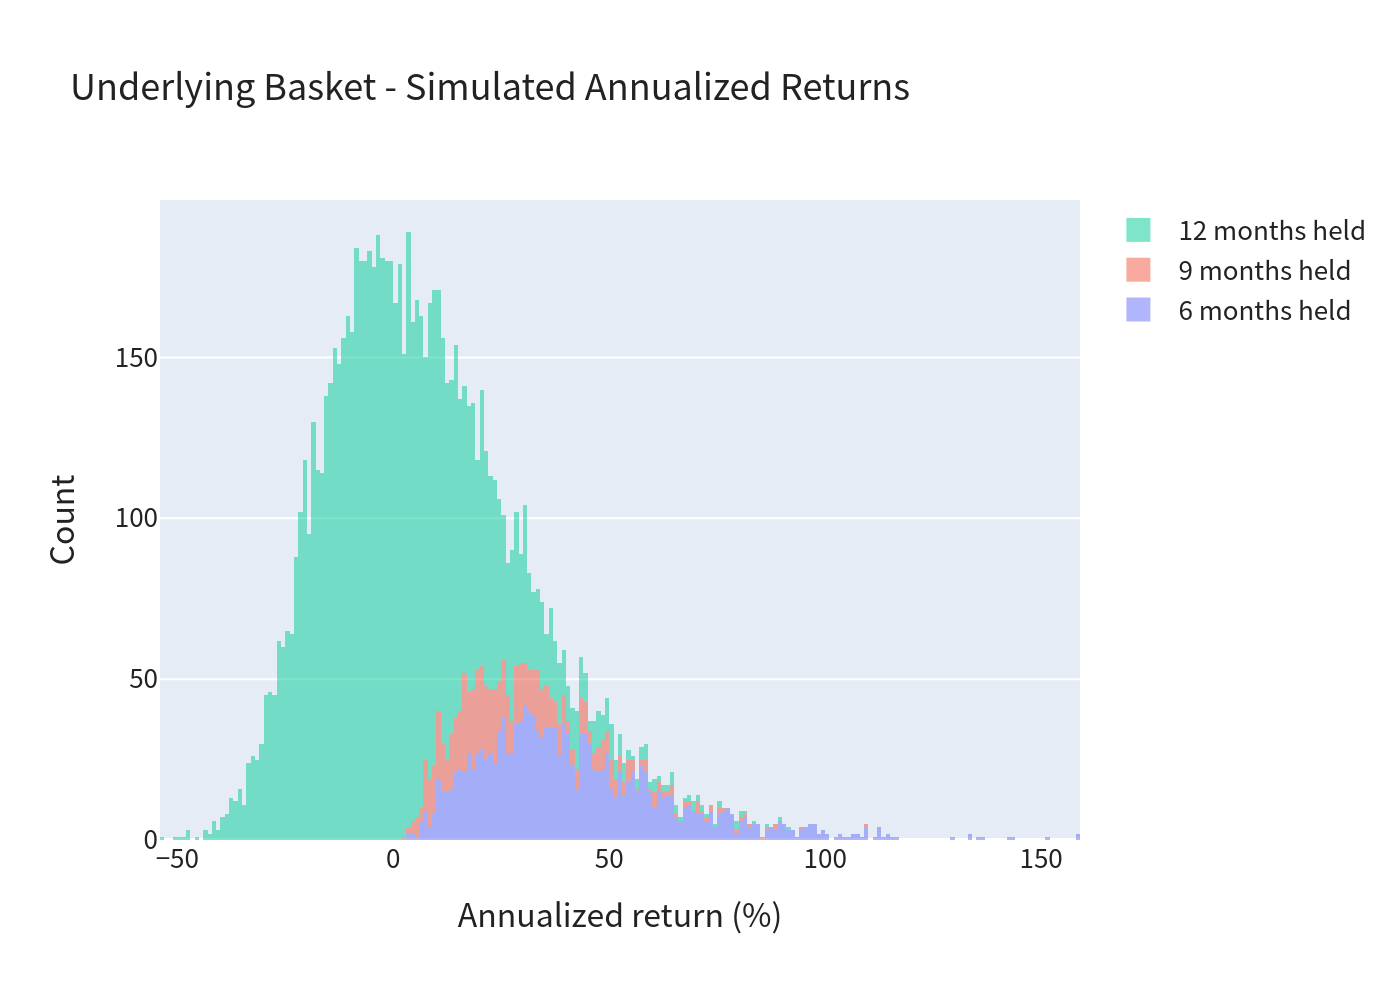
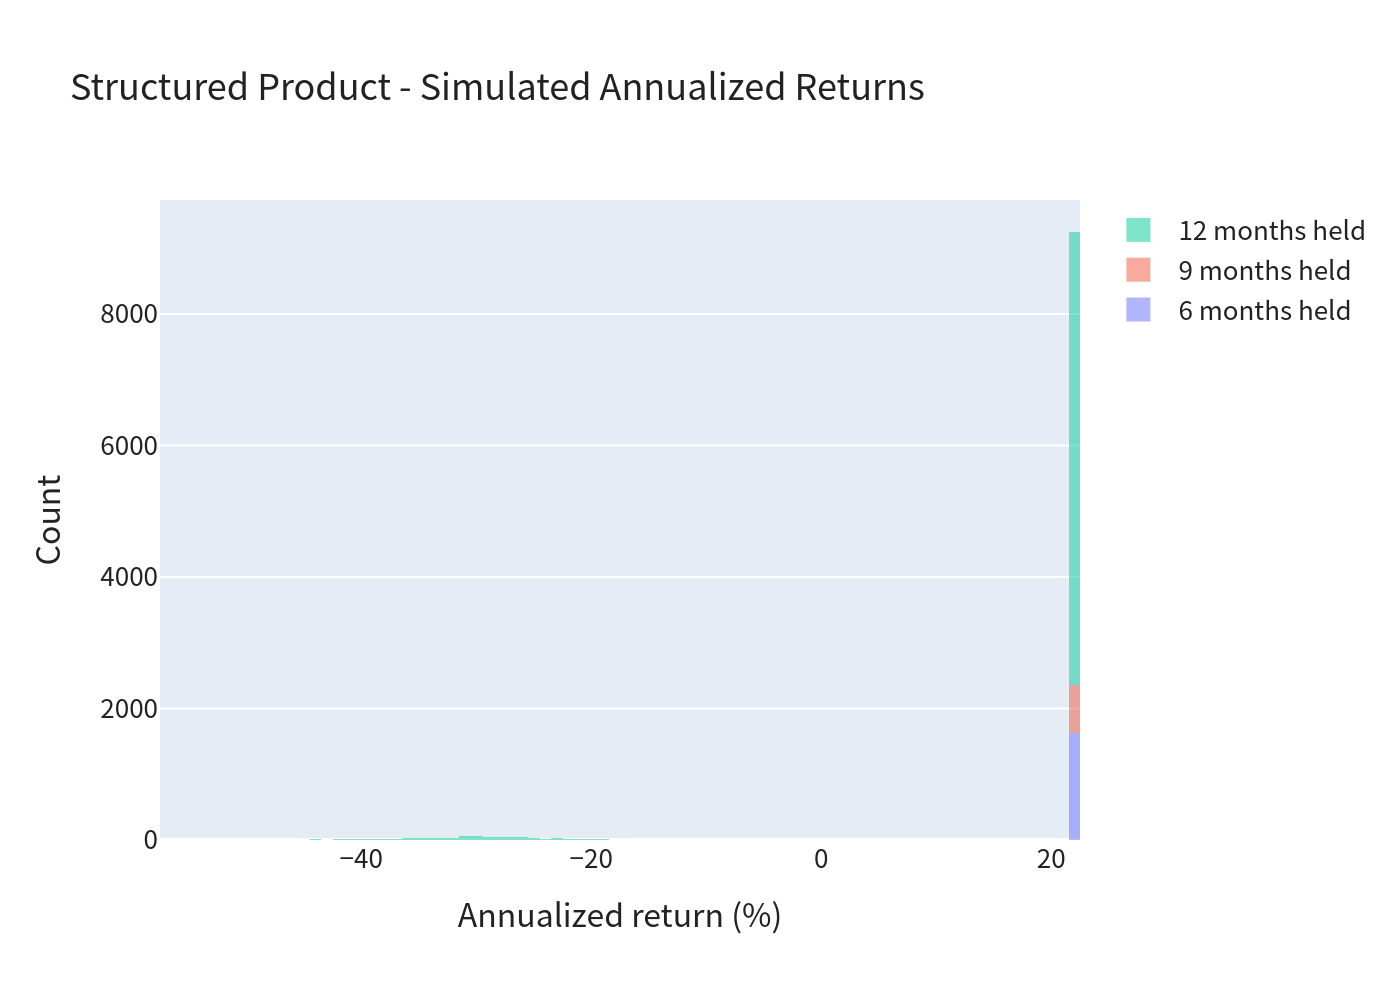
The product's distribution is heavily concentrated at the coupon outcome with a thin loss tail, whereas the underlying distribution is wide and roughly symmetric around a low positive mean.
Scenario probabilities
Risk / return profile
Return distribution comparison
Holding-period and coupon probabilities
5. Investment Commentary
Pros
- High headline yield: a 22.00% p.a. coupon in a CHF (quanto) format, well above the CHF risk-free rate (approximately −0.05%).
- Deep protective barrier: the 49% barrier gives roughly a 51% cushion on each underlying before the capital-protection feature is lost; in the simulations the barrier was breached in only ~7.5% of paths.
- Favourable risk/return shift: the structure converts the basket's ~24.8% volatility into a ~13.6% product volatility while raising the expected return (18.18% vs 9.20%), at the cost of capped upside.
- Positive expected carry: the expected return comfortably exceeds the risk-free rate (92.51% chance of doing so), reflecting the coupon earned while the barrier remains intact.
- Quanto CHF: removes direct USD/CHF currency risk for a CHF-based investor.
Cons / risks to note
- Worst-of exposure: the downside is driven by the single weakest of the three names (including the highly volatile SanDisk), so diversification benefit is limited at maturity.
- Full downside, capped upside: on a barrier breach with the worst name below its initial level, the loss is linear in that stock's decline, with no offsetting upside participation.
- Tail risk: the 99% VaR of −36.64% shows that a severe, correlated equity sell-off (which would breach the barrier) can produce a substantial one-year loss.
- Call risk: early redemption (projected in ~23.5% of paths) truncates the coupon stream and forces reinvestment; the effective yield is therefore slightly below the headline in those scenarios.
- Issuer & liquidity risk: the note is an unsecured obligation of the issuer (Leonteq, Fitch BBB−), exposed to the issuer's credit risk.
Figures shown to two decimal places. Simulated metrics are estimates based on a GJR-GARCH Monte-Carlo model and are not guarantees of future performance.