
Worst-of INDU and SPX Trigger PLUS — Simulation Analysis Report
Morgan Stanley Finance LLC — Worst-of Dow Jones Industrial Average (INDU) and S&P 500 (SPX) Trigger PLUS due June 3, 2031 (CUSIP 61781FJH7)
Headline Results
| Metric | Value |
|---|---|
| Expected annualized return (product) | 10.33% |
| Probability of a negative return | 4.98% |
| 99% confidence VaR (1 year, annualized) | -11.93% |
| Expected total return over the 5-year holding period | 74.21% |
| Expected holding period | 5.00 years (fixed, no early redemption) |
Basic Product Information
- Type: Buffered "Trigger PLUS" — leveraged upside participation on the worst performing of the Dow Jones Industrial Average and the S&P 500, with a 25% buffer against moderate losses.
- Term: ~5 years (priced May 29, 2026; observed May 29, 2031; matured June 3, 2031). Single observation at maturity — no coupons and no early redemption.
- How it works (layman's terms): At maturity, the two stock market indices are compared to their starting levels and only the worst performer matters.
- If the worst performer is up, you receive 100% of your money plus 143% of that gain (leverage factor, in the 143%–158% range).
- If the worst performer is down by up to 25%, you get your money back (the 25% buffer absorbs these losses).
- If the worst performer is down more than 25%, you lose 1% for every 1% decline (e.g., a −50% worst performer returns only 50% of principal).
- The better-performing index provides no extra benefit — the payoff depends only on the worst of the two.
- Analysis basis: Monte Carlo simulation of the two indices over 60 months; upside modeled at the 143% leverage factor used throughout the term sheet's examples (final supplement may fix between 143% and 158%). Simulation ignores fees and issuer credit risk.
Key Statistics (annualized, simulated)
| Metric | Structured Product | Benchmark* (50/50 DJI & SPX) |
|---|---|---|
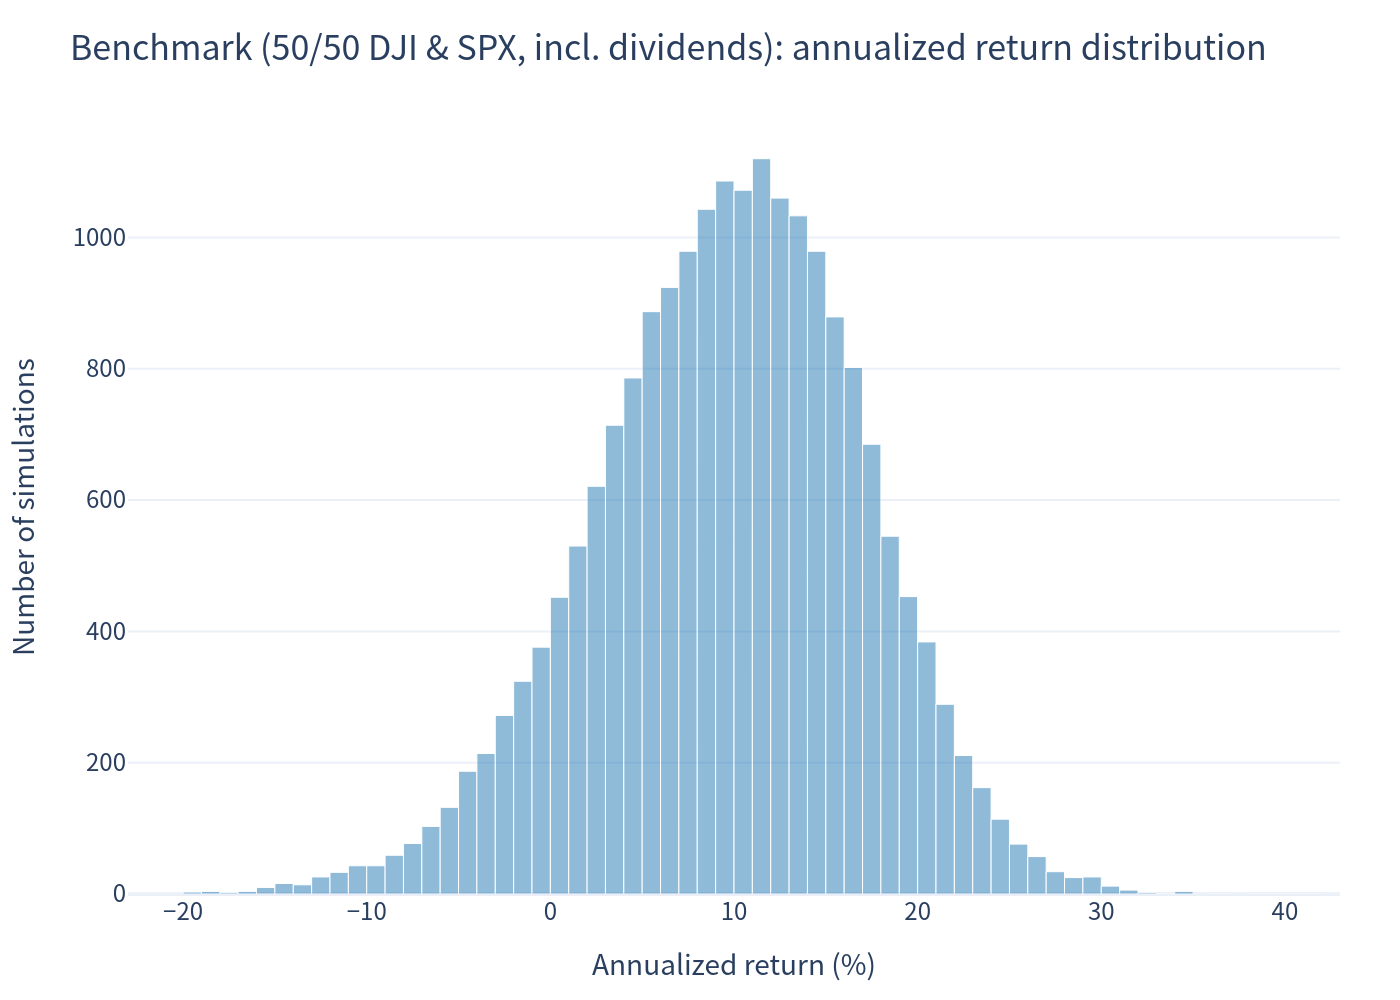
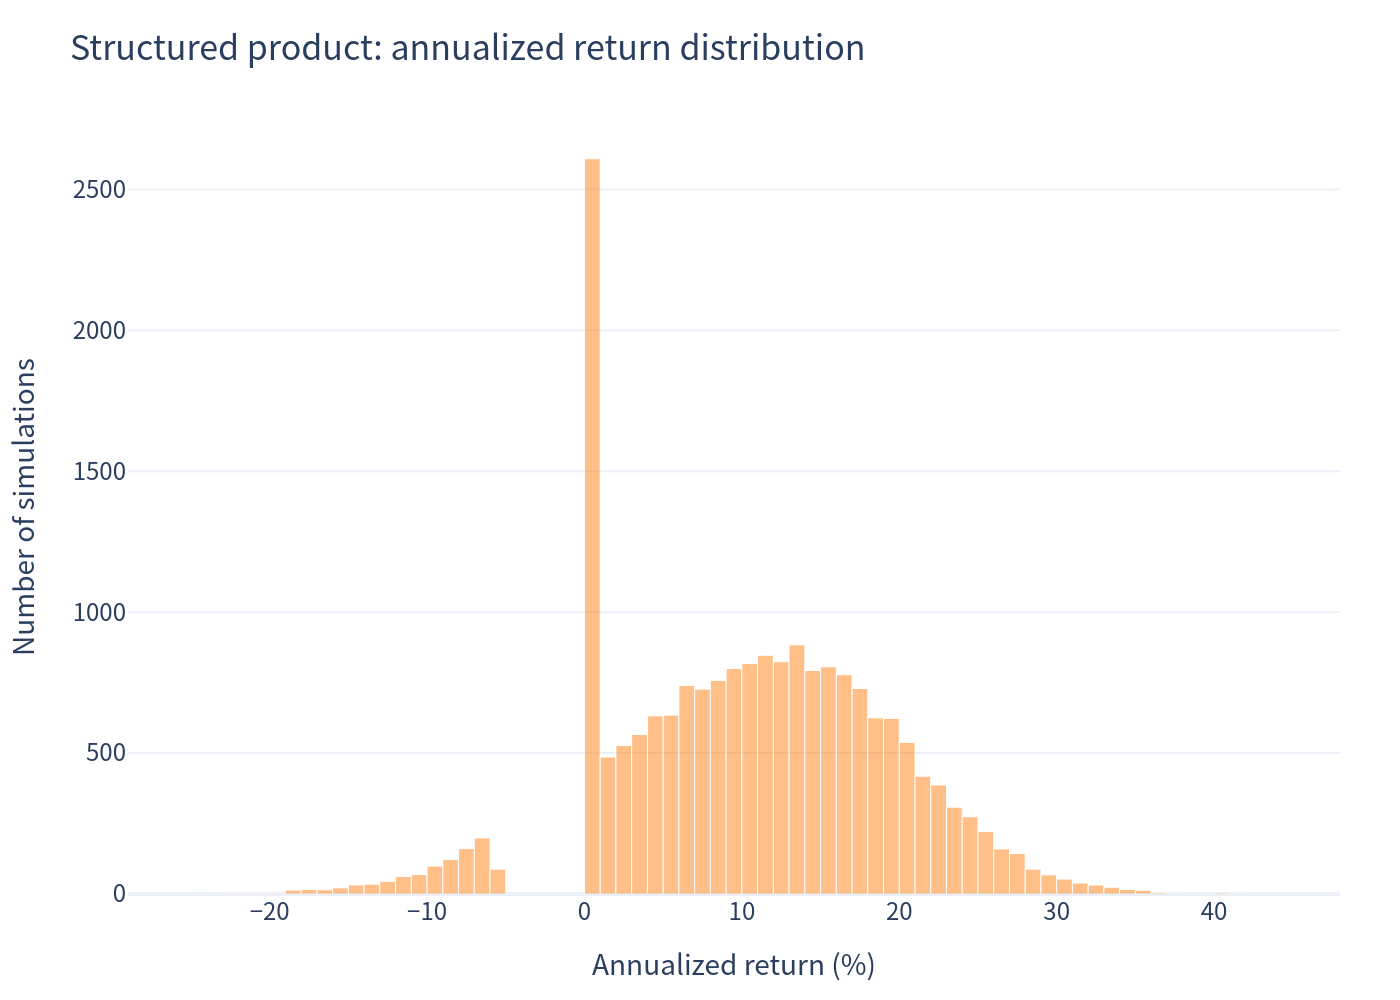
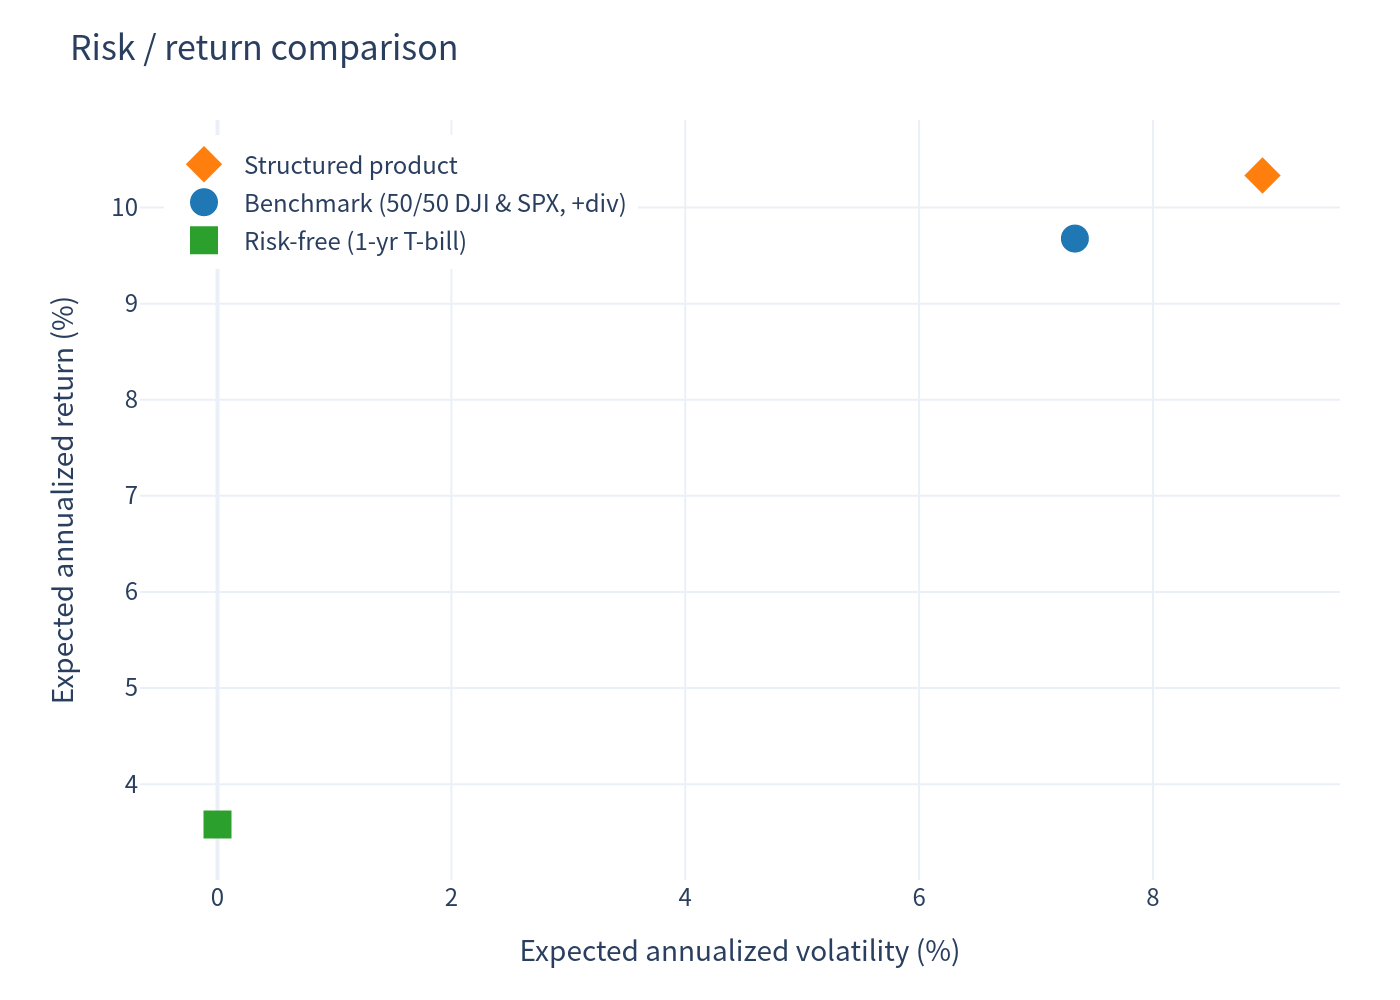
| Expected annualized return | 10.33% | 9.68% |
| Expected annualized volatility | 8.94% | 7.33% |
| Probability of loss | 4.98% | 9.72% |
| 99% confidence VaR (1 year) | -11.93% | -9.01% |
| Expected total return over ~5 years | 74.21% | 63.05% |
Reading the numbers: The "expected annualized return" is the arithmetic average of each simulation's own compound annual growth rate, while the "expected total return" is the arithmetic average of each simulation's full 5-year return. Because these are averages of per-path outcomes (not a single compounding path), the two figures are not linked by simple compounding — e.g., the product's 10.33% expected annualized return corresponds to a 74.21% expected total return over the 5-year life, not 63.51%.
Simulation Outcome Charts
Product vs. Worst-of Underlier Return
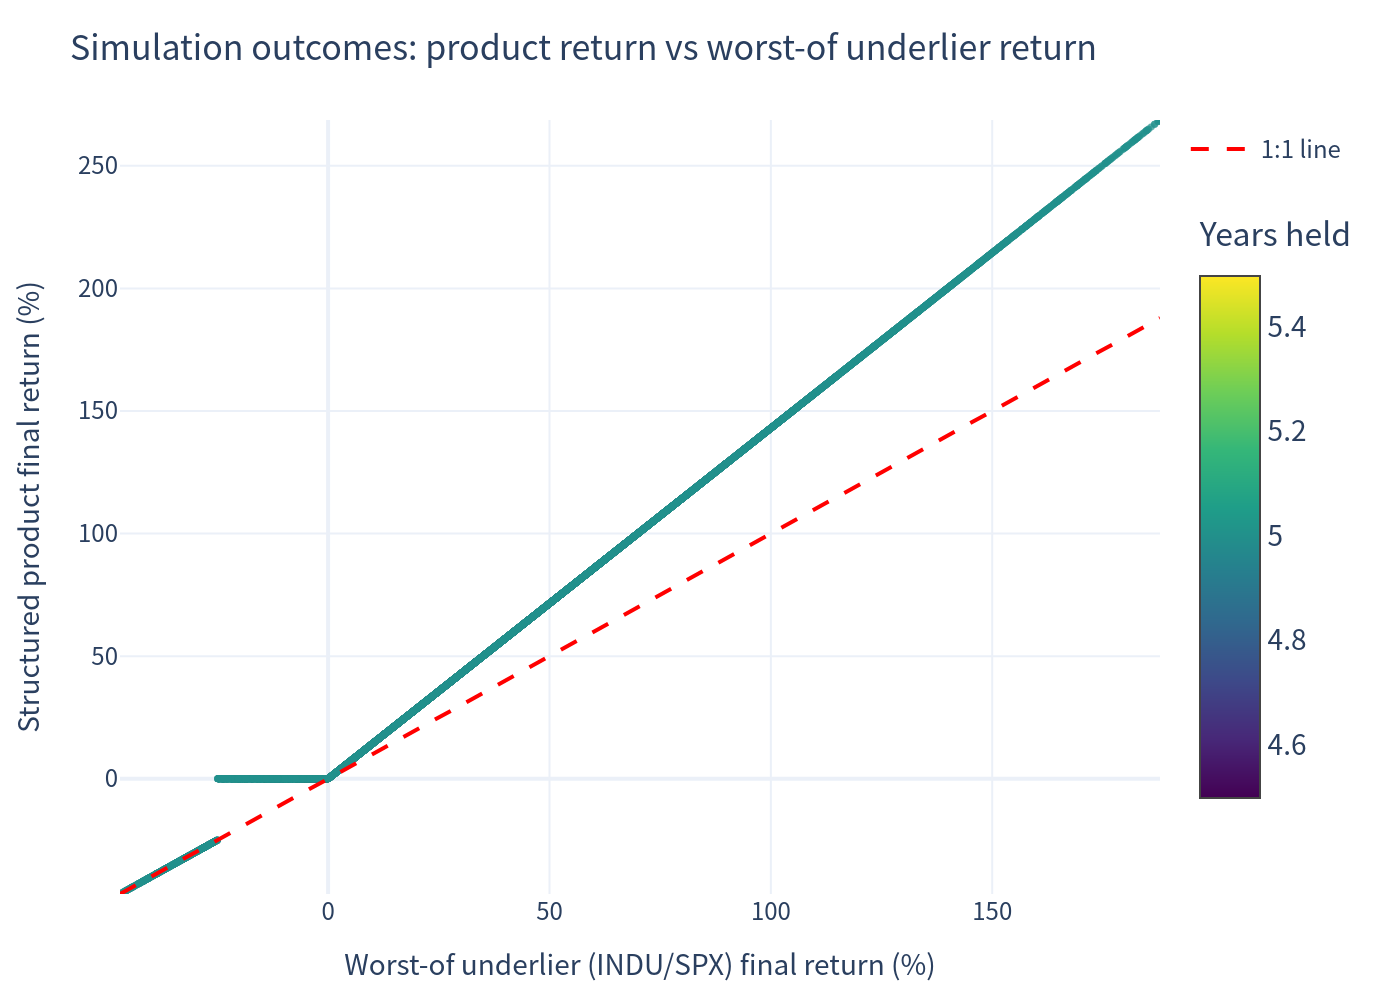
Each dot is one simulated outcome (20,000 paths), showing the product's final return against the worst-performing index return over the 5-year term. The kinked shape shows the leveraged upside, the flat par region inside the 25% buffer, and the 1:1 losses beyond the buffer.
Annualized Return Distributions (1% bins)
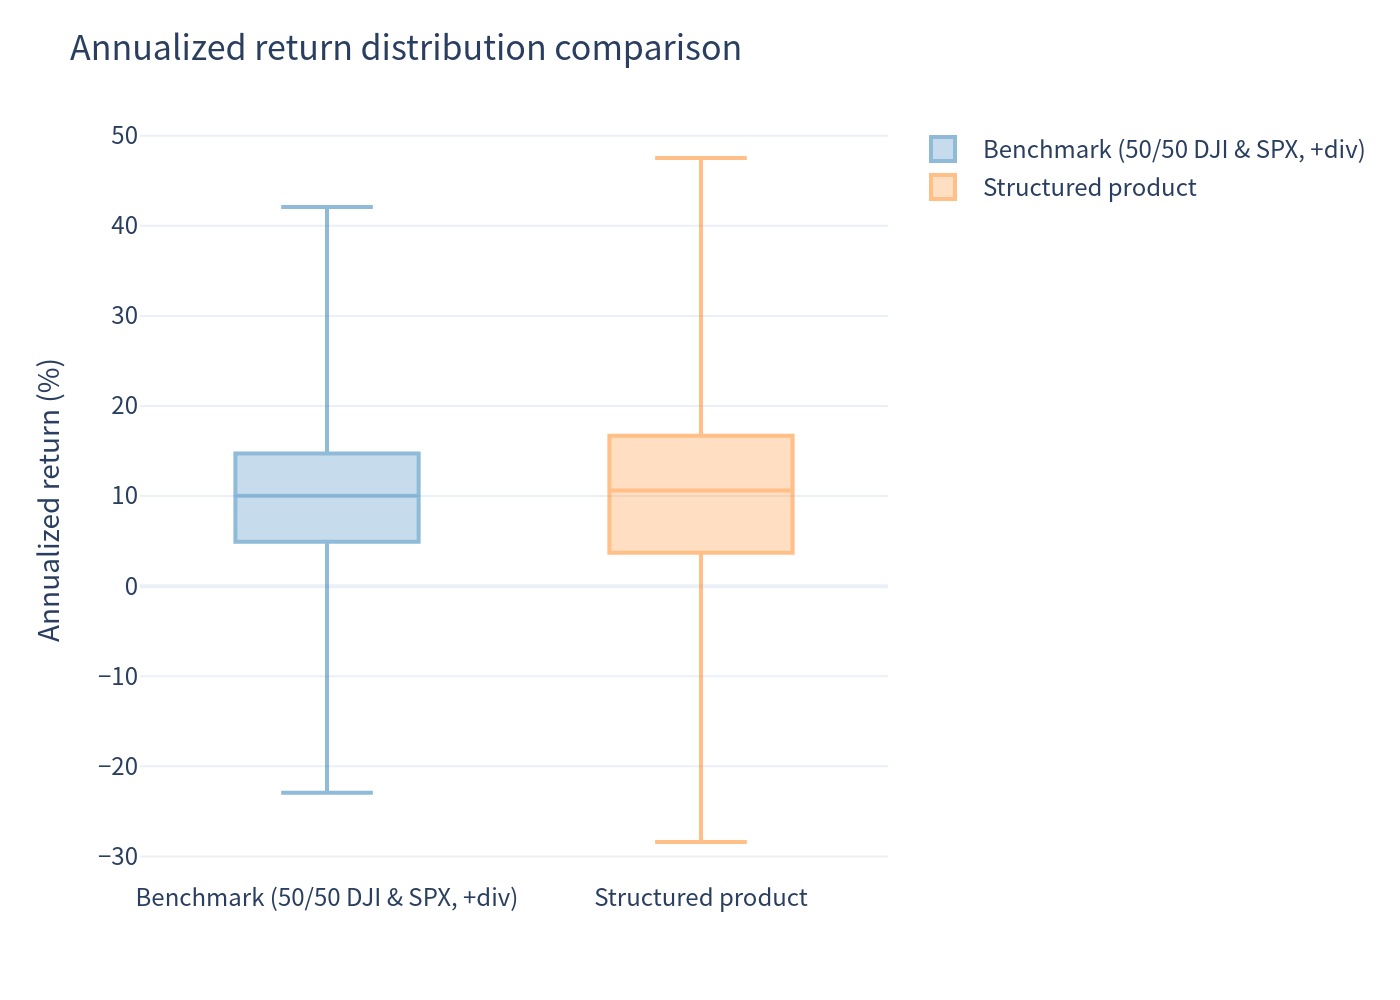
Simulated distribution of annualized returns for the benchmark (top) and the structured product (bottom), binned at 1% intervals across 20,000 paths.
Scenario Probabilities
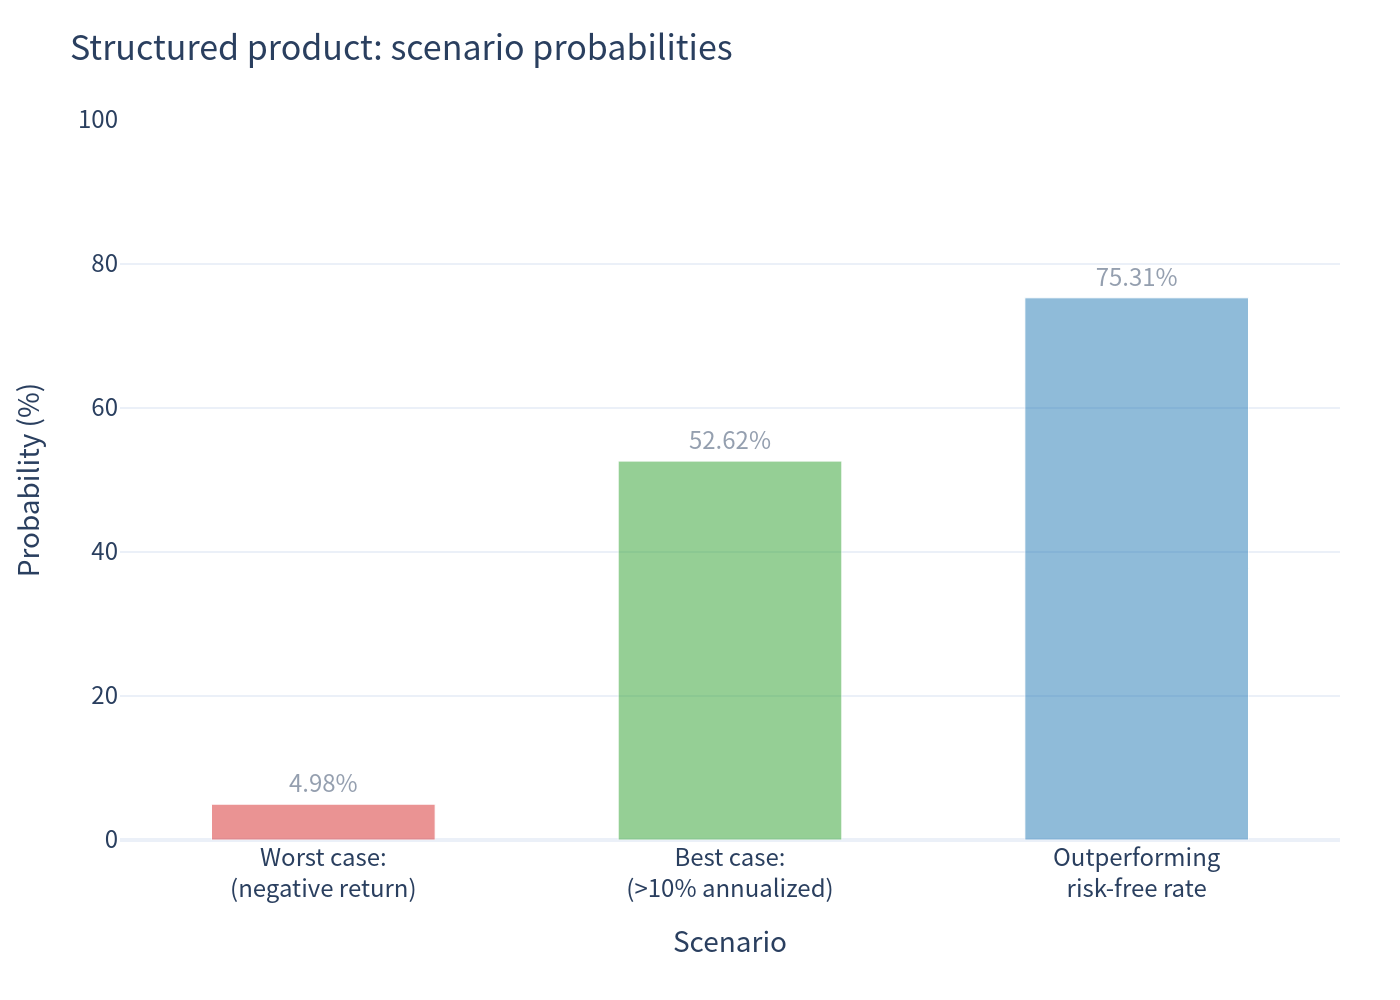
Probability mass across payoff scenarios: leveraged gain, full principal (within the 25% buffer), and losses beyond the buffer.
Risk / Return Profile
Risk versus return positioning of the structured product against the equal-weight benchmark in annualized terms.
Return Distribution Comparison
Side-by-side distribution summary of 5-year total returns for the product and the benchmark.
Investment Commentary
- Meaningful buffer: a 25% buffer absorbs losses in the worst performing index, cutting the probability of losing money to about 4.98% versus roughly 9.72% for the equal-weight benchmark — and the probability of the worst index falling more than 25% over five years is modest.
- Leveraged upside: uncapped 143% participation in the worst index's gains. When both indices rise (the more common scenario in the simulation), the product compounds the gain. Expected annualized return of 10.33% exceeds the benchmark's 9.68%.
- No early-termination risk: no autocall or coupon-trigger complexity; the payoff is a single, clearly-defined maturity payment. Since the term is fixed at 5 years, investors' holding period is certain.
- Attractive odds profile: roughly 4.98% probability of a loss, about 52.62% probability of exceeding a 10% annualized return and 75.31% probability of beating the risk-free rate (~3.58%).
- Because the payoff is worst-of, the product is only as good as the weaker index; strong gains in one index cannot offset weakness in the other. This adds "pair risk" versus holding both indices directly.
- The buffer is an all-or-nothing 25% step: once the worst index falls below −25%, losses are fully borne 1:1 and can be severe (99% VaR of about -11.93% annualized).
- The final leverage factor will be set between 143% and 158%; results above use the 143% end of the range, so actual upside economics can only be modestly better.
- No interest or coupons are paid; all return is delivered only at maturity, and payment is subject to the issuer's credit.
This analysis is a quantitative illustration of the payoff mechanics only; it does not constitute financial advice or a suitability assessment.