
Morgan Stanley Step-Up Jump Notes with Auto-Callable Feature — due September 29, 2033
This is a principal-protected, auto-callable ("step-up jump") note with no interest payments. The payoff is linked to the level of the Morgan Stanley Amplitude Index™ (a proprietary multi-asset index, proxied here by a 60% S&P 500 / 40% U.S. 10-year Treasury mix).
In plain terms:
- Auto-call (years 1–6): On each annual anniversary, if the index is at or above a step-up threshold (101% → 106% of the initial level), the note is automatically redeemed and pays a stepped amount equal to ~16.00% per annum — e.g. $1,160 after 1 year, $1,320 after 2 years, up to $1,960 after 6 years. No further payments follow.
- If never auto-called: At the 7-year maturity the investor receives the $1,000 principal back plus 100% of any index gain above the initial level (participation rate 100%). If the index is flat or down at maturity, the investor still receives the full $1,000 principal — a hard floor.
| Metric | Structured Product | Underlier (total return) | Risk-free rate |
|---|---|---|---|
| Expected annualized return | 15.27% | 12.43% | 3.72% |
| Expected annualized volatility | 2.62% | 6.73% | 0.00% |
| Probability of loss | 0.00% | 1.27% | — |
| 99% confidence VaR (1 year, max loss) | 0.00% | 1.10% | — |
Simulation Outcomes (return at redemption vs underlier return)
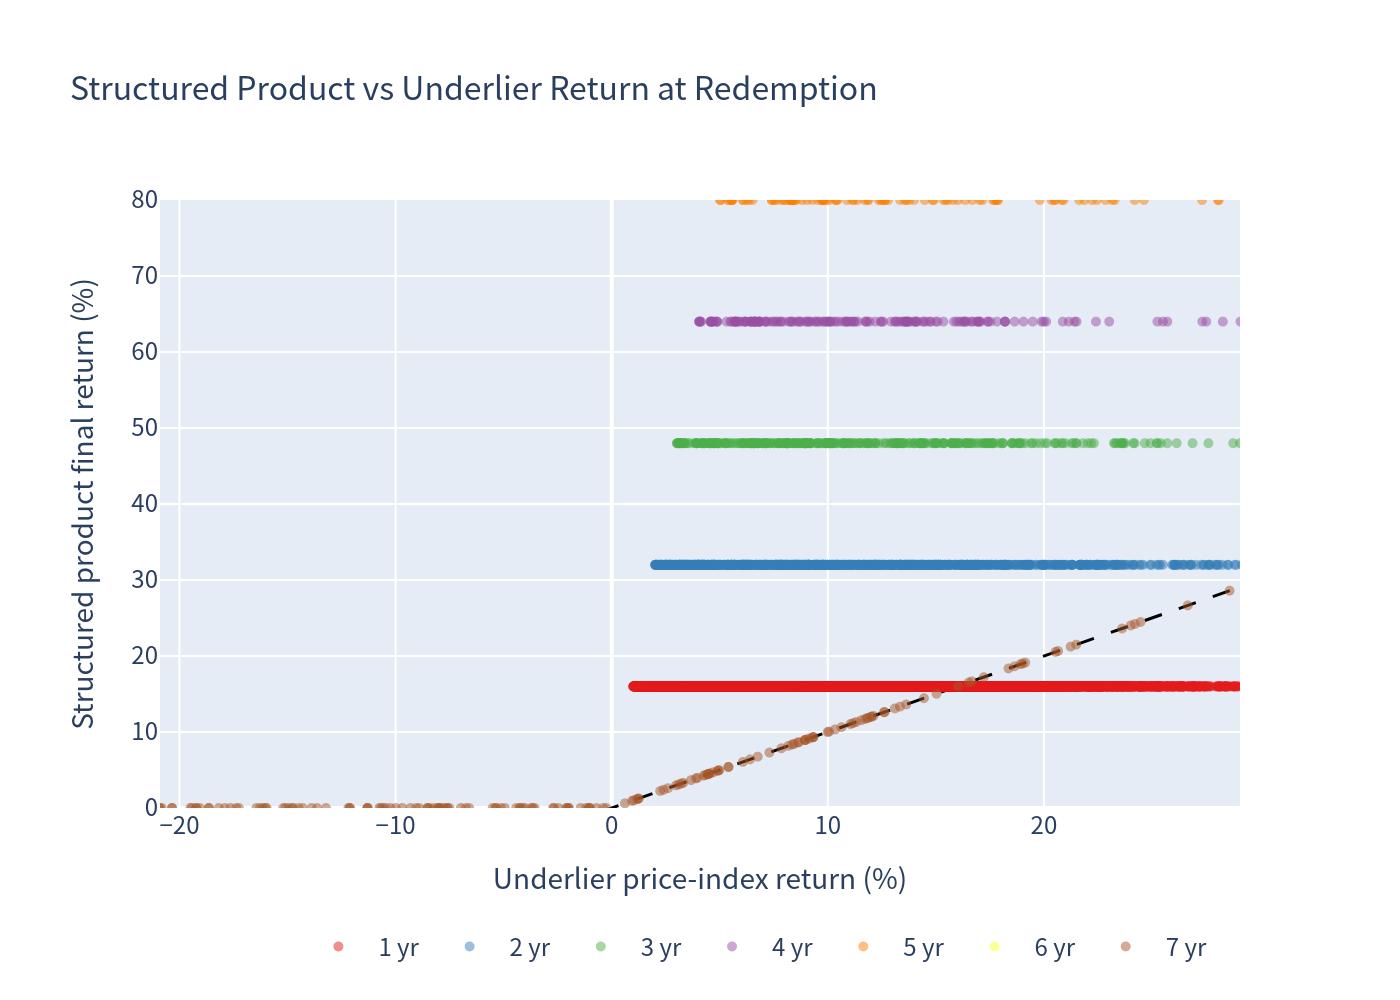
Each dot = one simulation. Color shows how long the note was held. 1:1 dashed line for reference; the fixed step-up payouts sit well above the 1:1 line for early calls, and principal-protected maturity outcomes sit at/above 0%.
Underlier Annualized Return Distribution
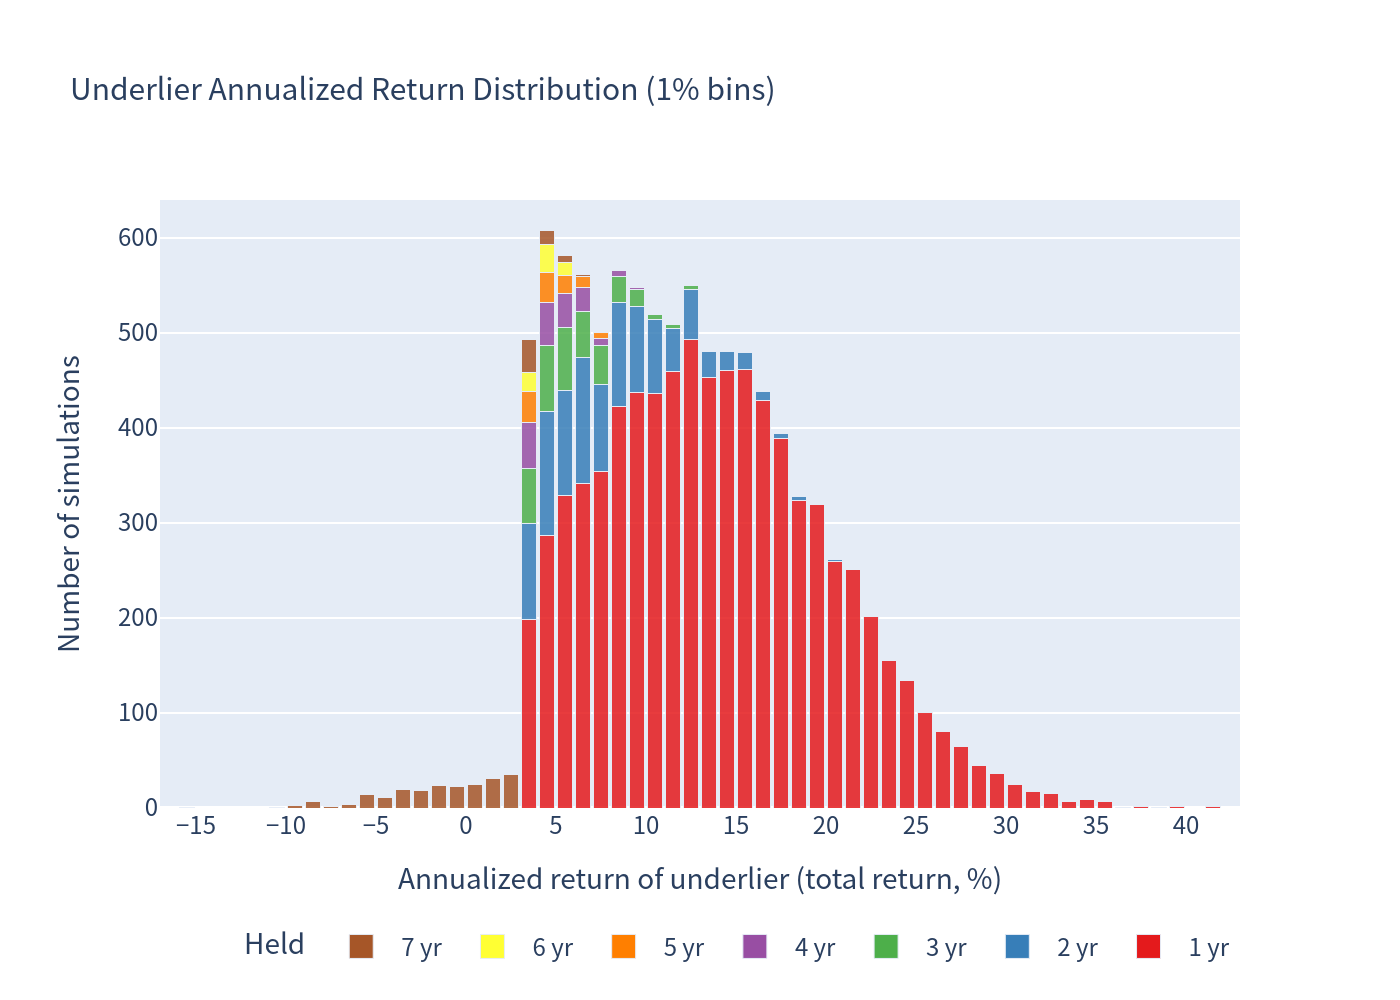
1% bins, colored by holding period (stacked).
Structured Product Annualized Return Distribution
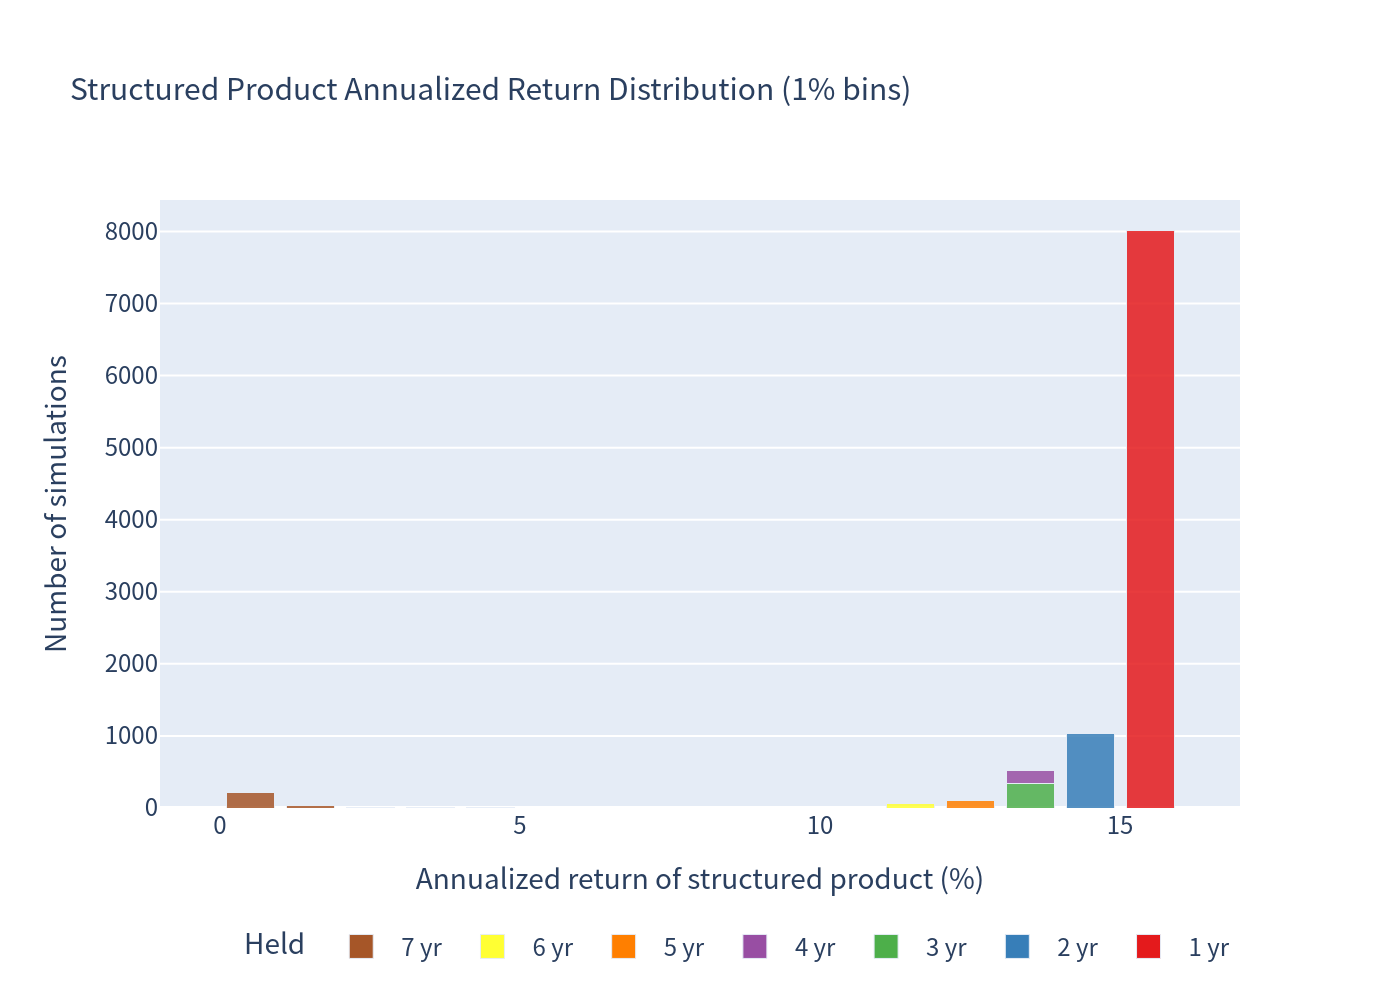
1% bins, colored by holding period (stacked). Returns cluster at the fixed ~16%/14.9%/13.9%... step-up redemptions; maturity outcomes (year 7) are near 0–4%.
Scenario Probabilities
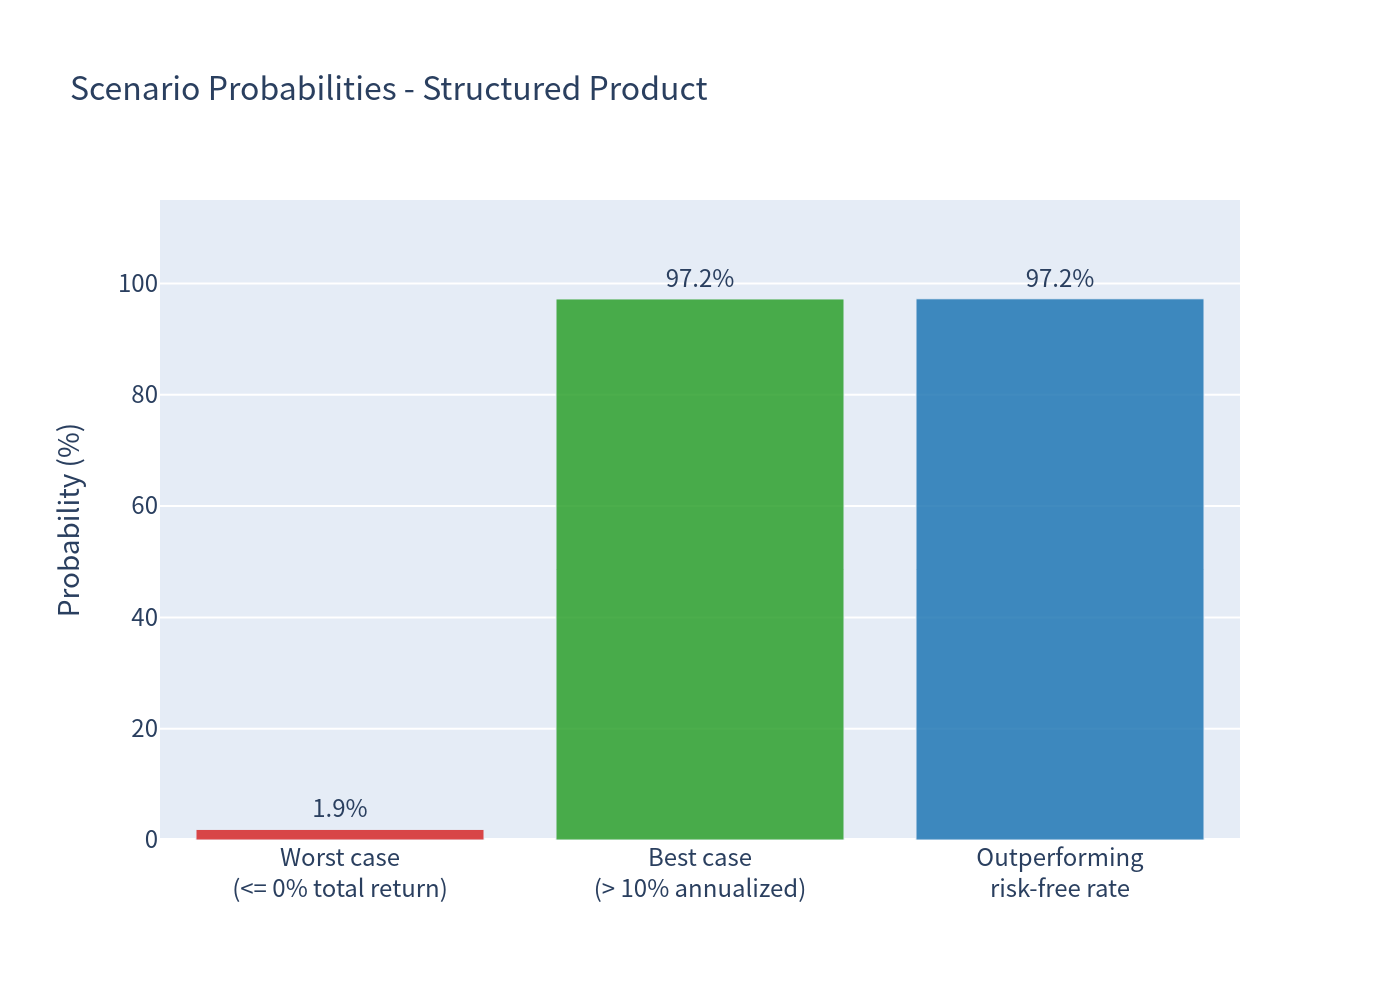
Worst case = return of principal only (0% total, ~1.90%); best case = >10% annualized (~97%); outperforming the risk-free rate (~97%).
Risk vs Return
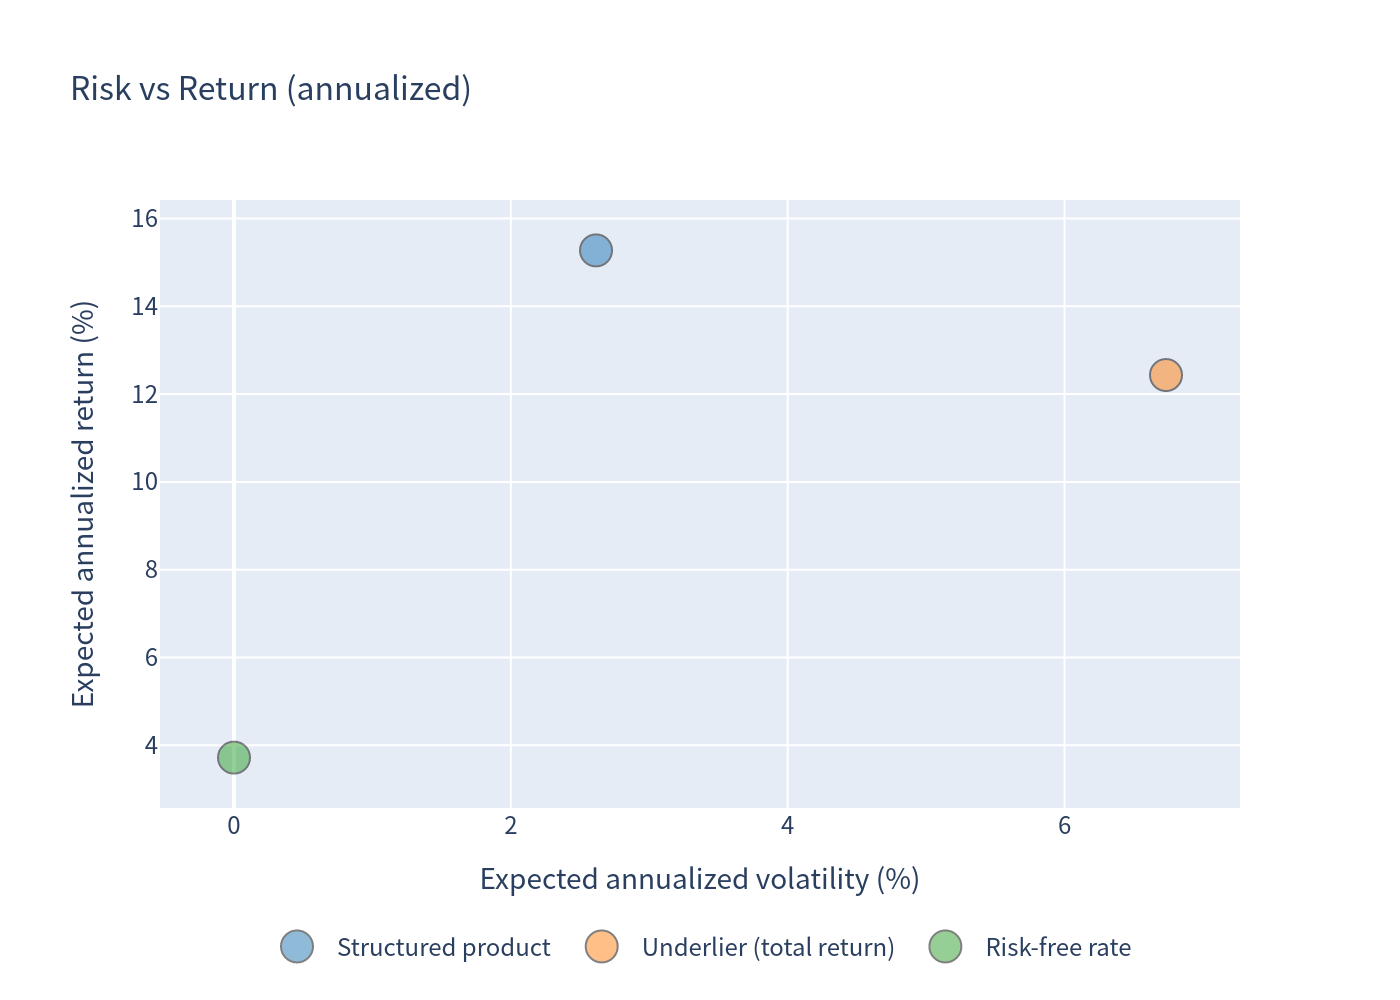
Annualized expected return vs volatility for the product, the underlier (total return) and the risk-free rate.
Annualized Return Box Plots
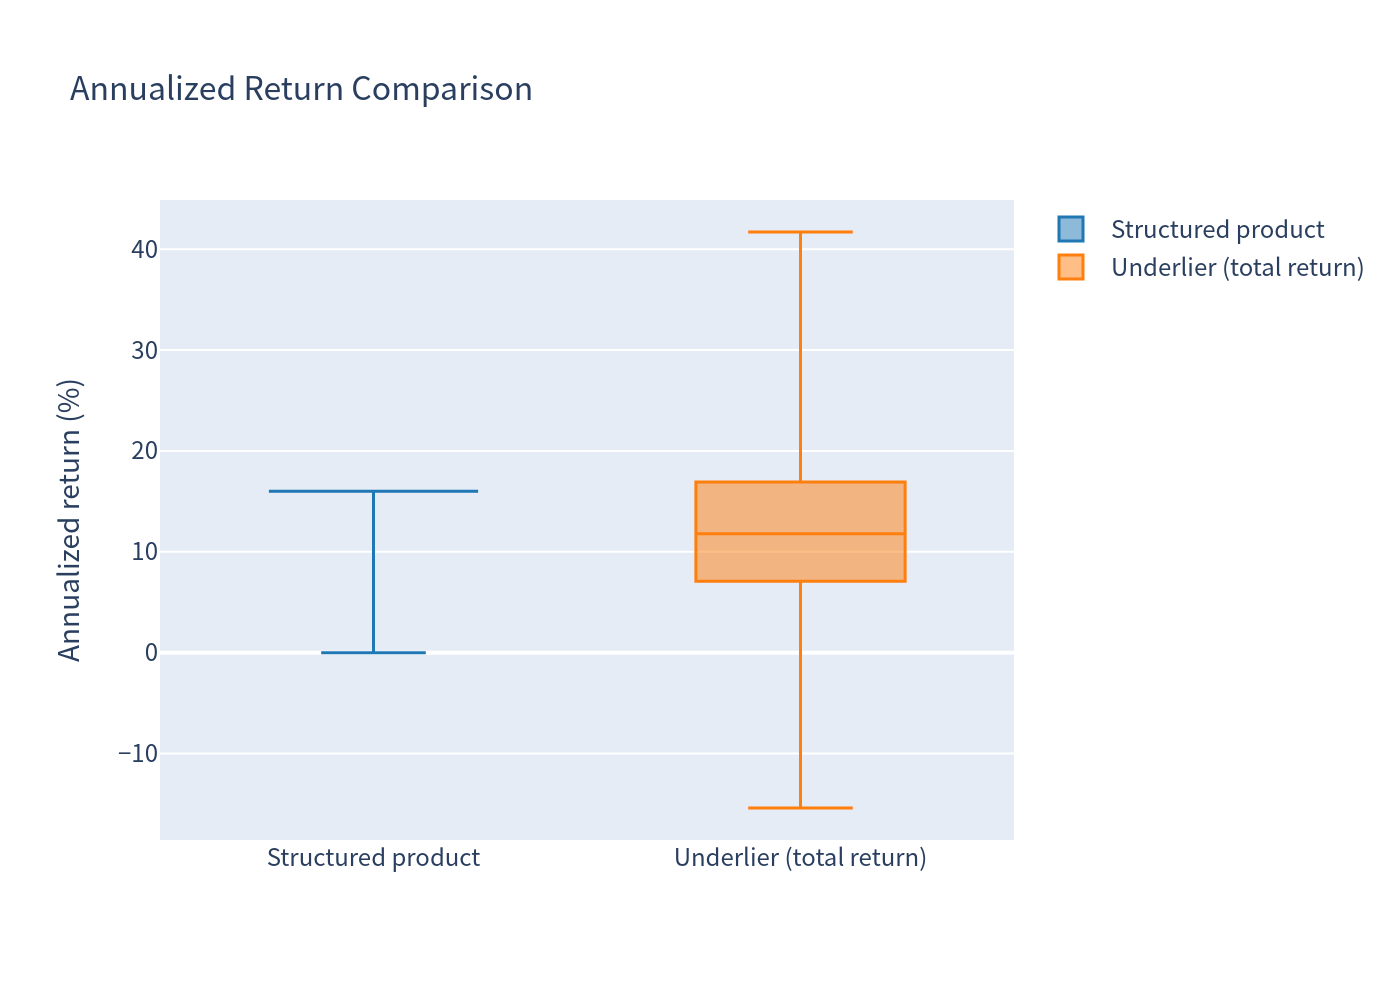
Product returns are tightly grouped (low dispersion) with no negative tail; the underlier shows wider dispersion.
Holding Period Distribution
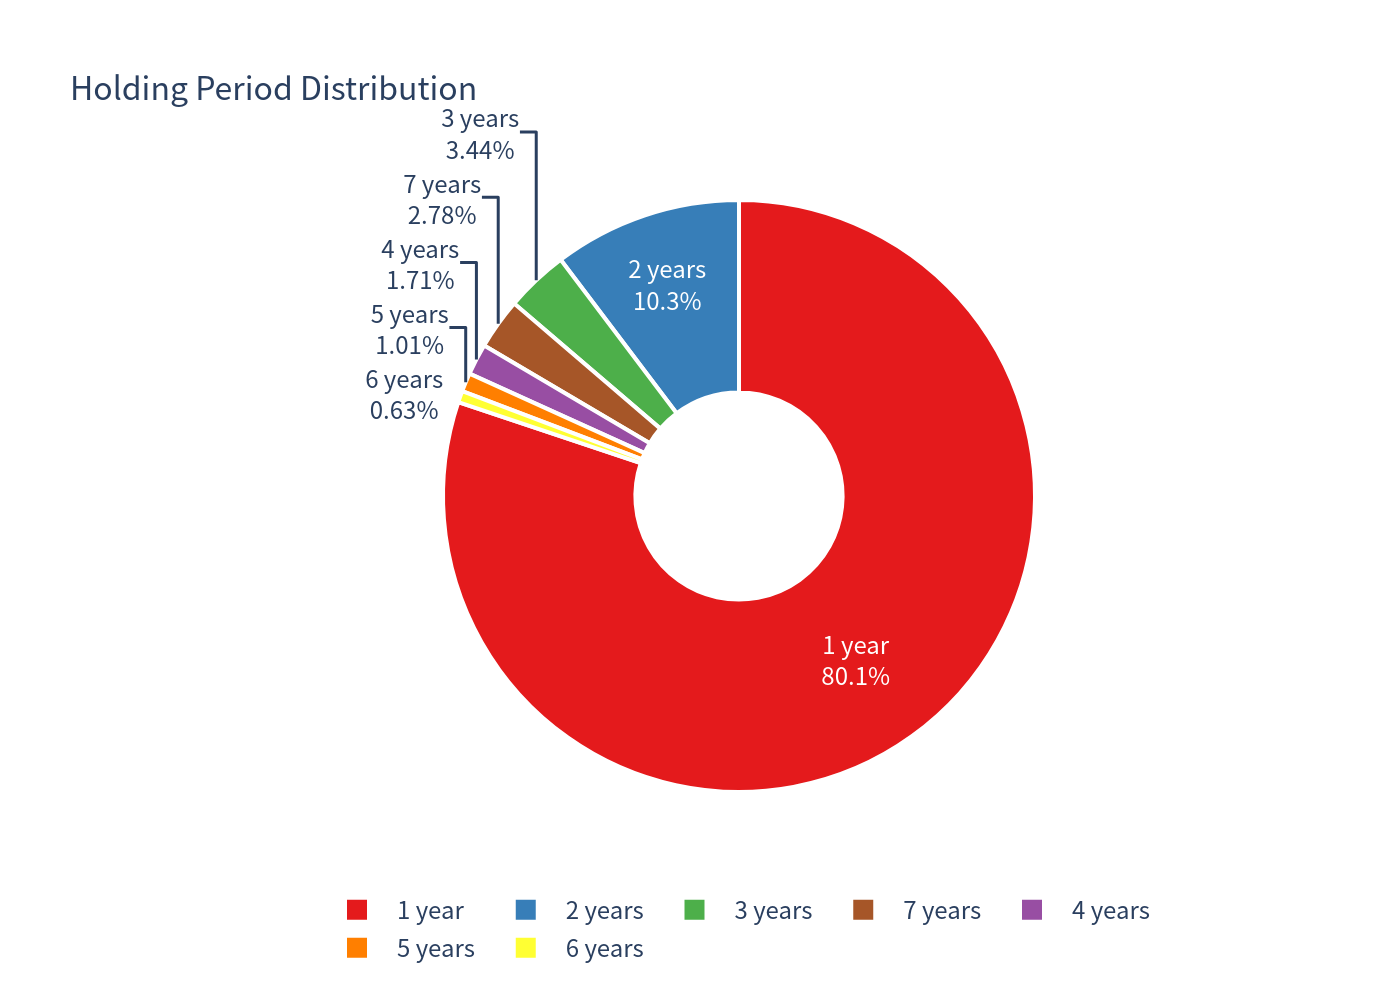
~80% of scenarios are redeemed after just 1 year.
Positives worth noting:
- Hard principal floor: the payoff can never be less than the $1,000 principal (no coupons, no knock-in, no barrier), so the simulated probability of loss is 0% and the 99% 1-year VaR is 0%.
- Attractive fixed step-up payments: when the index is at/above the (modest) step-up thresholds, the note pays ~16.00% per annum — a fixed "jump" return well above the ~3.72% risk-free rate, with no downside participation.
- Step-up thresholds start low (101%): with the underlier's return profile, auto-call is frequent (≈80% after one year), converting index upside into a high, low-volatility coupon-like return.
- Maturity upside, uncapped: if the note survives all six auto-call dates, the investor still participates 100% in any index gain above initial at maturity.
- Diversified underlier: the underlying Amplitude-style index combines equities and U.S. Treasuries, giving it materially lower long-run volatility (≈11% from daily history) than a pure-equity index.
Figures shown to 2 decimal places. Underlier total return includes an estimated ~2.19% p.a. distribution yield (dividends/coupons, no compounding).