
12.00% p.a. Multi Barrier Reverse Convertible on ABB, BKW & Siemens Energy
Headline Simulation Results
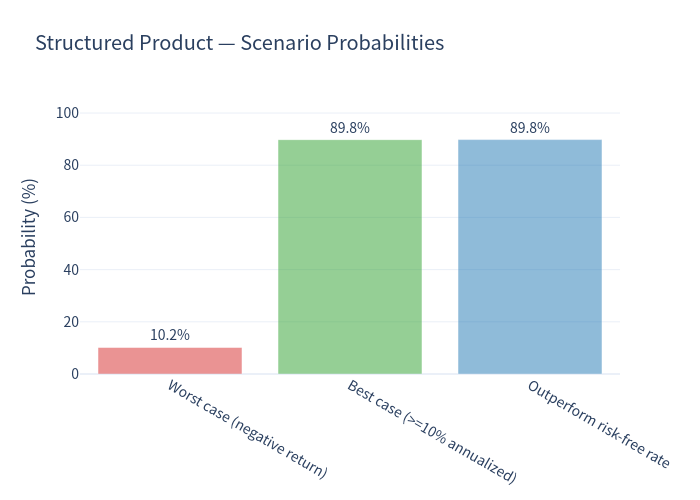
The product is a classic yield-enhancement structure: it wins a coupon in the large majority of scenarios (≈ 89.8% of simulations end with a non-negative return, and almost all of these — 89.81% — earn an annualized return of 10% or more), but it carries a genuine, fat left tail. Once the 55% barrier is breached on any one of the three shares, protection is lost and the investor owns the full downside of the worst-performing share.
1. Product at a Glance
| Feature | Detail |
|---|---|
| Coupon | 12.00% p.a., paid quarterly (3.00% per quarter = CHF 30 per CHF 1,000) |
| Underlyings | ABB Ltd, BKW AG (SIX Swiss Exchange) and Siemens Energy AG (Xetra) — worst-of (3 names) |
| Barrier | 55.00% of initial, continuously observed (any time, any exchange day) |
| Strike | 100.00% of initial |
| Currency | CHF — Quanto (Siemens Energy's EUR exposure is hedged away) |
| Upside | Capped — redemption never exceeds par (100%) plus coupons |
| Early redemption | Issuer callable on the two observation dates (months 6 and 9) |
| Tenor | ~1 year (02/10/2026 → 04/10/2027), par CHF 1,000 |
How it works (plain terms)
- You are paid to wait. Every quarter the note pays 3.00% (12.00% per year) regardless of how the shares perform. Over a full year that is 12 index points of coupon on a notional of 100.
- Downside is conditional, not unconditional. If none of the three shares ever trades at or below 55% of its starting level during the year, you get your par (100%) back at maturity in addition to the coupons.
- Two ways to still get par even if things go wrong. If the barrier is breached but the worst share finishes above its strike (100%) at maturity, you still receive par. You are only hurt when the barrier is breached and the worst share finishes below 100%.
- If you are hurt, you own the worst share. In that case you take the full fall of the weakest of the three shares (delivered physically / cash equivalent). Example: if the worst share ends at 60% of its start, your notional redeems at ~60 points (plus the coupons already paid).
- The issuer can cut it short. On either observation date, if the worst share is at or above its starting level, the issuer may redeem early at par plus the coupon — you lose the remaining coupon stream but not your capital.
2. Key Risk & Return Statistics
| Metric (annualized) | Structured Product | Benchmark — equal-weight basket (incl. dividends) | Risk-free rate |
|---|---|---|---|
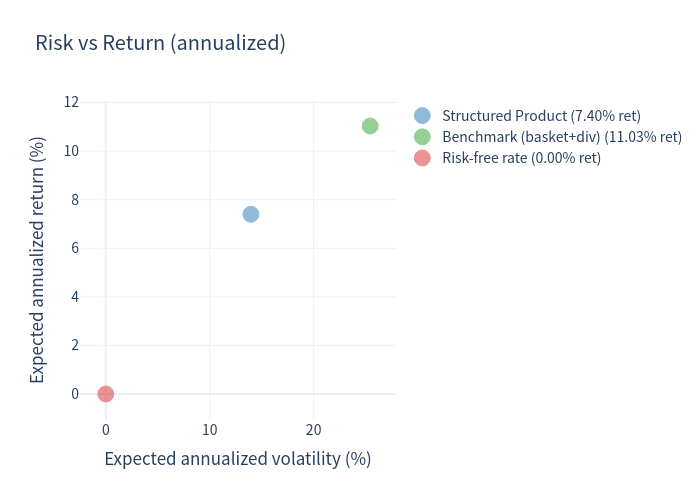
| Expected return | 7.40% | 11.03% | 0.00% |
| Expected volatility | 13.96% | 25.44% | 0.00% |
| Probability of loss | 10.17% | 38.26% | — |
| 99% VaR (1 year) | -44.22% | -33.62% | — |
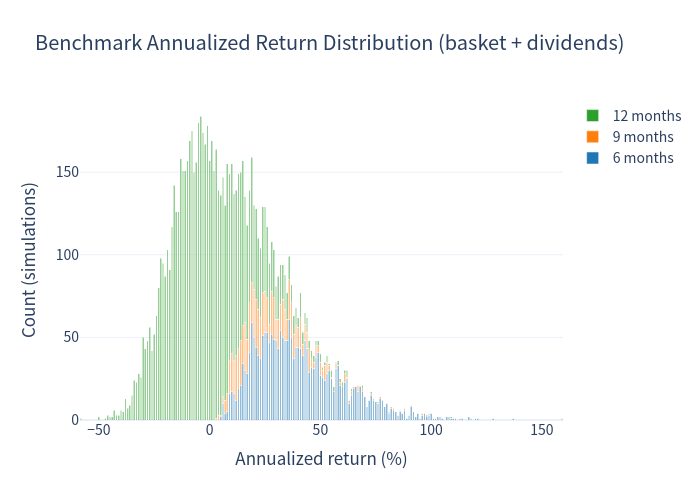
The benchmark is an equal-weighted basket of the three shares (ABB, BKW and Siemens Energy) including an average dividend yield of 1.56%, measured over each simulation's actual holding period so that the comparison is horizon-matched.
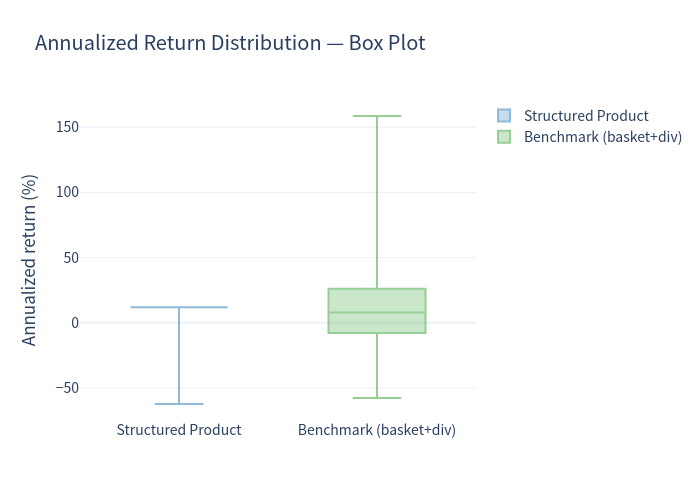
Reading the table: the note delivers a much smoother return profile than holding the shares directly (volatility 13.96% vs 25.44%; loss probability 10.17% vs 38.26%). In exchange it gives up upside — its expected return (7.40%) sits below the basket (11.03%) and it does not reduce the extreme tail: its 99% VaR (-44.22%) is actually worse than the basket's (-33.62%), because when the barrier fails the investor is fully exposed to the worst-of name.
3. Simulation Charts
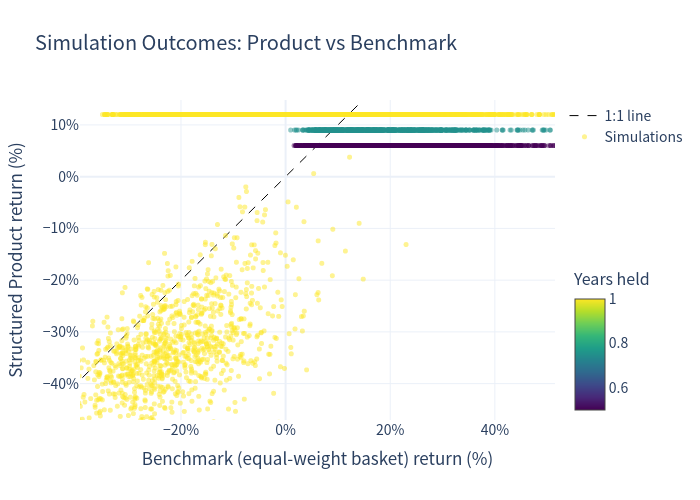
Simulation outcomes — product vs benchmark
Colour = years held. Almost all points sit on/below the 1:1 line (upside is capped), with a cluster at exactly 12% annualized (par + full coupon) and a fan of losses where the barrier failed.
Annualized return distribution — benchmark
Equal-weight basket + dividends.
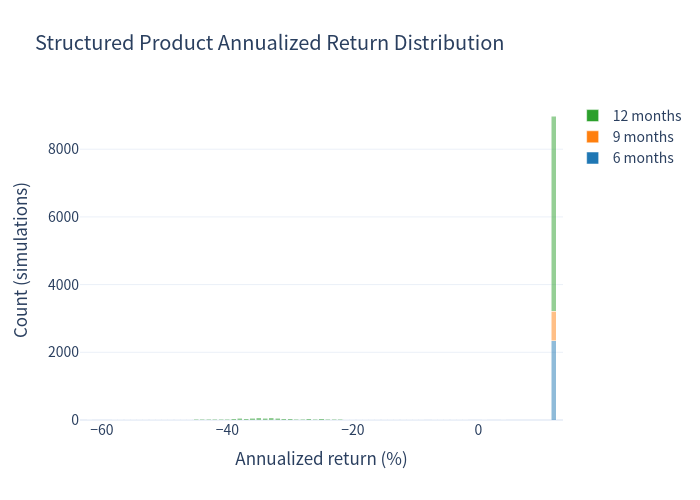
Annualized return distribution — structured product
Note the dominant spike at 12% (the capped, coupon-only outcome) and the loss tail.
Scenario probabilities
Risk versus return
Annualized return — box plot comparison
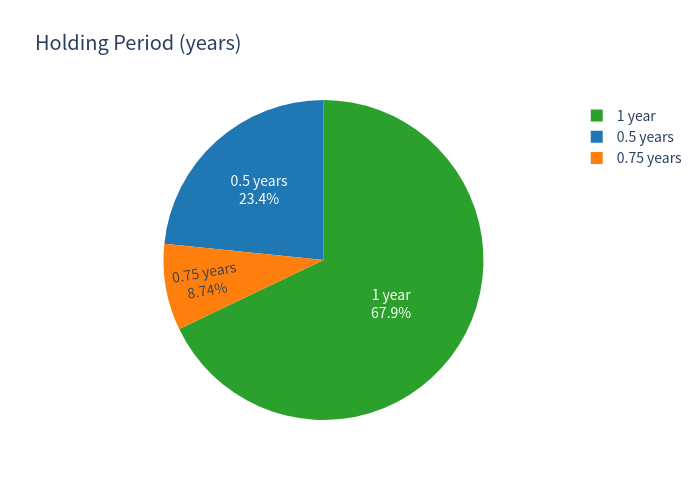
Holding period and coupon count
The note is called early in about 32% of paths (23.4% at month 6, 8.7% at month 9); the rest run to maturity.
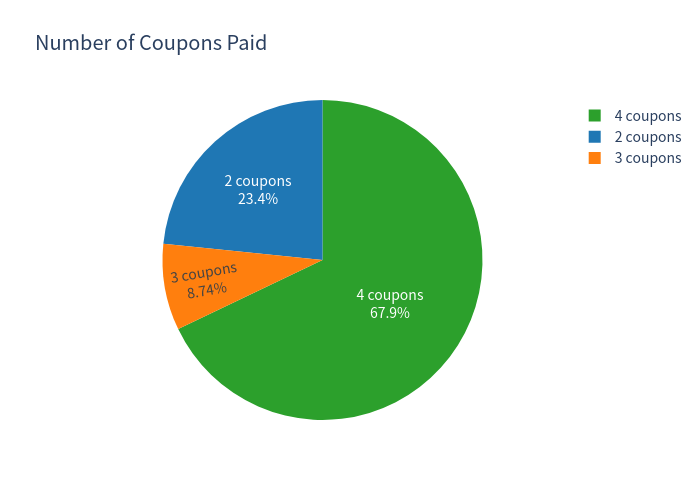
Coupons paid
4. Holding-Period Nuance
Because the note can be redeemed early, the annualized figures must be read together with the total return and the holding period:
- Expected holding period: 10.34 months.
- Mean total return over the realized holding period: 5.74% (median 12.00%).
- About 32% of simulations end before 12 months — those paths collect only 2 or 3 coupons (6% or 9% total) but annualize to 12.00%, which can make short-dated annualized numbers look flattering relative to the cash actually received.
- The gap between the median total return (12.00%) and the mean (5.74%) has two drivers: (i) early-redemption paths, which collect only 2–3 of the four coupons (6% or 9%) rather than the full 12%, and (ii) the barrier-breach loss tail, where a minority of paths lose heavily. About 68% of paths run to maturity and receive all four coupons (subject to the barrier outcome).
5. Investment Commentary
Strengths
- High, unconditional coupon. 12.00% p.a. paid quarterly in any case while the note is alive — attractive versus a CHF risk-free rate of ~0%.
- Quanto CHF. No FX risk even though one underlying (Siemens Energy) trades in EUR.
- Layered protection. Two separate conditions must both fail before the investor loses capital (barrier breach and worst-of finishing below strike), and even a barrier breach is forgiven if the worst name recovers above its start.
- Short ~1-year tenor and a smooth, low-volatility payoff: the note produces a non-negative return in ~90% of simulations.
- Early-redemption upside. A call returns par plus the current coupon, locking in a 12% annualized outcome.
Risks worth flagging
- Worst-of / single-name trigger. Only one of ABB, BKW or Siemens Energy needs to close at or below 55% on any exchange day to strip away downside protection — the correlation between the three names works against the investor.
- Capped upside with uncapped (below-barrier) downside. The investor keeps the coupon but forgoes any share appreciation, yet retains the full downside of the worst name once the barrier is breached. That asymmetry is why the 99% VaR (-44.22%) is worse than the underlying basket's.
- Continuous barrier. Observation is any time, any exchange day over the full year, not just at maturity, so an intra-day spike below 55% is enough.
- Issuer optionality. The senior coupon stream can be terminated by the issuer at months 6 and 9.
- Credit risk. Investors are exposed to the credit of the issuer (Basler Kantonalbank).