
Market-Linked Certificates of Deposit — EURO STOXX 50® Index
1. Headline Simulation Results
Based on a 5-year (60-month) Monte Carlo simulation (10,000 paths) of the EURO STOXX 50® Index, the principal-protected CD is expected to deliver:
| Metric | Value |
|---|---|
| Expected annualized return | 5.72% |
| Probability of negative returns | 0.00% |
| 99% confidence VaR (1 year) | 0.00% |
| Expected total return over the 5-year term | 33.11% |
| Probability of outperforming the risk-free rate (3.68%) | 75.40% |
The product's downside is fully floored at the deposit amount: in no simulated scenario did the investor lose principal, which is why both the probability of loss and the 1-year 99% VaR are 0.00%. The trade-off for this protection is a capped upside.
2. Product Overview
| Field | Detail |
|---|---|
| Product type | Market-Linked Certificate of Deposit (principal-protected) |
| Issuer | Morgan Stanley Bank, N.A. |
| Underlying | EURO STOXX 50® Index (single index) |
| Currency | USD |
| Deposit amount | $1,000 per CD |
| Term | 5 years (issue Feb 27, 2026 → maturity Feb 27, 2031) |
| Participation rate | 125% |
| Upside cap | Maximum payment ≈ $1,450 per CD (145% of deposit) |
| Coupon | None |
| Principal protection | 100% of deposit amount (FDIC-insured up to applicable limits) |
| Early redemption | None |
How it works (in plain terms)
At maturity, the investors' outcome is one of two simple branches:
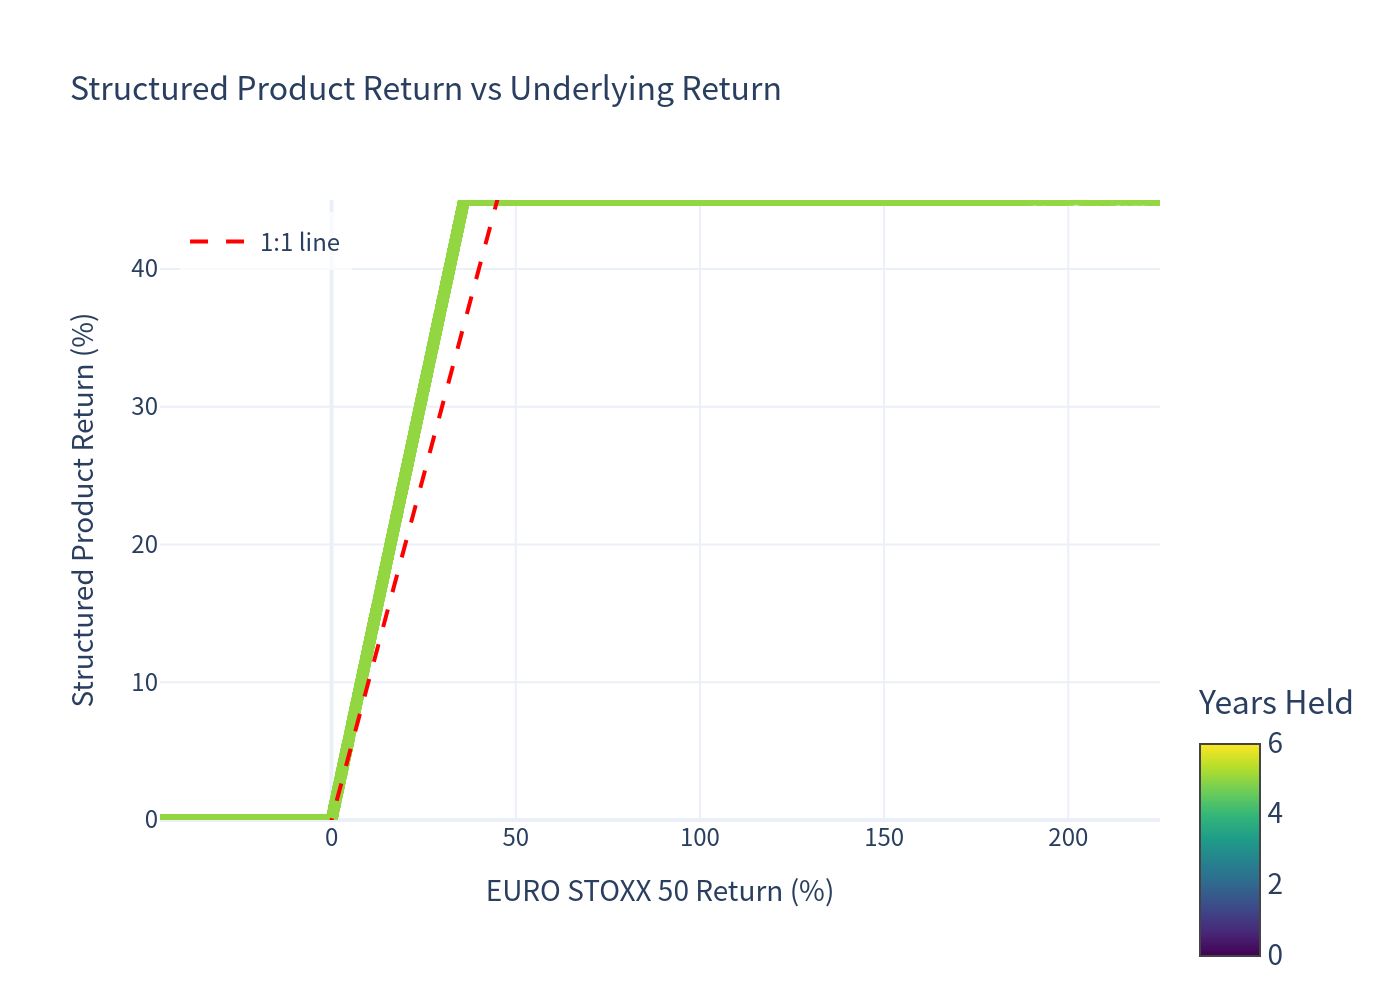
- If the index rises — the investor receives the $1,000 deposit plus 125% of the index gain, up to a maximum payout of about $1,450 (a +45% total return, ≈7.71% annualized). The 125% participation magnifies upside, but the cap is reached once the index gains 36% or more.
- If the index falls or is flat — the investor simply receives the $1,000 deposit back. There is no loss of principal (subject to FDIC limits and the issuer's creditworthiness for any uninsured amount).
There are no coupons and no early-redemption features; the CD is a single, buy-and-hold, five-year observation.
3. Key Statistics
Comparison of the structured product against the underlying index (5-year horizon). The "Total Return" column adds the index's dividend yield (2.51%) to the price return.
| Instrument | Expected Ann. Return | Ann. Volatility | Prob. of Loss | 99% VaR (1 yr) |
|---|---|---|---|---|
| Structured Product | 5.72% | 3.00% | 0.00% | 0.00% |
| Underlying (EURO STOXX 50, price) | 8.46% | 8.28% | 15.03% | −11.78% |
| Underlying Total Return (incl. dividends) | 10.97% | 8.28% | 9.49% | −9.27% |
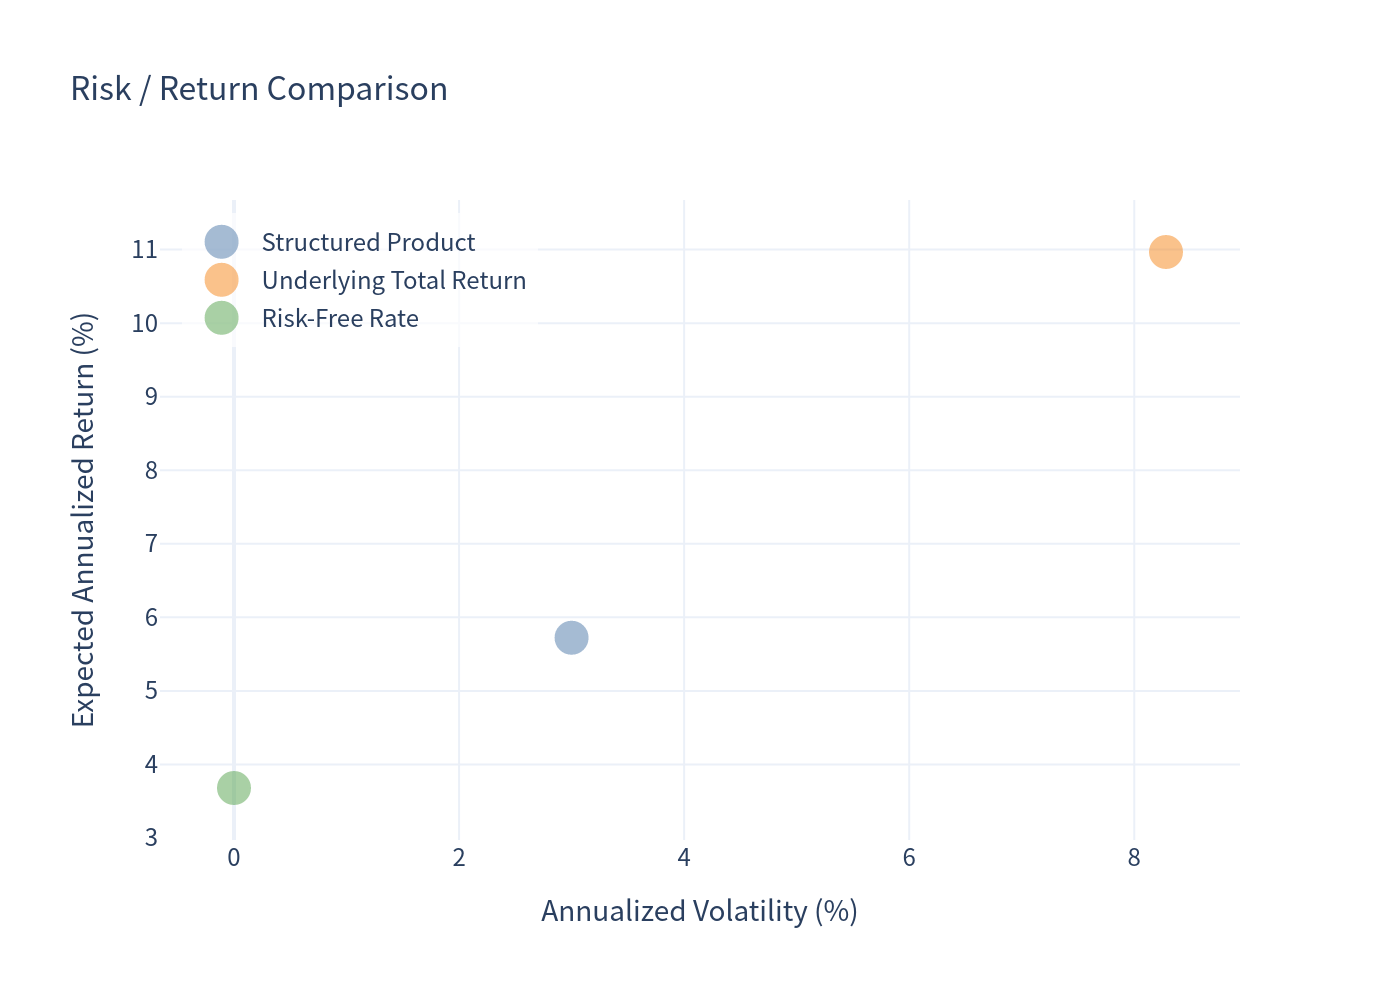
| Risk-free rate (1-yr avg T-bill) | 3.68% | 0.00% | — | — |
Interpretation: The CD cuts the volatility to roughly a third of the underlying (3.00% vs 8.28%) and eliminates downside (0.00% loss probability, versus 15.03% for the index). In exchange, its expected annualized return (5.72%) sits well below the index's total return (10.97%) and only modestly above the risk-free rate (3.68%), reflecting the cost of the principal guarantee and the upside cap.
4. Simulation Charts
4.1 Outcome Scatter — Product vs Underlying
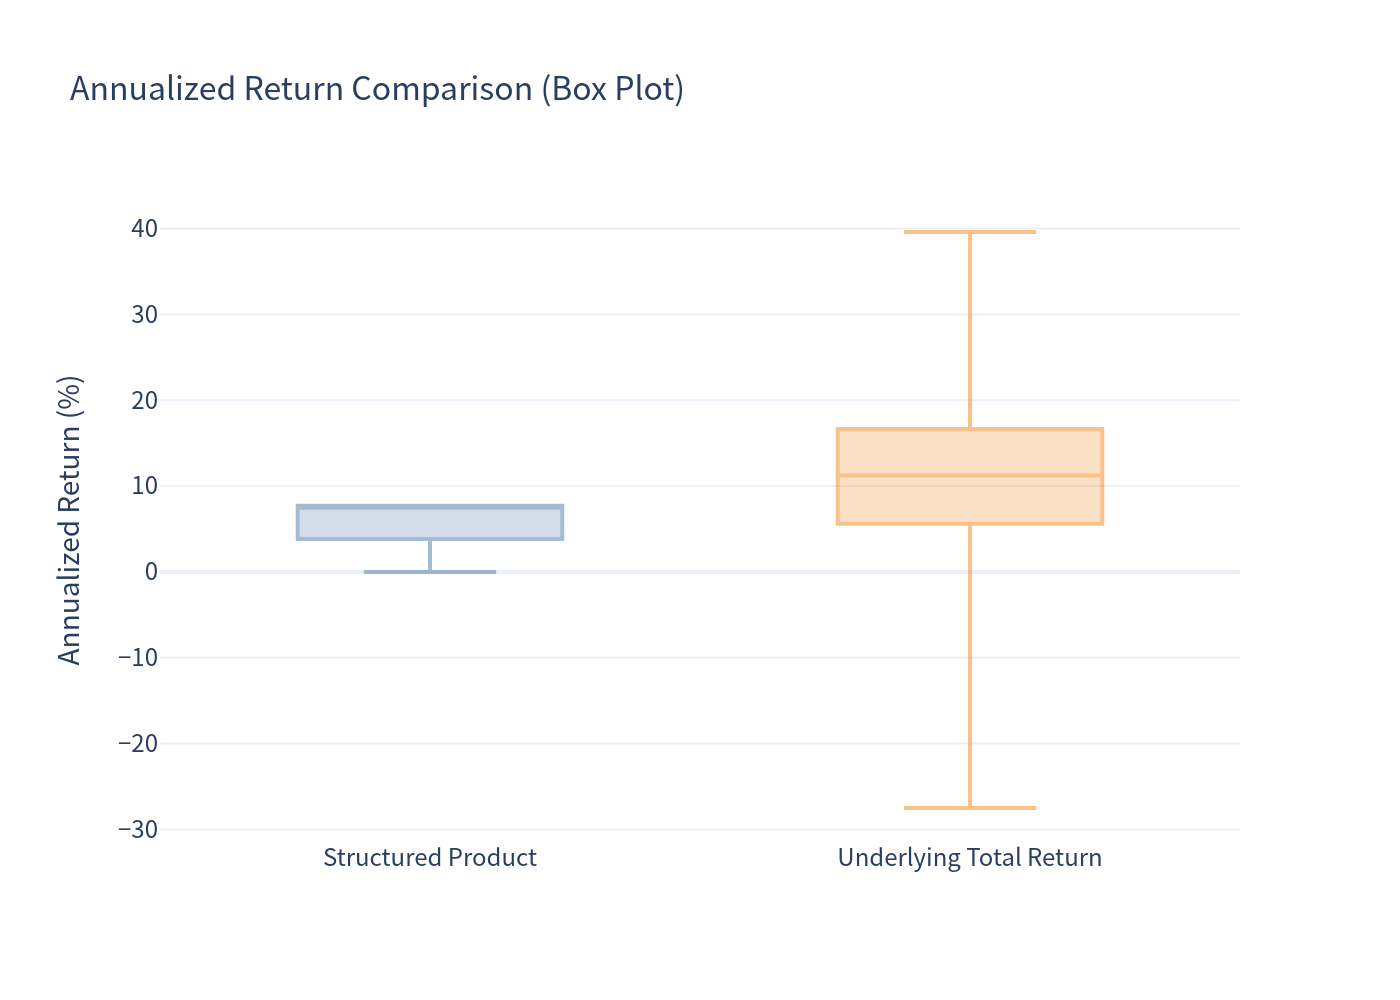
Each point is one simulation. The product return is capped at +45% (flat top) while it never falls below 0%, in sharp contrast to the index, which spans roughly −47% to +225% (1st–99th percentile).
4.2 Underlying Annualized Return Distribution
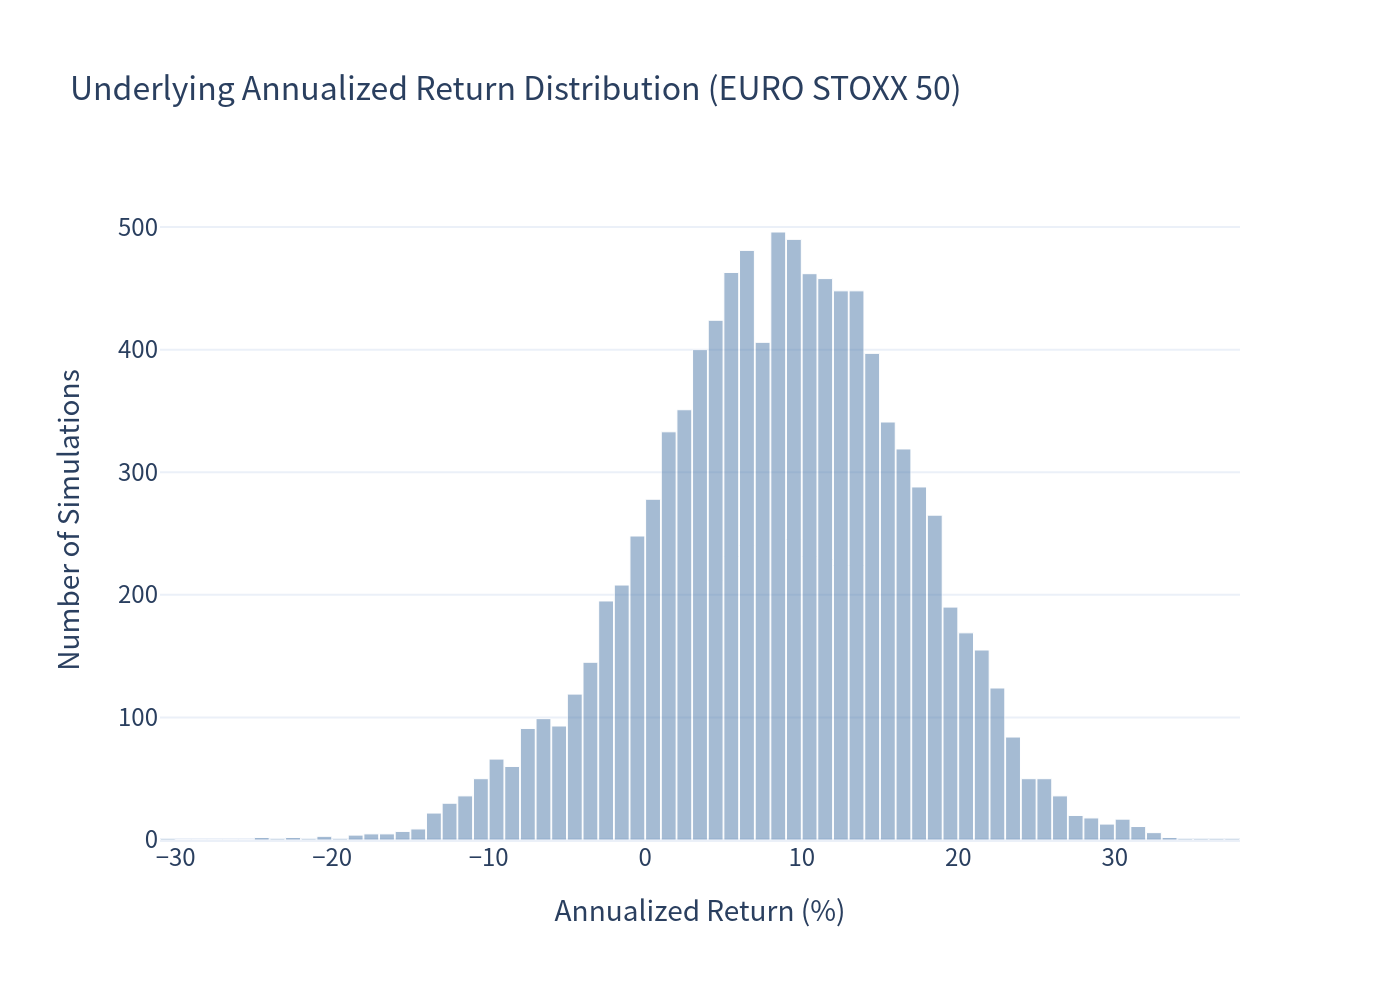
Distribution of annualized returns for the EURO STOXX 50® Index across simulated paths.
4.3 Structured Product Annualized Return Distribution
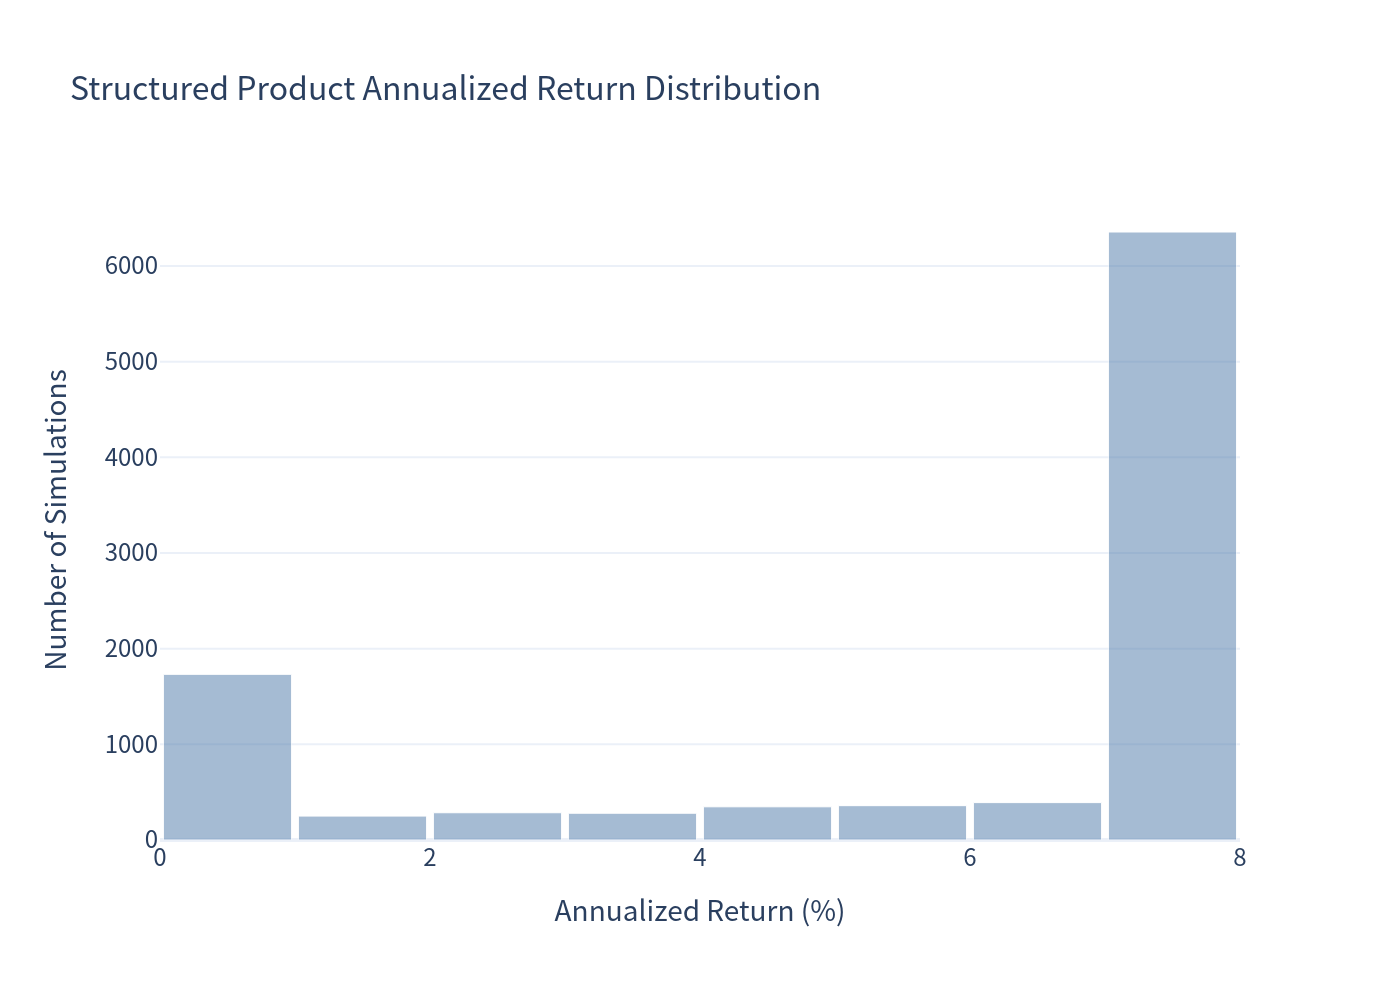
Notice the large spike at 0% (the principal-protection floor) and the concentration at 7.71% (the capped maximum).
4.4 Scenario Probabilities
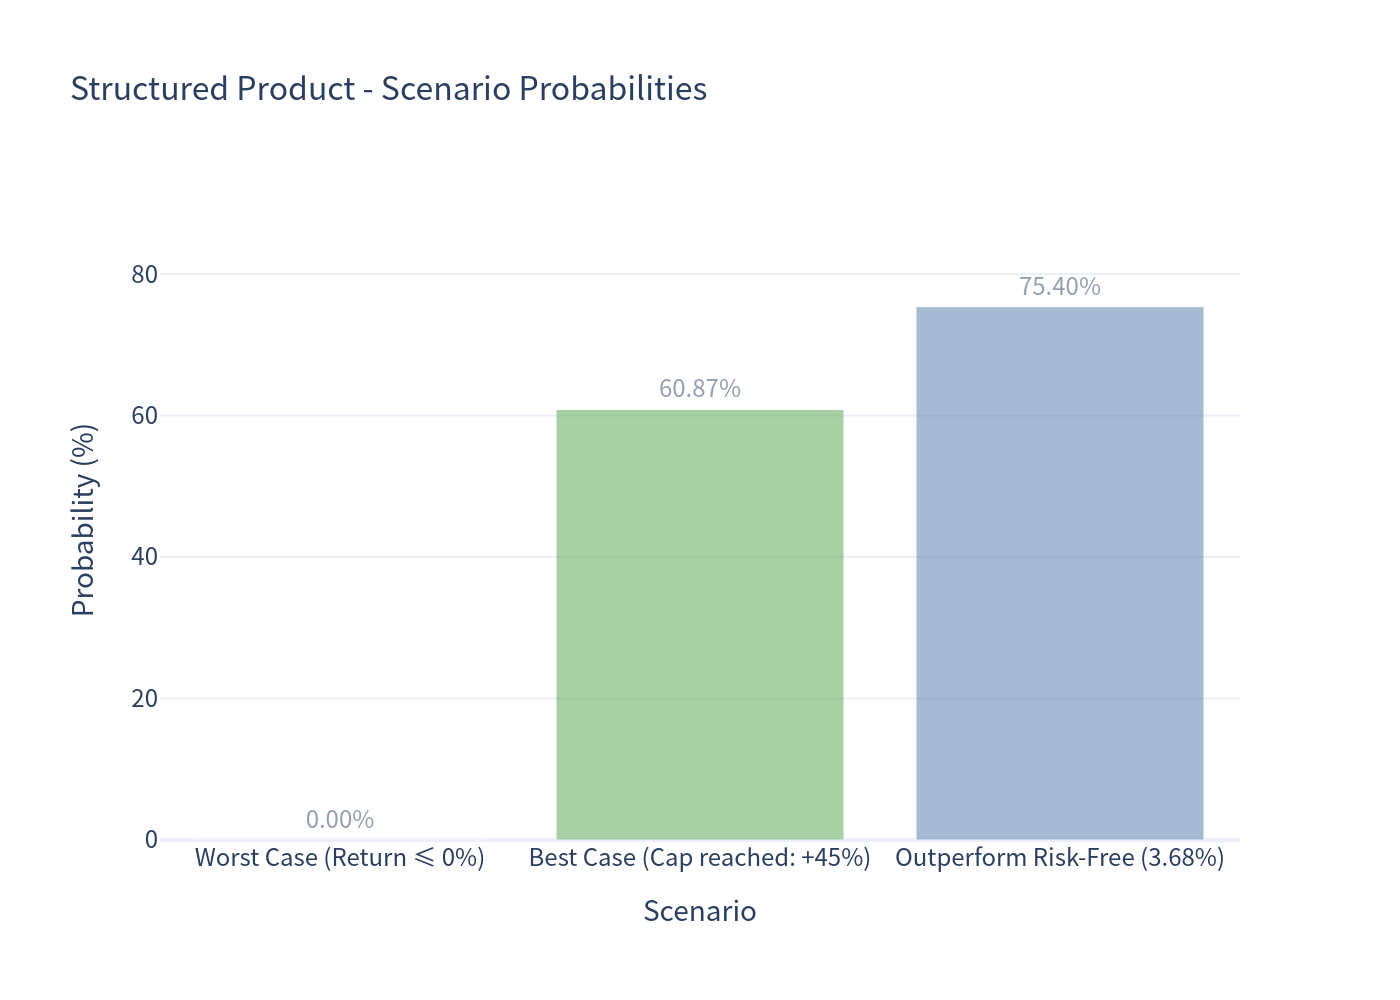
In 60.87% of scenarios the index gains 36% or more, meaning the CD's cap binds and upside is forgone. The product still beats the risk-free rate 75.40% of the time, and never loses money.
4.5 Risk / Return Comparison
The CD plots far to the left (low volatility) of the underlying total return, but also lower on the return axis.
4.6 Box Plot — Annualized Return
Dispersion of annualized returns for the product compared with the underlying index.
5. Investment Commentary
Potential advantages
- Full principal protection — the deposit amount is returned even if the index falls sharply, and is FDIC-insured up to applicable limits.
- Leveraged upside — the 125% participation rate amplifies index gains up to the cap.
- High put-protection efficiency — 0.00% probability of loss and a 1-year 99% VaR of 0.00%, with volatility roughly a third of the index.
- Beats cash most of the time — the product out-earns the 3.68% risk-free rate in 75.40% of simulations.
Points to weigh
- Capped upside — total return is limited to about +45% (7.71% annualized). In ~61% of scenarios the index exceeds the 36% trigger, so investors forgo substantial upside.
- Lower expected return — 5.72% annualized is meaningfully below the underlying's 10.97% total return; the guarantee and cap carry a real opportunity cost.
- Opportunity cost vs. the index — the CD under-performs the index total return in most up-market simulations.
- Long, illiquid 5-year lock-up with no early redemption and limited secondary-market liquidity.
- Credit / insurance limits — protection depends on the issuer's creditworthiness and FDIC coverage limits for amounts above $250,000.