
Structured Product Analysis Report
25.20% p.a. Multi Barrier Reverse Convertible — Moderna & Novartis (Quanto USD, Issuer Callable)
Headline Simulation Results
| Metric | Value |
|---|---|
| Expected annualized return (structured product) | 22.22% |
| Expected total return over realized holding period | 19.34% |
| Expected holding period | 10.81 months |
| Probability of negative return | 6.46% |
| 99% confidence VaR (1 year, annualized) | -22.10% |
| Underlying basket expected annualized return (incl. dividends) | 17.53% |
| Underlying basket probability of negative return | 25.27% |
Basic Product Information
- Type: Multi Barrier Reverse Convertible (SSPA 1230), Yield-Enhancement, listed on SIX Swiss Exchange.
- Underlyings: Moderna Inc (MRNA, US) and Novartis AG (NOVN, Switzerland), worst-of for maturity redemption; barrier triggers on at least one underlying.
- Coupon: 25.20% p.a., paid quarterly as USD 63.00 per USD 1,000 denomination (6.30% per coupon; 5 coupons in total). Coupons are paid regardless of underlying performance and are still paid on an early-redemption date.
- Currency: USD with Quanto protection (no CHF/USD FX risk on the Novartis leg).
- Barrier: 55% of initial fixing level, observed continuously during the whole product life (07/08/2026 – 05/11/2027).
- Upside: Capped — redemption is at most 100% (par) plus coupons; no participation in underlying gains.
How it works (layman's explanation)
The investor receives a high fixed quarterly coupon (6.30% per quarter = 25.20% p.a.) for as long as the product is alive, no matter how the two stocks perform. The issuer may call the product early (at months 6, 9 or 12): if called, the investor gets the full USD 1,000 back plus the coupon for that quarter, and the product ends. If not called, the product runs to maturity (month 15), where the investor receives the final coupon plus either:
- 100% of capital back if neither stock ever fell to or below 55% of its start level (no barrier event), or if a barrier event occurred but the worst-performing stock still finished at or above its start level; or
- Shares of the worst-performing stock if a barrier event occurred and the worst performer finished below its start level — in which case the loss is proportional to that stock's decline (fractional shares paid in cash).
So the investor is paid to bear the risk that both (a) at least one stock breaks below 55% of its start level at any point during the term, and (b) the worst performer finishes below its start level at maturity.
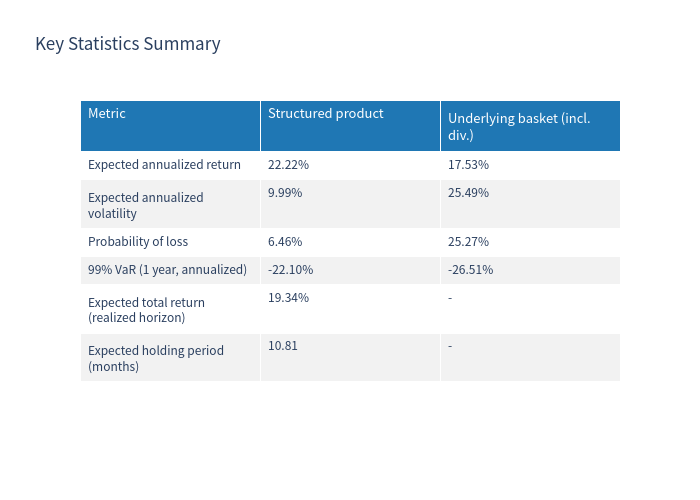
Key Statistics (Structured Product vs Underlying Benchmark)
| Metric | Structured product | Underlying basket (incl. dividends) |
|---|---|---|
| Expected annualized return | 22.22% | 17.53% |
| Expected annualized volatility | 9.99% | 25.49% |
| Probability of loss | 6.46% | 25.27% |
| 99% VaR (1 year, annualized) | -22.10% | -26.51% |
| Expected total return (realized horizon) | 19.34% | — |
| Expected holding period | 10.81 months | — |
Underlying benchmark = equal-weighted basket of Moderna and Novartis price performance (dividends added, compounding ignored).
Additional statistics
- Probability that the issuer calls early: 54.88%.
- Probability that a barrier event occurs (at least one underlying ≤ 55%): 7.61%.
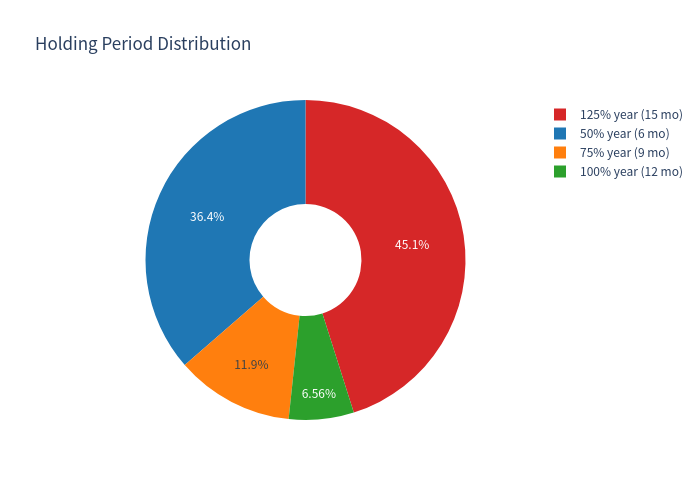
- Distribution of holding periods: 36.39% (6 months), 11.93% (9 months), 6.56% (12 months), 45.12% (15 months).
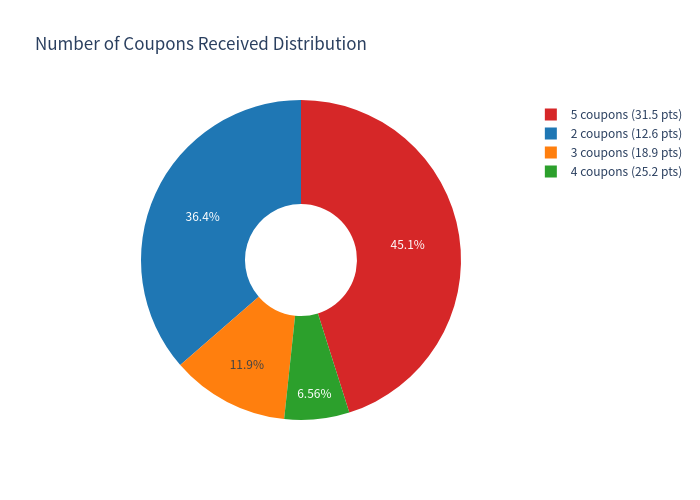
- Distribution of coupons received: 36.39% (2), 11.93% (3), 6.56% (4), 45.12% (5).
- On losing paths (6.46% of simulations), the mean total return was -17.95% and the worst total return was -42.87%.
Charts
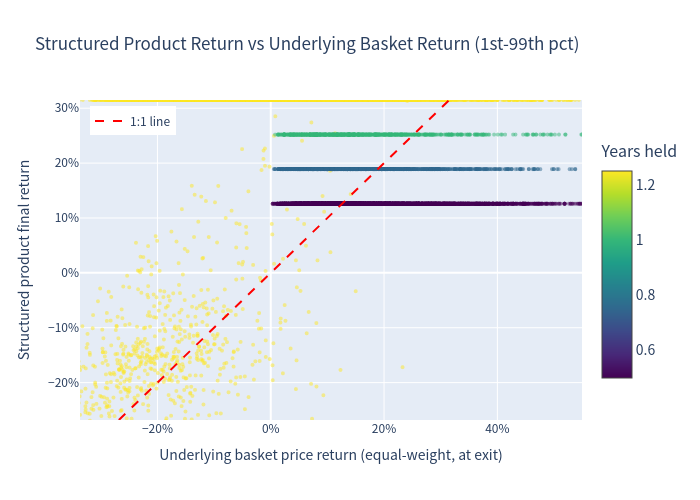
1. Simulation outcomes — product return vs underlying basket return
Scatter plot of simulated total returns: structured product vs underlying basket.
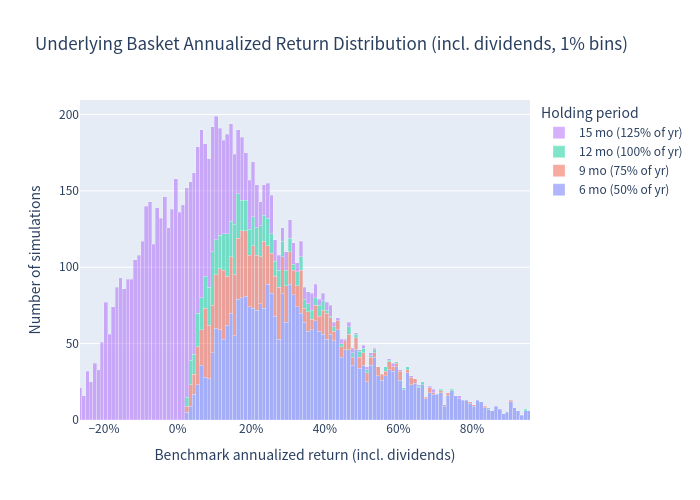
2. Underlying basket annualized return distribution (incl. dividends)
Histogram of simulated annualized returns for the equal-weighted underlying basket.
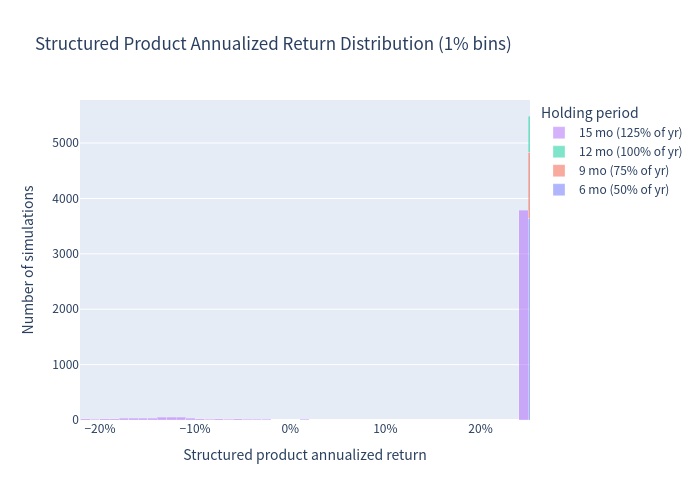
3. Structured product annualized return distribution
Histogram of simulated annualized returns for the structured product.
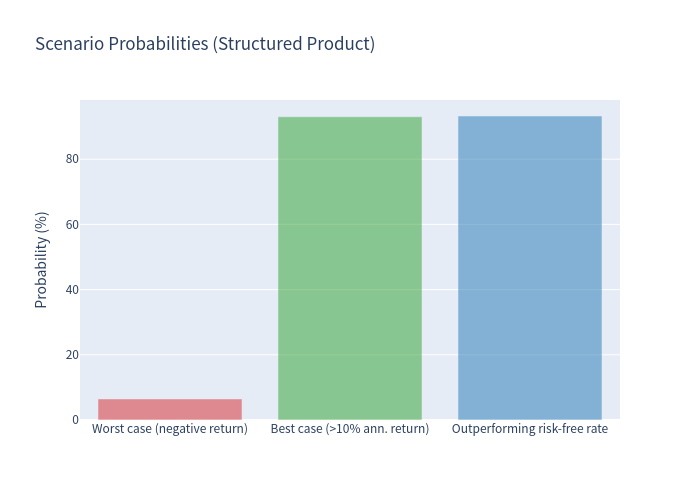
4. Scenario probabilities
Probability of each simulated outcome scenario for the product.
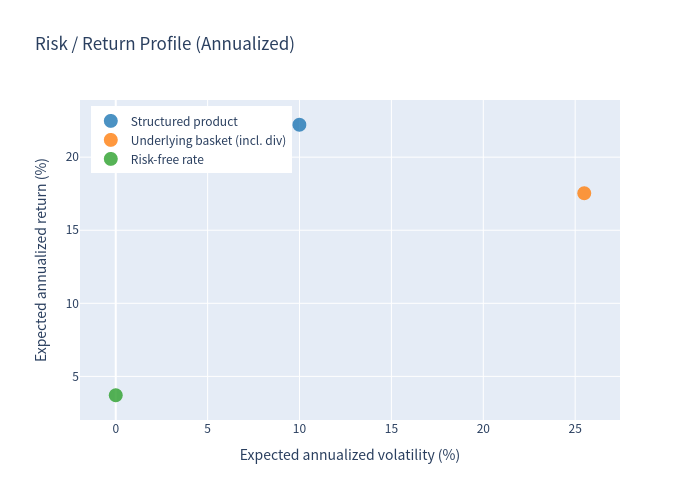
5. Risk / return profile
Risk-return positioning of the structured product relative to the underlying basket.
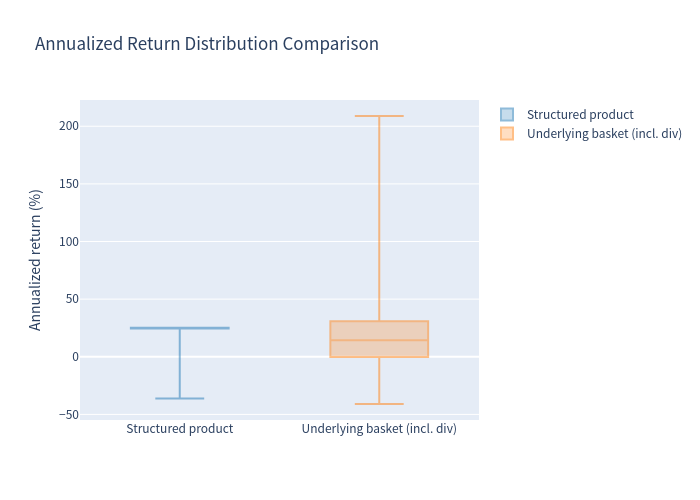
6. Annualized return box plot comparison
Box plot comparing the distribution of annualized returns between the product and the underlying basket.
7. Holding period distribution
Distribution of realized holding periods (6, 9, 12 or 15 months).
8. Number of coupons received
Distribution of the number of coupons received across simulated paths.
9. Key statistics summary
Summary table of the key statistics presented in this report.
Investment Commentary
Notable strengths
- Very high coupon: 25.20% p.a. paid quarterly regardless of underlying performance — among the highest yield-enhancement structures, and the coupon is not conditional on a barrier.
- Meaningful downside cushion: the barrier sits at 55% of initial levels, so the investor keeps 100% of capital in the large majority of scenarios; only 7.61% of simulated paths experienced a barrier event, and only 6.46% of paths ended with a negative total return.
- Quanto USD protection: eliminates CHF/USD exchange-rate risk on the Novartis exposure, which is valuable for USD-based investors.
- Issuer call tends to return capital early in rising markets (≈55% of paths are called within the first year), recycling capital back to the investor.
- Compared with the underlying basket, the product delivers a higher expected annualized return (22.22% vs 17.53%) with materially lower volatility (9.99% vs 25.49%) and a lower probability of loss (6.46% vs 25.27%).
Key risk considerations
- Principal loss is possible if a barrier event occurs and the worst performer finishes below its start level at maturity; the loss is then 1-for-1 with the worst stock's decline (worst simulated total return: -42.87%).
- Upside is capped — the investor does not participate in any appreciation of the underlying stocks beyond the fixed coupon.
- Issuer credit risk: the product is an unsecured debt obligation of Leonteq Securities AG (Guernsey Branch, Fitch BBB-).
- Early call shortens income: if the issuer calls the product, the investor stops receiving coupons (only 2–4 coupons instead of 5), which lowers the total income received.
This analysis is for information purposes only and does not constitute investment advice or a suitability assessment.