
info@tokenengine.ai
Morgan Stanley Worst-of INDU & SPX Market-Linked Notes — Simulation Analysis
Headline Results
| Metric | Value |
|---|---|
| Expected annualized return | 4.88% |
| Probability of negative returns | 0.00% (principal protected) |
| 99% confidence VaR (1 year) | 0.00% |
| Expected total return (over realized holding period) | 21.78% |
| Expected holding period | 48 months (always held to maturity) |
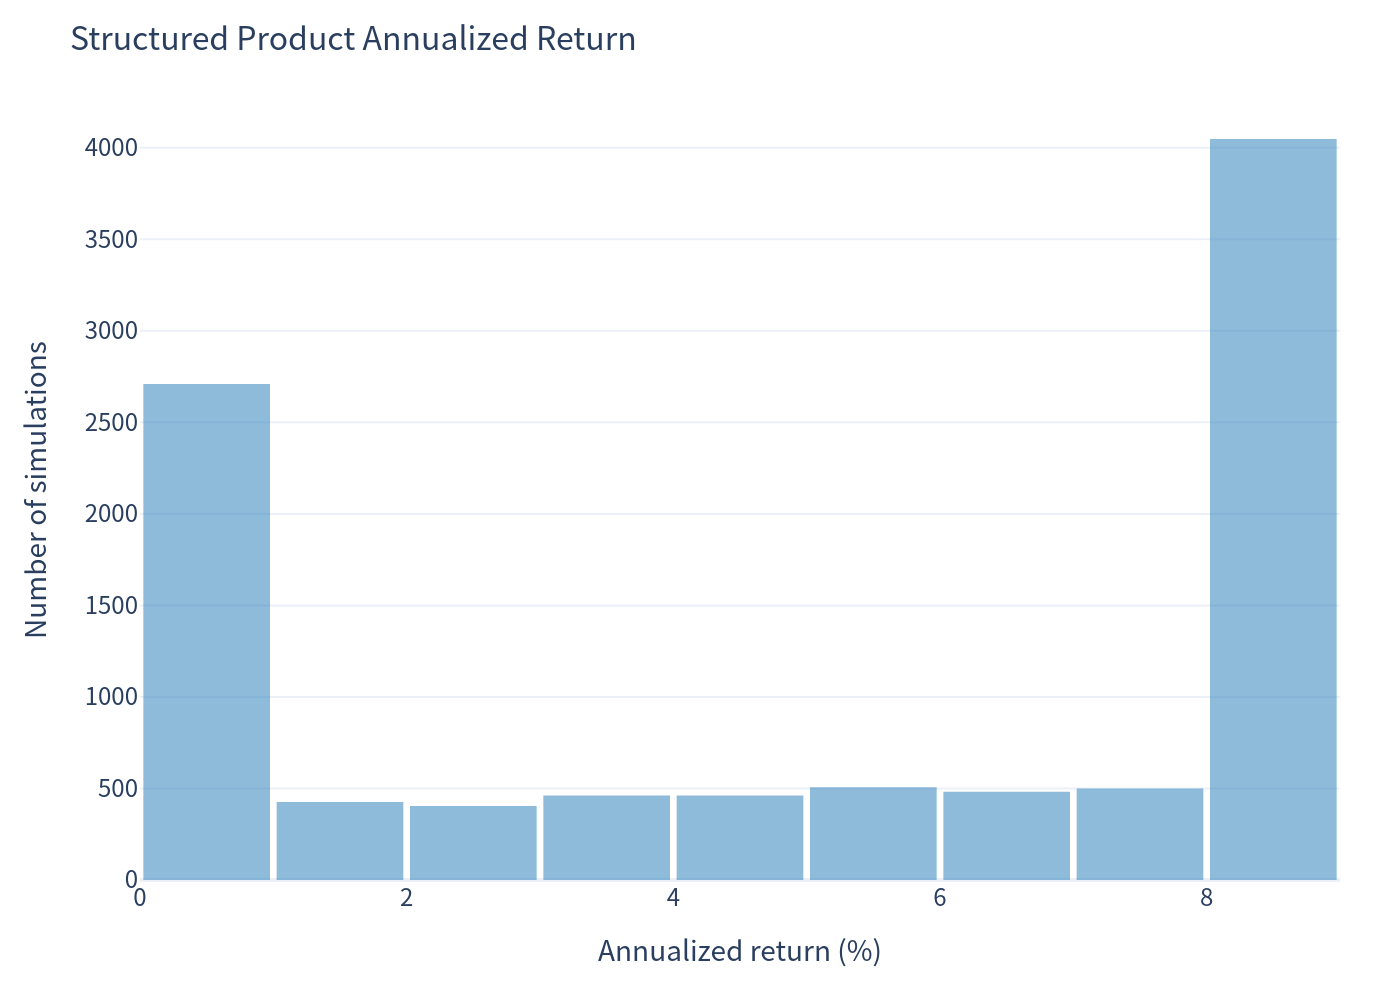
| Maximum annualized return (base-case cap) | 8.29% |
The note is designed as a principal-protected, capped-return investment: in no simulated scenario held to maturity did the product lose money. Its expected annualized return of 4.88% reflects the trade-off of giving up downside risk in exchange for a capped upside. The maximum payment at maturity is $1,375–$1,425 per $1,000 note (+37.5% to +42.5% total); this analysis uses the illustrative +37.5% cap ($1,375) as the base case.
Basic Product Info
How it works (layman's explanation)
This note, issued by Morgan Stanley Finance LLC (guaranteed by Morgan Stanley), is linked to the worst performing of two well-known US equity indices — the Dow Jones Industrial Average (INDU) and the S&P 500 (SPX) — over a 4-year term.
At maturity (August 29, 2030), the payoff depends only on how the two indices performed relative to their levels on the pricing date (August 26, 2026):
- If the worst performer is down at maturity → you receive 100% of your principal ($1,000 per note). No loss.
- If the worst performer is up → you participate 100% in that gain, up to a maximum payment of $1,375–$1,425 per note (+37.5% to +42.5%).
- The note pays no coupons / interest and has no early redemption feature — it is always held to maturity.
In short: full downside protection at maturity, but upside is capped and depends on the laggard of the two indices (worst-of structure).
Key Statistics
Comparison of the structured product against the benchmark — an equal-weight basket of INDU and SPX (with dividends added to the benchmark's annualized returns):
| Metric | Structured Product | Benchmark Total Return |
|---|---|---|
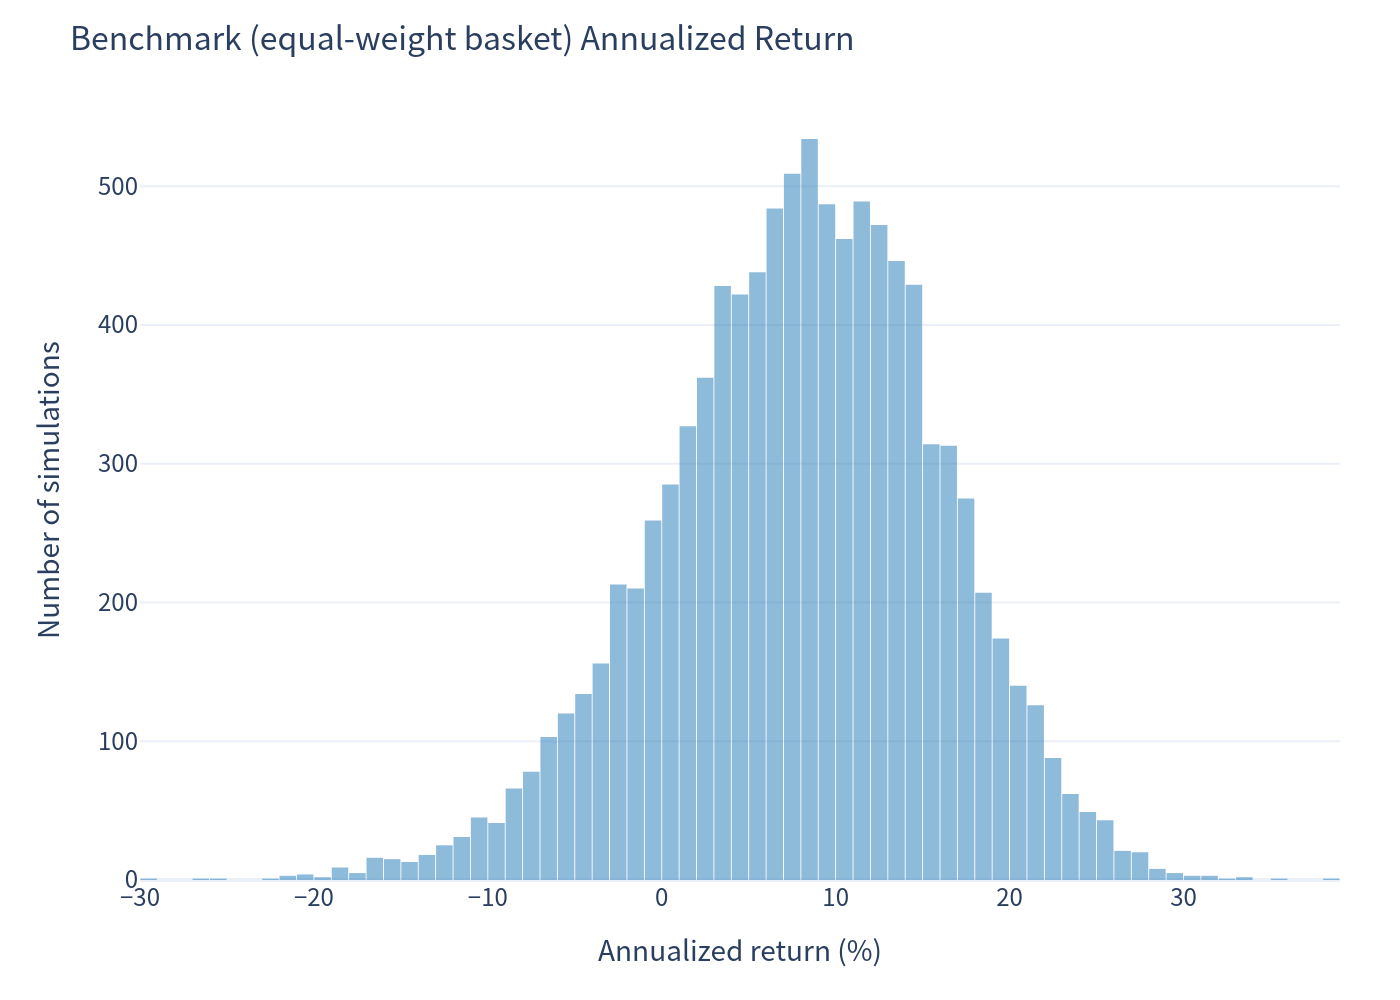
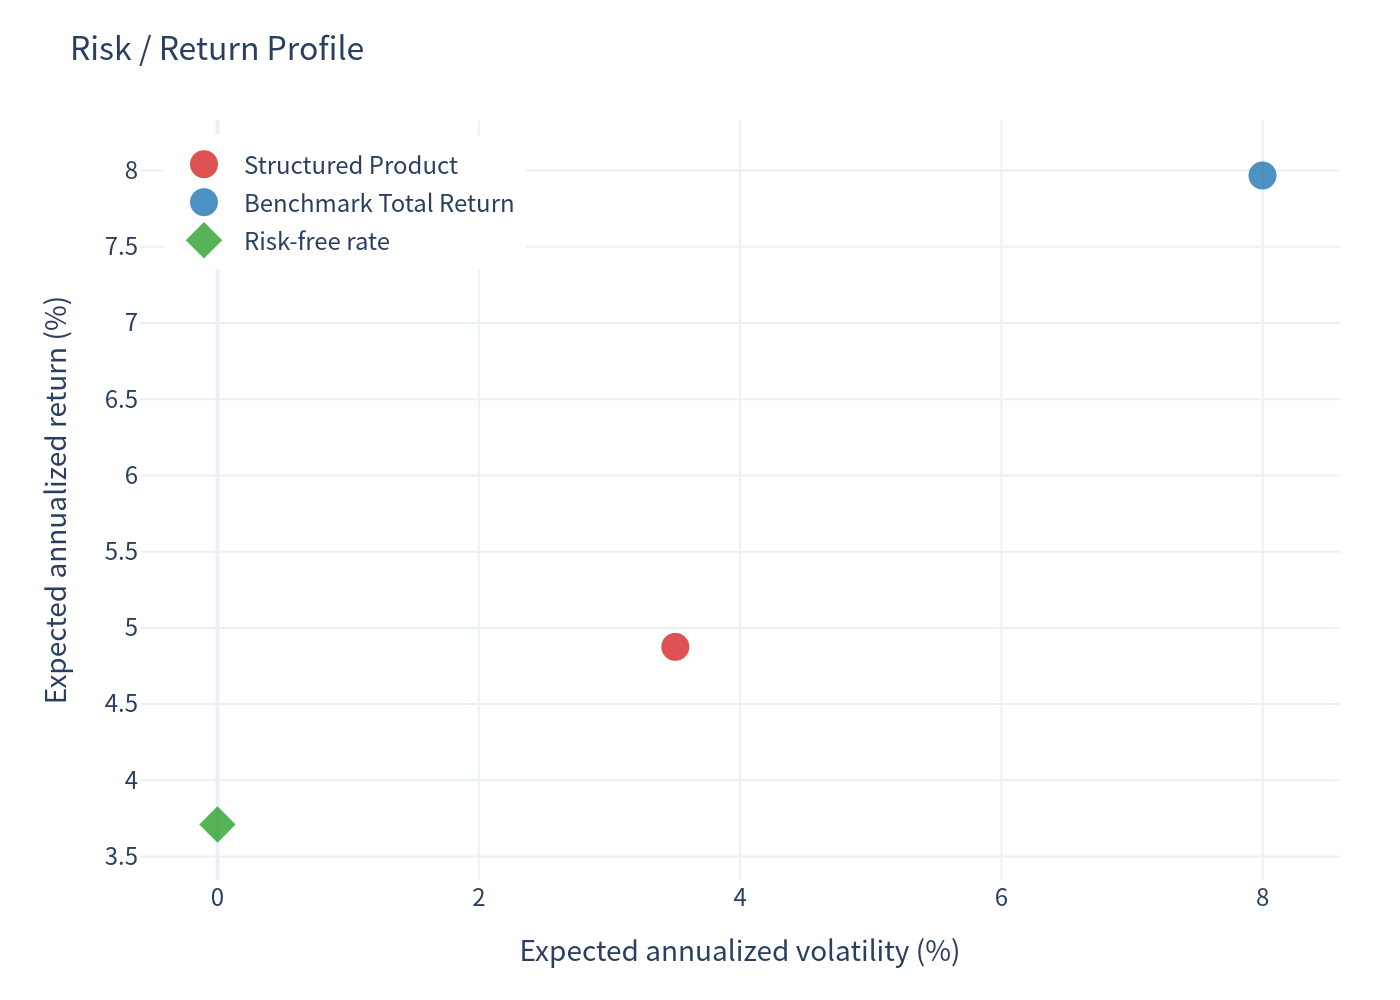
| Expected annualized return | 4.88% | 7.97% |
| Expected annualized volatility | 3.50% | 8.00% |
| Probability of loss | 0.00% | 15.70% |
| 99% VaR (1 year) | 0.00% | -12.59% |
Simulation outcome profile (structured product)
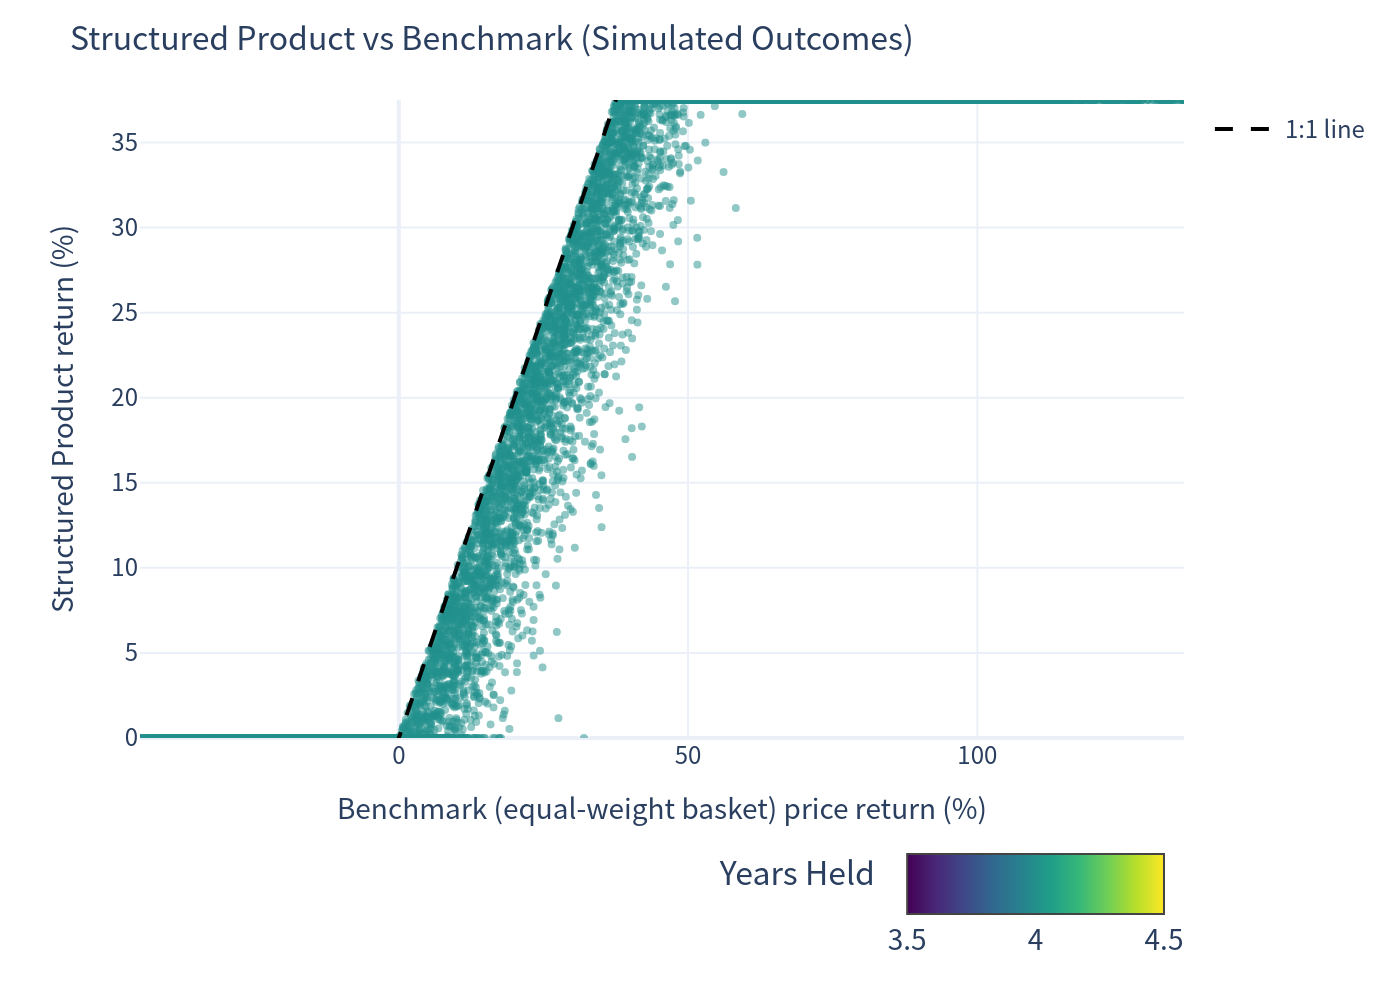
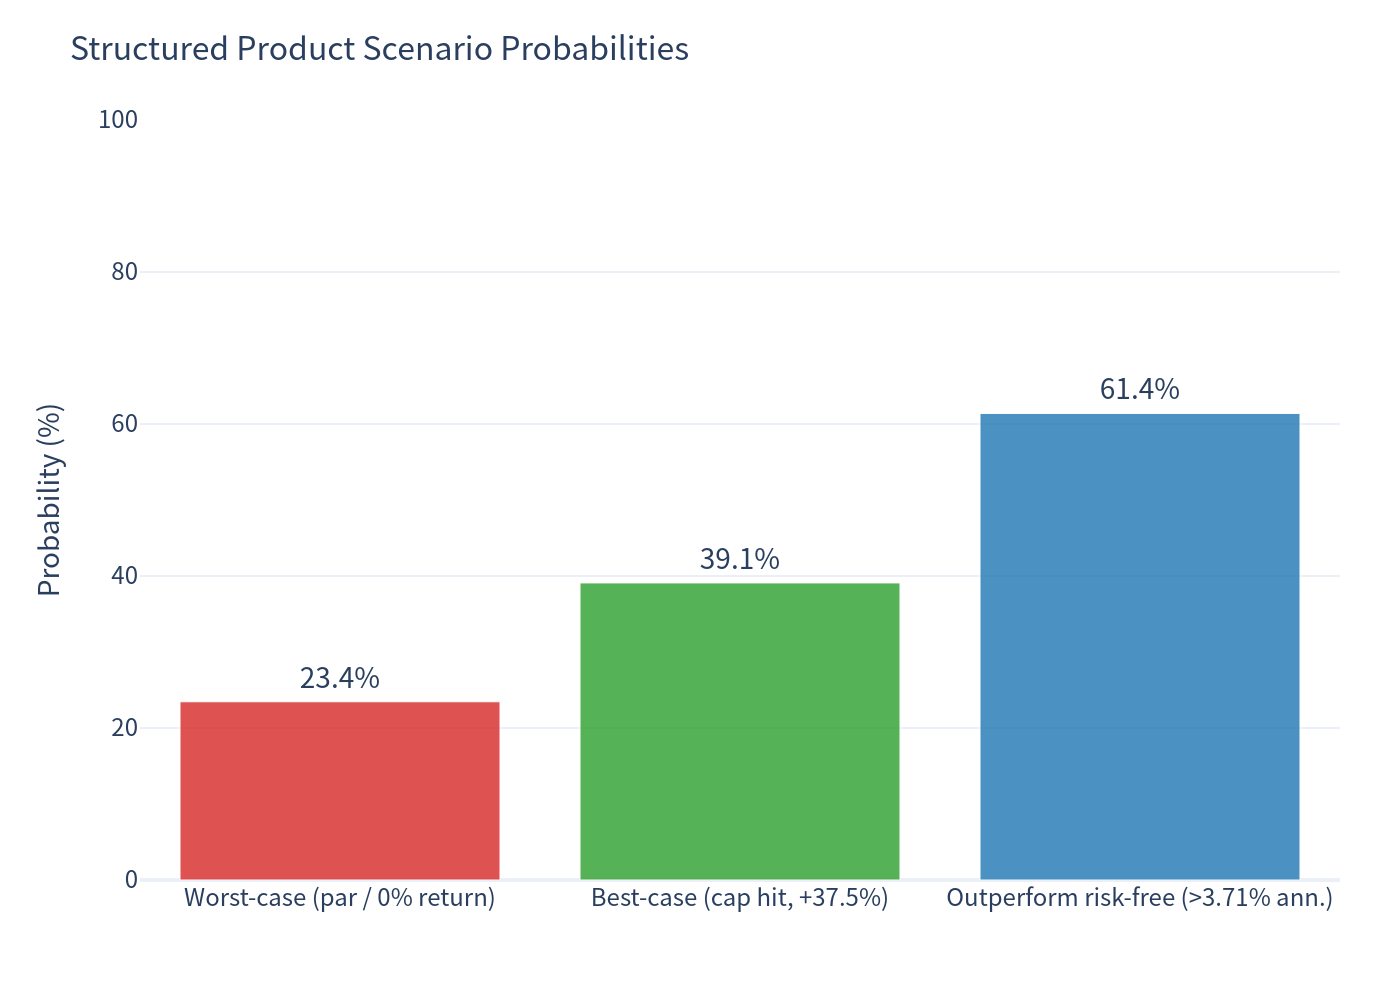
- Probability of receiving exactly par (worst performer ≤ 0%): 23.45%
- Probability of hitting the cap (+37.5% total): 39.09%
- Probability of outperforming the risk-free rate (3.71%): 61.39%
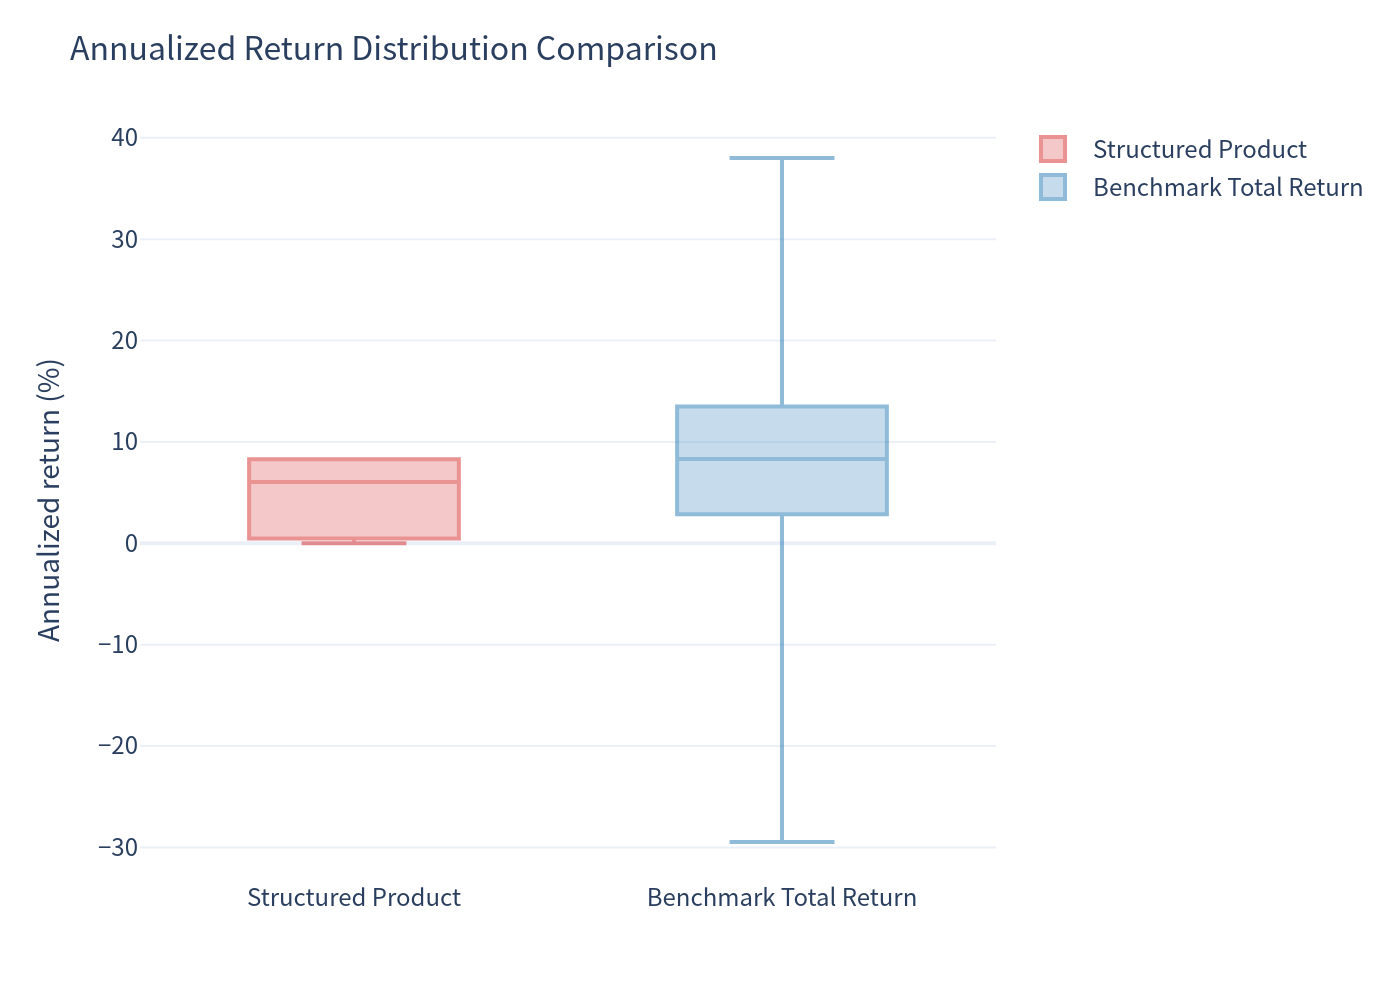
- Median annualized return: 6.05%
Charts
Simulated Outcomes: Product vs Benchmark
Scatter of simulated held-to-maturity outcomes comparing the structured product with the underlying benchmark.
Annualized Return Distribution — Benchmark (with dividends)
Distribution of simulated annualized returns for the equal-weight INDU/SPX basket including dividends.
Annualized Return Distribution — Structured Product
Distribution of simulated annualized returns for the structured product held to maturity.
Scenario Probabilities
Probability breakdown of key payoff scenarios for the structured product.
Risk / Return Profile
Risk-return positioning of the structured product relative to the benchmark.
Annualized Return Box Plot Comparison
Box plot comparing the distribution of simulated annualized returns for the product and the benchmark.
Investment Commentary
Positive features worth noting
- Full principal protection at maturity — the product eliminates downside entirely; no simulated held-to-maturity path produced a loss.
- 100% participation rate in the upside of the worst performer, up to the cap.
- Linked to two of the world's most followed US equity indices (Dow Jones and S&P 500), providing broad equity market exposure.
- In 61.39% of simulations the product beats the risk-free rate, and it does so with zero downside risk at maturity.
Trade-offs / considerations
- Upside is capped at +37.5% total (~8.29% annualized in the base case), so the product cannot capture very strong bull-market returns. If the final cap were set at the upper end of the range ($1,425), the maximum annualized return would be about 9.25%.
- Worst-of structure: because the payoff follows the laggard of the two indices, adding a second index makes it harder to reach the upside cap than a single-index note — the probability of earning the full cap is reduced.
- No income: the note pays no coupons, so total return is generated entirely at maturity.
- Cost drag: the estimated value of the note ($951.80) is below the $1,000 issue price, reflecting embedded issuance, structuring, and hedging costs — these reduce the expected economic return relative to a direct investment in the indices.
- Opportunity cost: expected annualized return (4.88%) is below the benchmark's expected total return (7.97%); the protection comes at the price of lower expected upside.