
tokenengine.ai
20.00% p.a. Multi Barrier Reverse Convertible on Nebius & Nvidia (Quanto CHF)
Headline Simulation Results
16.97%
Expected Annualized Return
6.00%
Probability of Negative Return
-37.60%
99% Confidence VaR (1 Year)
9.6
Expected Holding Period (months)
+12.96%
Expected Total Return over Realized Holding Period
20.00%
Coupon p.a. (Paid Quarterly)
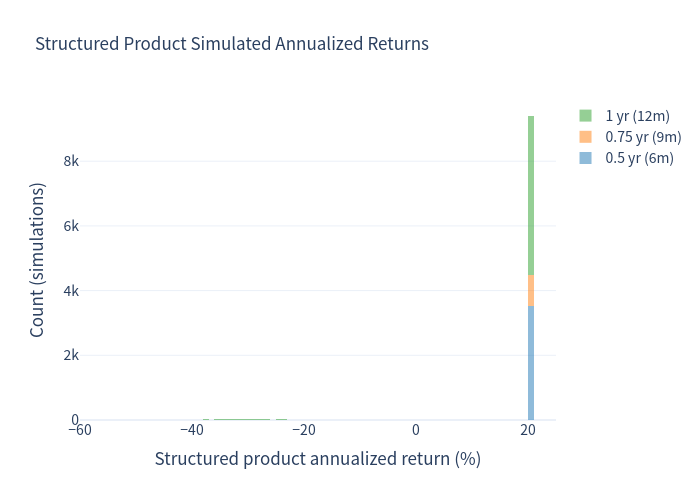
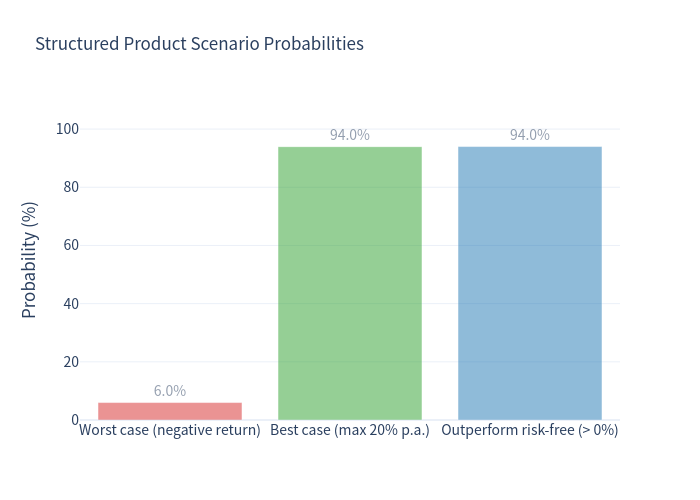
The product delivers a high, largely fixed annualized return. Because the product usually runs to its scheduled redemption (or is called early), most simulations return par plus all coupons, while a small tail (about 6%) suffers a capital loss when the barrier is breached.
Product Overview
| Type | Multi Barrier Reverse Convertible (Yield Enhancement, callable, quanto) |
|---|---|
| Underlyings | Nebius Group N.V. (NBIS) and NVIDIA Corp. (NVDA) — worst-of |
| Coupon | 20.00% p.a. paid quarterly (4 × CHF 50 per CHF 1,000) |
| Barrier | 49% of initial level, continuously observed |
| Strike | 100% of initial level |
| Term | ~12 months (Final Fixing 14/10/2027) |
| Early redemption | Issuer may call at ~month 6 and ~month 9 |
| Currency | CHF, quanto (no FX exposure to the USD underlyings) |
| Upside | Capped at the fixed coupon |
How it works (in plain terms)
- You are paid to wait. The investor receives coupons totalling 20% per annum, paid quarterly, regardless of how the two stocks perform — as long as the product is alive.
- Capital protection is conditional. If neither Nebius nor Nvidia ever trades at or below 49% of its starting level during the year (a ~51% cushion), the investor gets back 100% of the notional at maturity.
- The loss scenario. If either stock touches its 49% barrier at any time, the investor becomes exposed to the worse-performing stock at maturity: if that stock finishes below its starting level, the redemption is linked to its (depressed) price and the investor can lose part of the capital; if it recovers to at least its starting level, the investor still gets 100% back.
- The issuer may redeem early. On the two call dates the issuer can repay the notional plus the coupon due; this normally happens when the trade is going well for the issuer.
Key Statistics
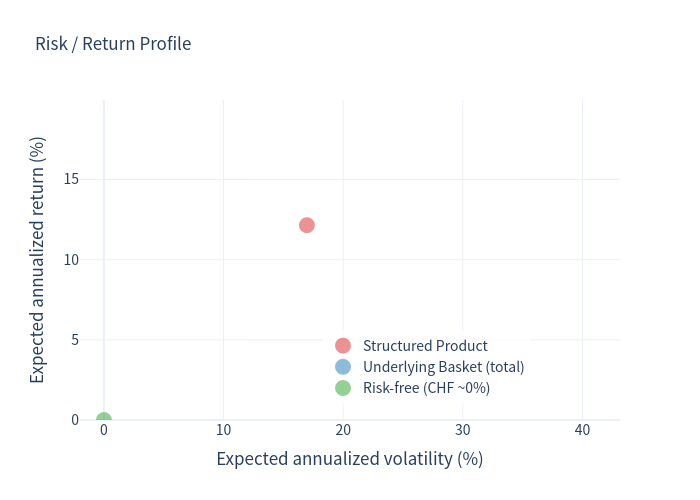
| Metric | Structured Product | Underlying Basket (total return) | CHF Risk-free (~0%) |
|---|---|---|---|
| Expected annualized return | 16.97% | 14.09% | 0.00% |
| Expected annualized volatility | 12.15% | 38.14% | 0.00% |
| Probability of loss | 6.00% | 39.74% | — |
| 99% confidence VaR (1 year) | -37.60% | -48.23% | — |
The structured product offers a higher expected return with roughly one-third of the volatility
of the underlying basket and a far lower chance of a loss. Its worst-case tail is also shallower
(99% VaR of -37.6% versus -48.2%).
Simulation Charts
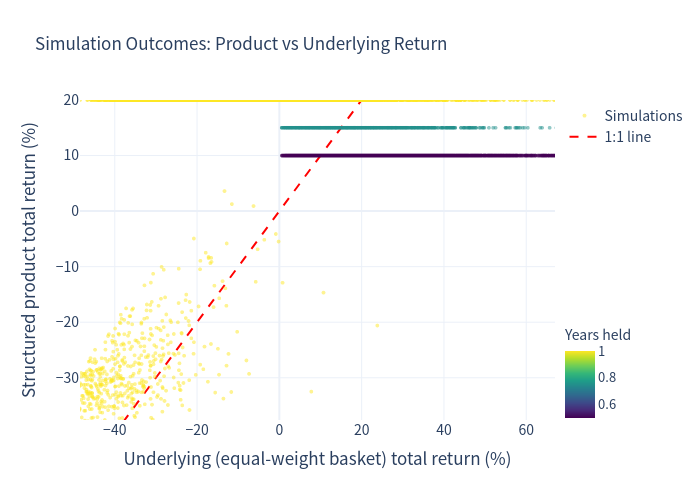
1. Simulation outcomes (product vs underlying)
Each dot is one simulation; the dashed line is the 1:1 line. Points above the line are simulations where the product beat the underlying basket.
2. Structured product — simulated annualized returns
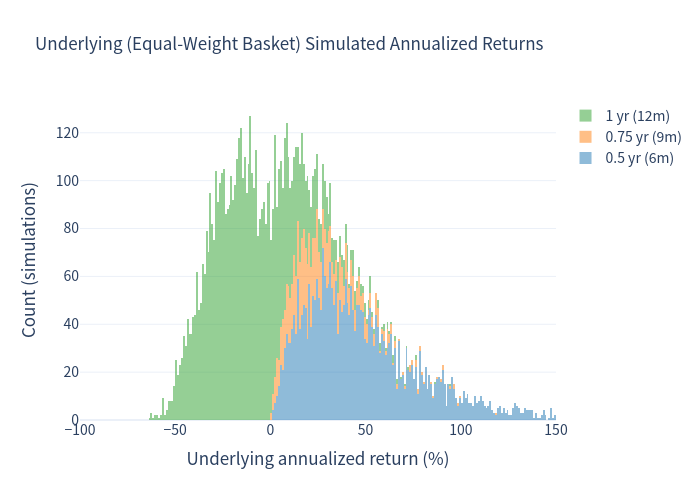
3. Underlying basket — simulated annualized returns
4. Risk / return profile
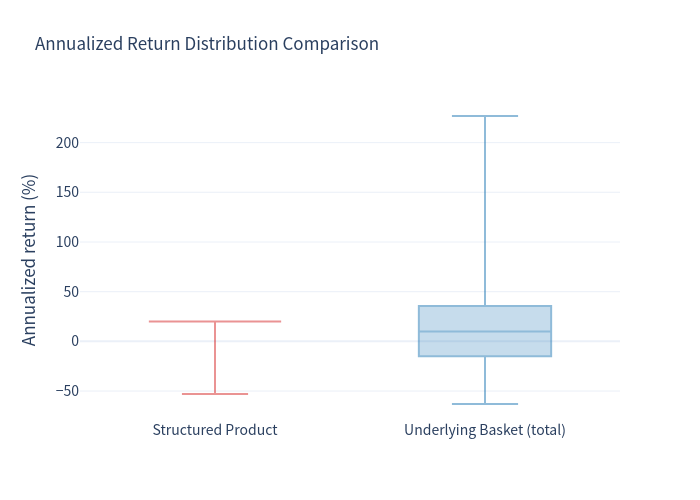
5. Annualized return distribution comparison
6. Scenario probabilities
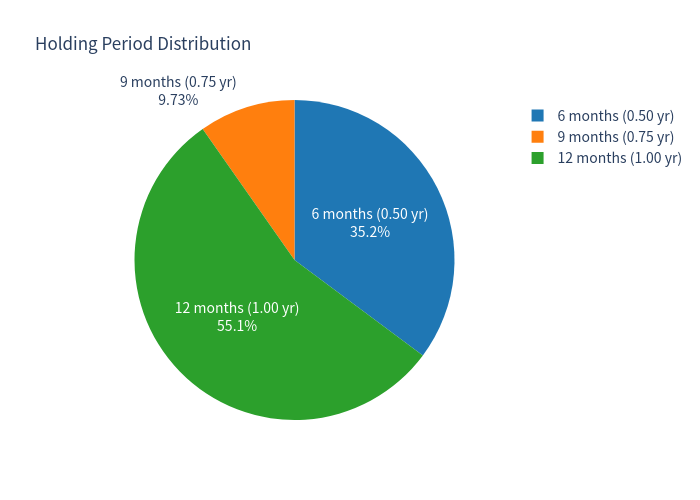
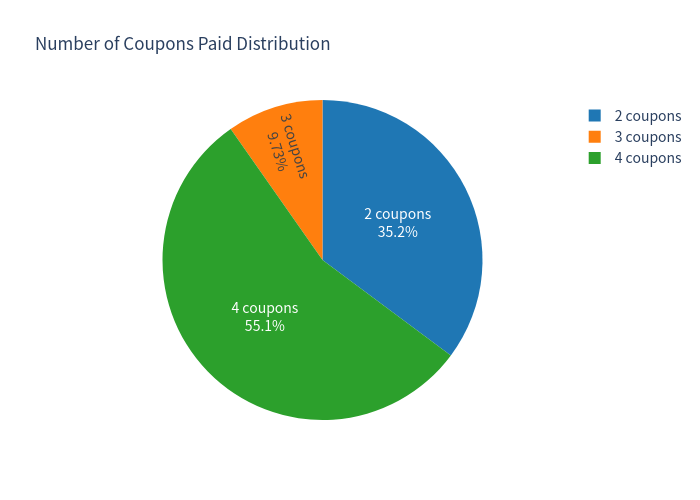
7. Holding period and coupon distributions
The product terminates early only when the issuer calls it; otherwise it runs the full year.
Results Interpretation
- Coupons. In every simulation the investor collects coupons: 35.2% of paths receive 2 coupons (called at 6 months), 9.7% receive 3 coupons (called at 9 months), and 55.1% receive 4 coupons (held to maturity).
- Holding period. Because the coupon accrues at the same effective rate across the call dates, the annualized return of a "good" path is close to 20% regardless of whether the product is called early or held to maturity. The main driver of the outcome is therefore whether the barrier is breached, not the early-call timing.
- Loss tail. Only ~6% of simulations lose money — those in which a stock breached 49% and the worst performer finished the year below its starting level. In the worst simulated case the worst stock ended ~73% below its start, producing a total return of about -52.9%.
- Annualization caveat. Annualized figures for sub-one-year holding periods are scaled linearly and can appear extreme (e.g., strong 6-month underlying outcomes annualize well above 100%). These should be read together with the holding period, not in isolation.
Investment Commentary
Potential positives
- A very high headline coupon (20% p.a.) that is paid irrespective of market direction.
- A deep barrier (49%, i.e. a ~51% cushion) combined with continuous observation still leaves the modelled probability of capital loss at only ~6%.
- Conditional protection: even after a barrier breach, capital is returned if the worst performer recovers to at least its starting level.
- Worst-of structuring concentrates the downside on a single name, but the coupon is generous relative to the probability of that tail.
- Quanto CHF eliminates currency risk from the USD-denominated underlyings, and the trade is collateralised (TCM).
- In simulation, the profile improves the risk-adjusted return versus holding the underlying basket: higher expected return, markedly lower volatility and a smaller loss probability.
Risks to be aware of
- Upside is capped at 20% p.a.; the investor gives up any upside beyond the coupon.
- Capital is at risk: if the barrier is breached and the worst-of finishes below its starting level, the redemption is linked to that stock and losses can be substantial (worst simulated 12-month total return ≈ -52.9%).
- Worst-of structure: the payoff depends on the single weakest of the two stocks, so joint downside matters.
- The product is callable at the issuer's discretion; early redemption caps the coupon stream.
- Issuer credit risk (Leonteq, Fitch BBB-) remains, notwithstanding the collateralisation.
This report provides a quantitative evaluation of the term-sheet mechanics only and does not constitute financial advice or a suitability assessment.