
Worst-of RTY & SPX Buffered PLUS (due May 30, 2031) — Analysis
Headline Simulation Results
This is a 5-year, worst-of structure linked to the Russell 2000 Index (RTY) and the S&P 500 Index (SPX). It pays no coupon. The payoff depends solely on the worst performing of the two indices at maturity.
Basic Product Information
- Issuer / Guarantor: Morgan Stanley Finance LLC / Morgan Stanley (CUSIP 61781FLZ4)
- Underliers: Russell 2000® Index (RTY) and S&P 500® Index (SPX)
- Payoff basis: the worst performing of the two indices at the single maturity observation date
- Term: 5 years (observation ~May 27, 2031; maturity ~May 30, 2031)
- Coupon: none
- Upside: leveraged 115%, uncapped
- Downside buffer: 20% (maximum loss capped at 80%)
- Early redemption: none
How It Works (plain language)
- At maturity the issuer looks at both indices and selects the one that performed worse over the 5 years.
- If the worst index is up: you receive your principal plus 115% of that index's gain — so a +10% move in the worst index pays +11.5%.
- If the worst index is down by up to 20%: you still get your full principal back — the first 20% of decline is absorbed by the buffer.
- If the worst index falls more than 20%: you lose one dollar for every dollar beyond the 20% buffer (e.g. a −50% worst index means a −30% loss). Losses are capped at 80%.
Because the payout keys off the worse of two indices, the return is driven by whichever index lags — this is the central risk/return trade-off of the product.
Key Statistics (simulated, 10,000 paths)
| Metric | Structured Product | Benchmark1 (Total Return) |
|---|---|---|
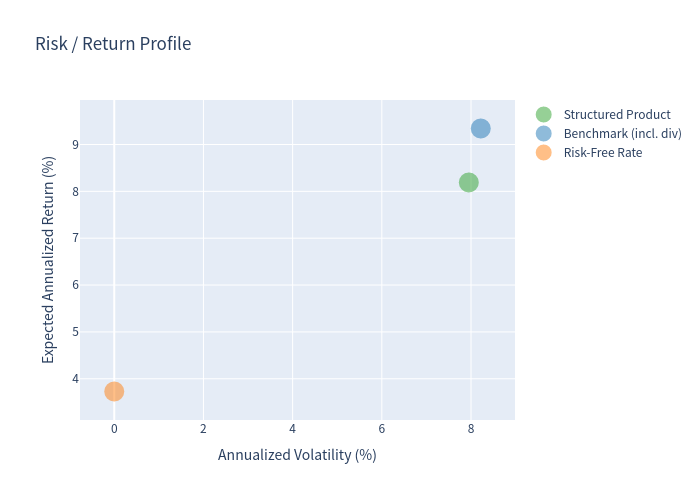
| Expected annualized return | 8.19% | 9.34% |
| Expected annualized volatility | 7.95% | 8.22% |
| Probability of loss | 11.13% | 13.15% |
| 99% confidence VaR (1-year) | −8.68% | −11.42% |
1 Benchmark = equal-weight (50/50) basket of RTY and SPX, including dividends (~0.94% basket yield). Risk-free rate = 1-year average 1Y T-bill (3.73%).
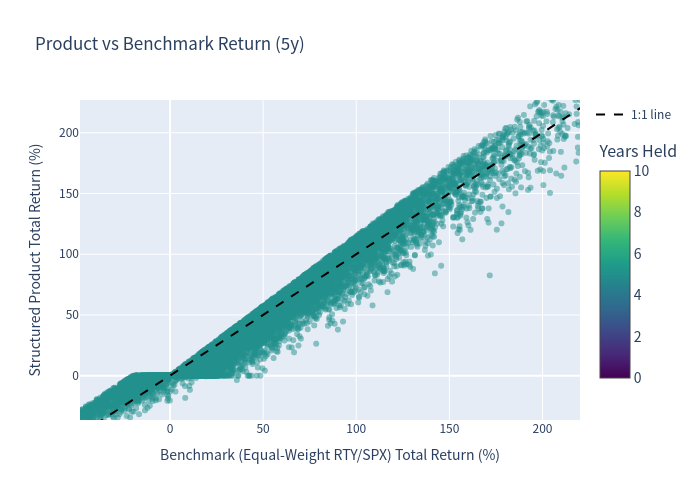
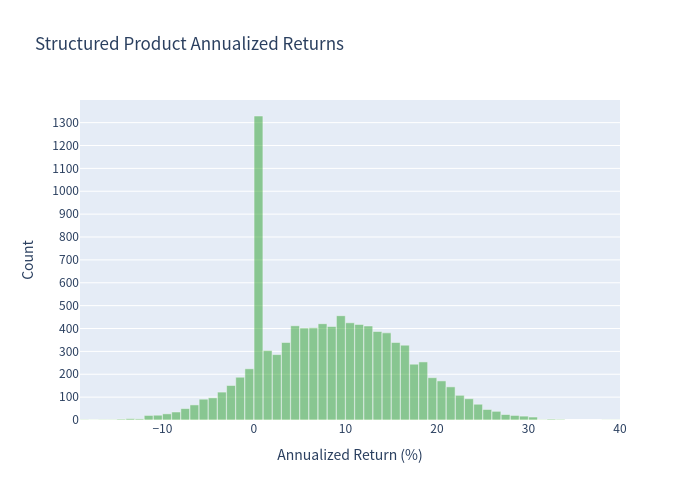
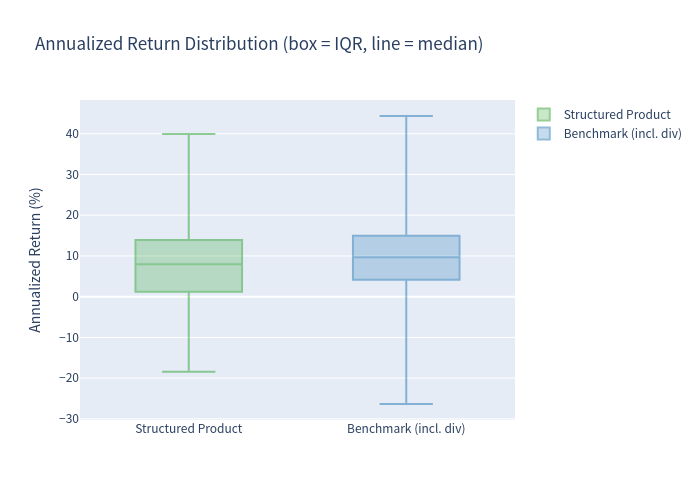
The buffer meaningfully compresses the downside: the product's annualized volatility (7.95%) and loss probability (11.13%) are both lower than the benchmark's, and its 99% VaR is roughly 24% less severe (−8.68% vs −11.42%). The cost of this protection is a slightly lower expected return, largely because the worst-of linkage drags on upside relative to a plain 50/50 basket.
Simulation Charts
Outcome Scatter — Product vs Benchmark
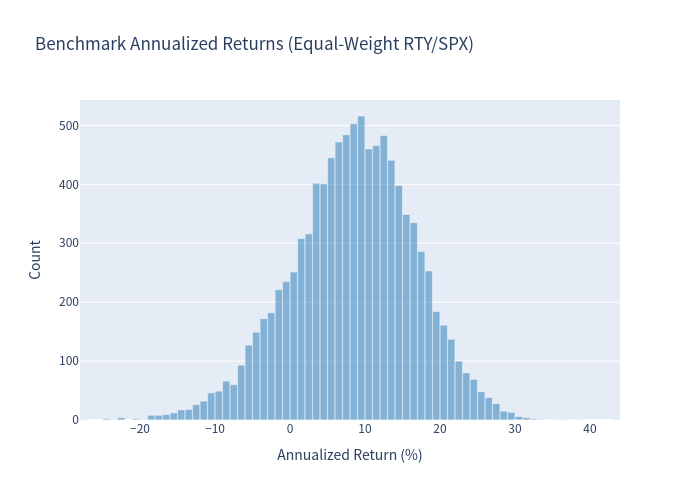
Underlying (Benchmark) Annualized Return Distribution
Structured Product Annualized Return Distribution
Risk / Return Profile
Annualized Return Box Plot
Scenario Probabilities
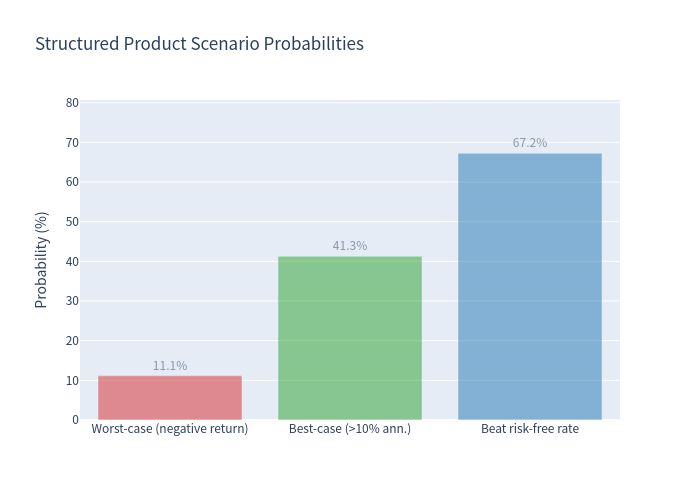
Scenario Probabilities
| Scenario | Probability |
|---|---|
| Worst-case (negative annualized return) | 11.13% |
| Best-case (annualized return > 10%) | 41.30% |
| Outperform the risk-free rate (3.73%) | 67.20% |
Investment Commentary
Potential positives
- Downside buffer: the 20% buffer absorbs the first fifth of a decline in the worst index, cutting annualized volatility to 7.95% and the 99% VaR to −8.68% — both better than the underlying basket.
- Leveraged, uncapped upside: 115% participation with no cap lets strong markets translate into above-market gains.
- High probability of clearing cash: 67.20% of paths beat the 3.73% risk-free rate, and 41.30% deliver >10% annualized.
- Defined, capped downside: the maximum loss is 80%, and losses only accrue beyond the −20% threshold, so the product does not lose principal for any worst-index outcome at or above −20%, and participates in the upside above that level.
Considerations
- Worst-of drag: linking to the worse of two indices lowers the expected return (8.19%) versus a plain equal-weight basket (9.34% total return) — investors give up upside for the buffer.
- No income: the security pays no coupon, so total return depends entirely on terminal performance.
- Single observation: the payoff is measured only at maturity, so interim recoveries do not help a worst-case path.
- Credit and liquidity: returns depend on the issuer's creditworthiness, and the notes are not listed, so secondary-market liquidity may be limited.