
Structured Product Analysis
Headline Simulation Results
| Metric (Structured Product) | Value |
|---|---|
| Expected annualized return | 8.93% |
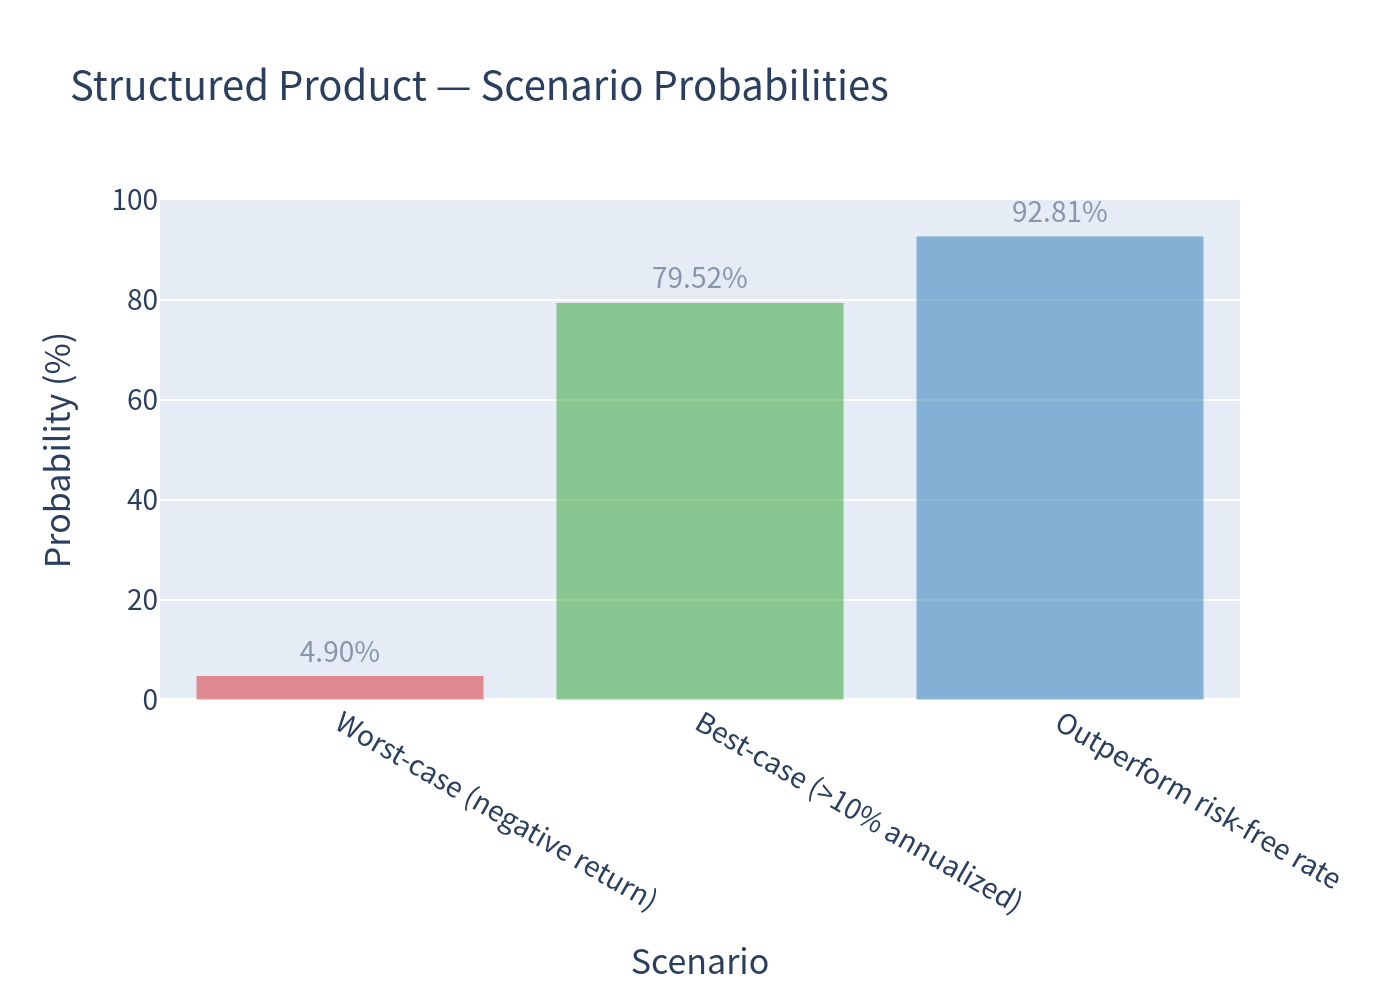
| Probability of a negative return | 4.90% |
| 99% confidence VaR (1-year, annualized) | −17.30% |
| Expected holding period | 1.11 years (13.3 months) |
| Median annualized return | 10.75% |
| Probability of outperforming the risk-free rate (3.77%) | 92.81% |
| Probability of early redemption (autocall) | 86.11% |
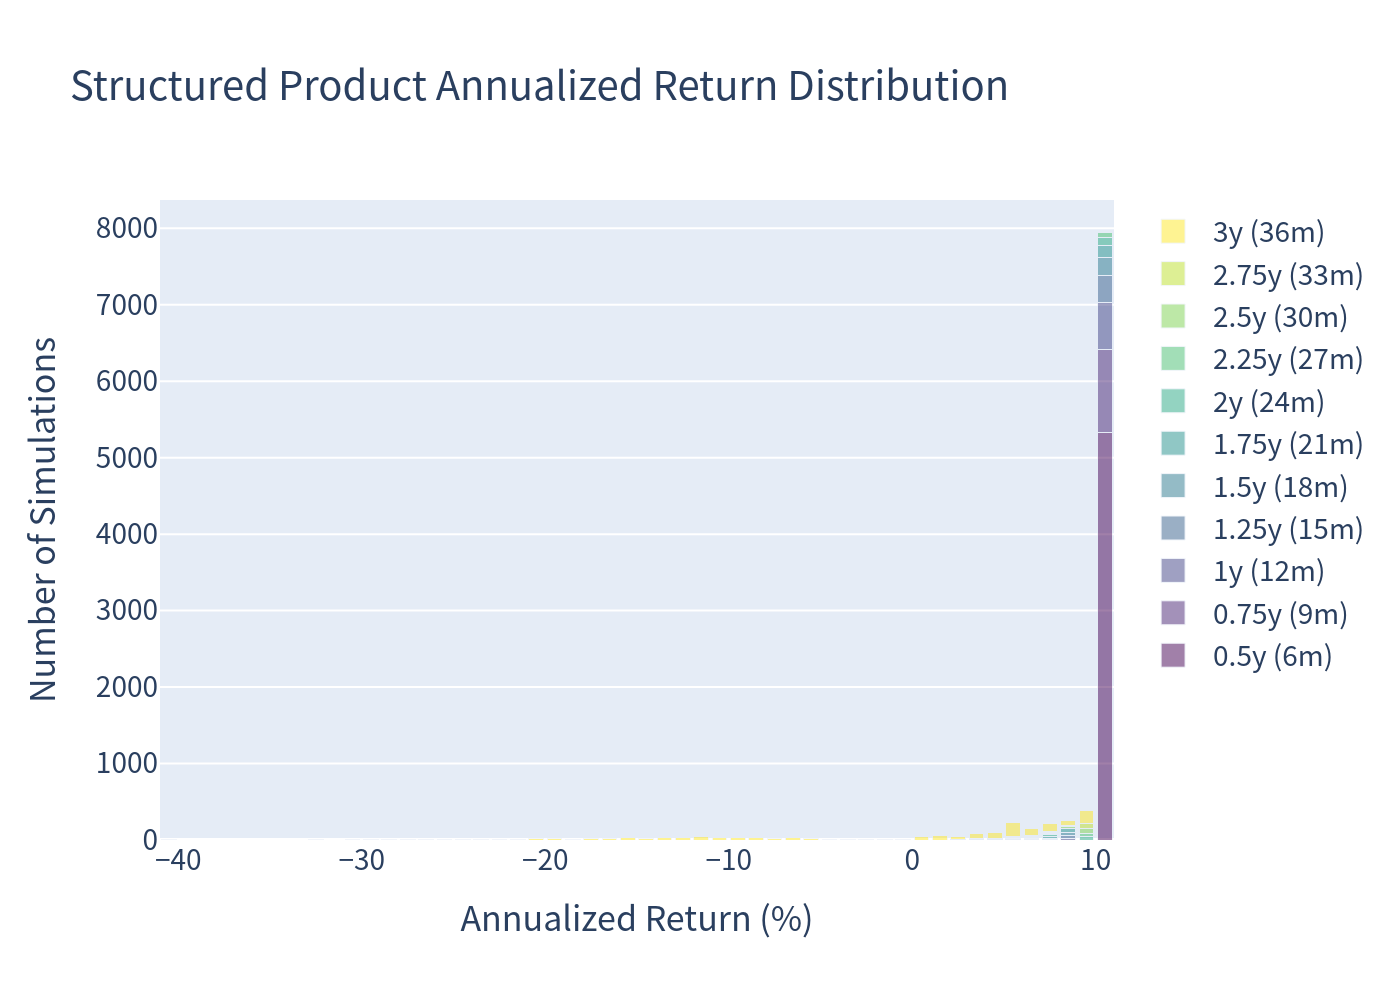
The simulated outcome distribution is highly concentrated at the coupon rate: 79.52% of paths deliver more than 10% annualized, with a median of exactly 10.75% (the coupon). The mean (8.93%) is pulled below the median by a small loss tail — in 4.90% of paths the note loses money, driven by the worst-of index breaching its 70% downside threshold.
Basic Product Information
| Item | Detail |
|---|---|
| Issuer / Guarantor | Morgan Stanley Finance LLC / Morgan Stanley |
| Underlyings | Dow Jones Industrial Average (INDU), EURO STOXX 50 (SX5E), Russell 2000 (RTY) — worst-of |
| Contingent coupon | 10.75% p.a. (range 10.25%–11.25%), paid quarterly (2.6875 points per quarter) |
| Coupon barrier | 80% of each index's initial level |
| Call threshold | 100% of each index's initial level |
| Downside threshold | 70% of each index's initial level |
| Tenor | ~3 years (maturity Oct 4, 2029) |
| Upside | Capped — no participation in index appreciation |
Units: all monetary figures are per security with a $1,000 notional (equivalently 100 index points; 1 index point = $10).
How It Works (Plain English)
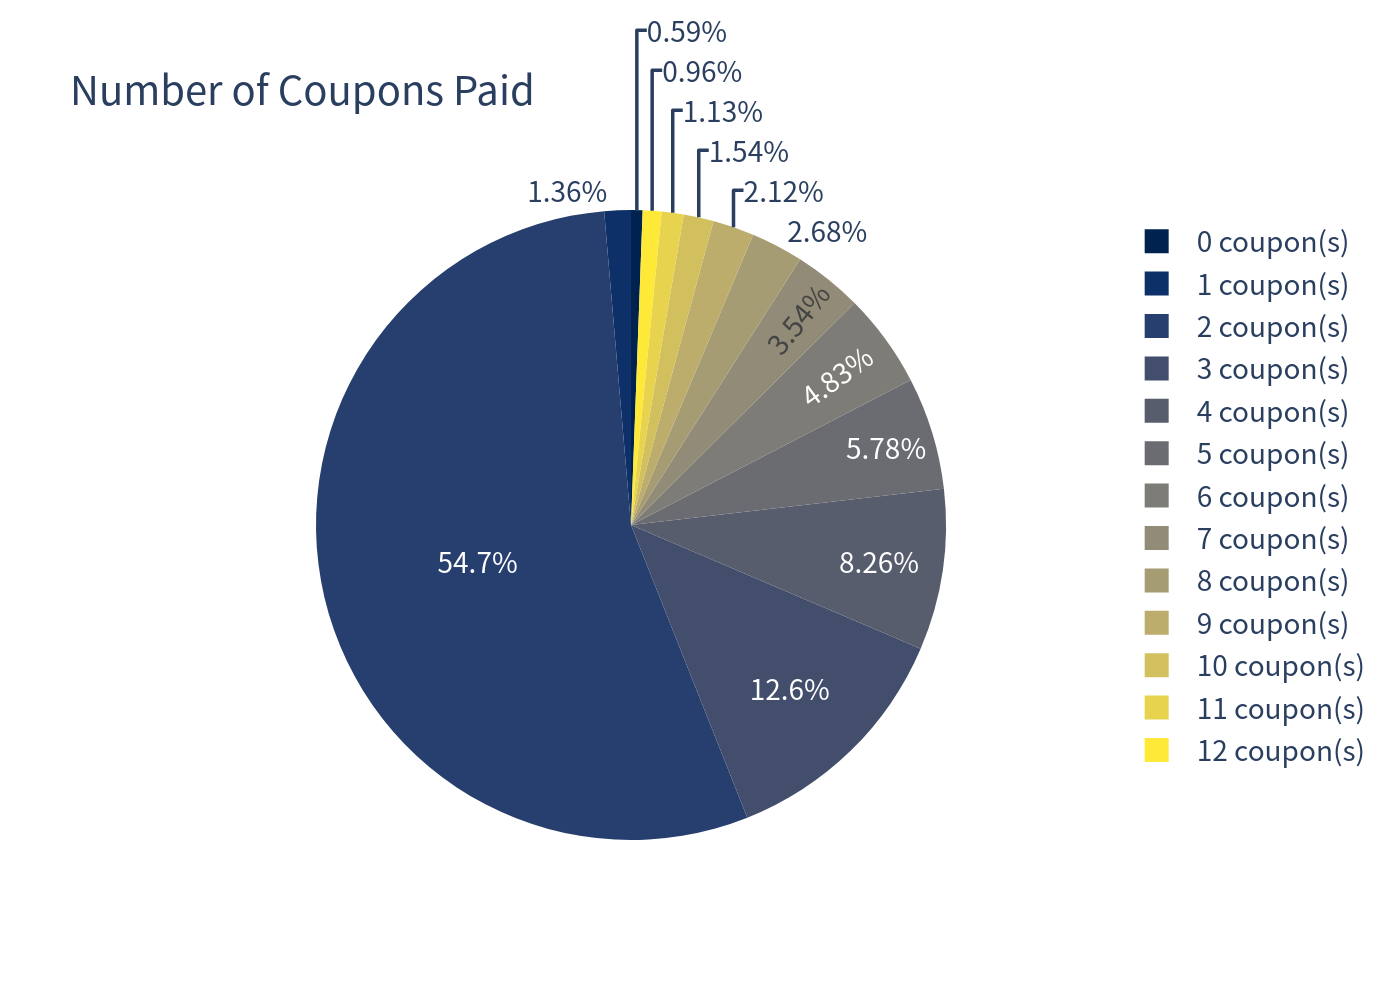
- Quarterly coupon. Every quarter the note pays a coupon (≈2.69% of notional, or ~10.75% per year) only if the worst-performing of the three indices is at or above 80% of its starting level on that quarter's observation date. The coupon has no memory — a coupon that is "missed" on one date is forfeited permanently.
- Automatic early redemption ("autocall"). Starting 6 months in and then quarterly, if all three indices close at or above 100% of their starting level, the note redeems early: you receive your full principal back ($1,000 = 100 index points) plus that quarter's coupon, and the deal ends.
-
Maturity (if never called).
- If the worst-of index is at or above 70% of its start → you get par ($1,000) back (plus the final coupon if the worst-of is ≥80%).
- If the worst-of index is below 70% of its start → you take a 1:1 loss: you lose 1% of principal for every 1% the worst index sits below its start (e.g., −31% → $690; −50% → $500).
- Upside cap. You never participate in index gains — the best outcome is par plus coupons.
Key Statistics
| Metric | Structured Product | Benchmark (Equal-Weight Basket, Total Return) |
|---|---|---|
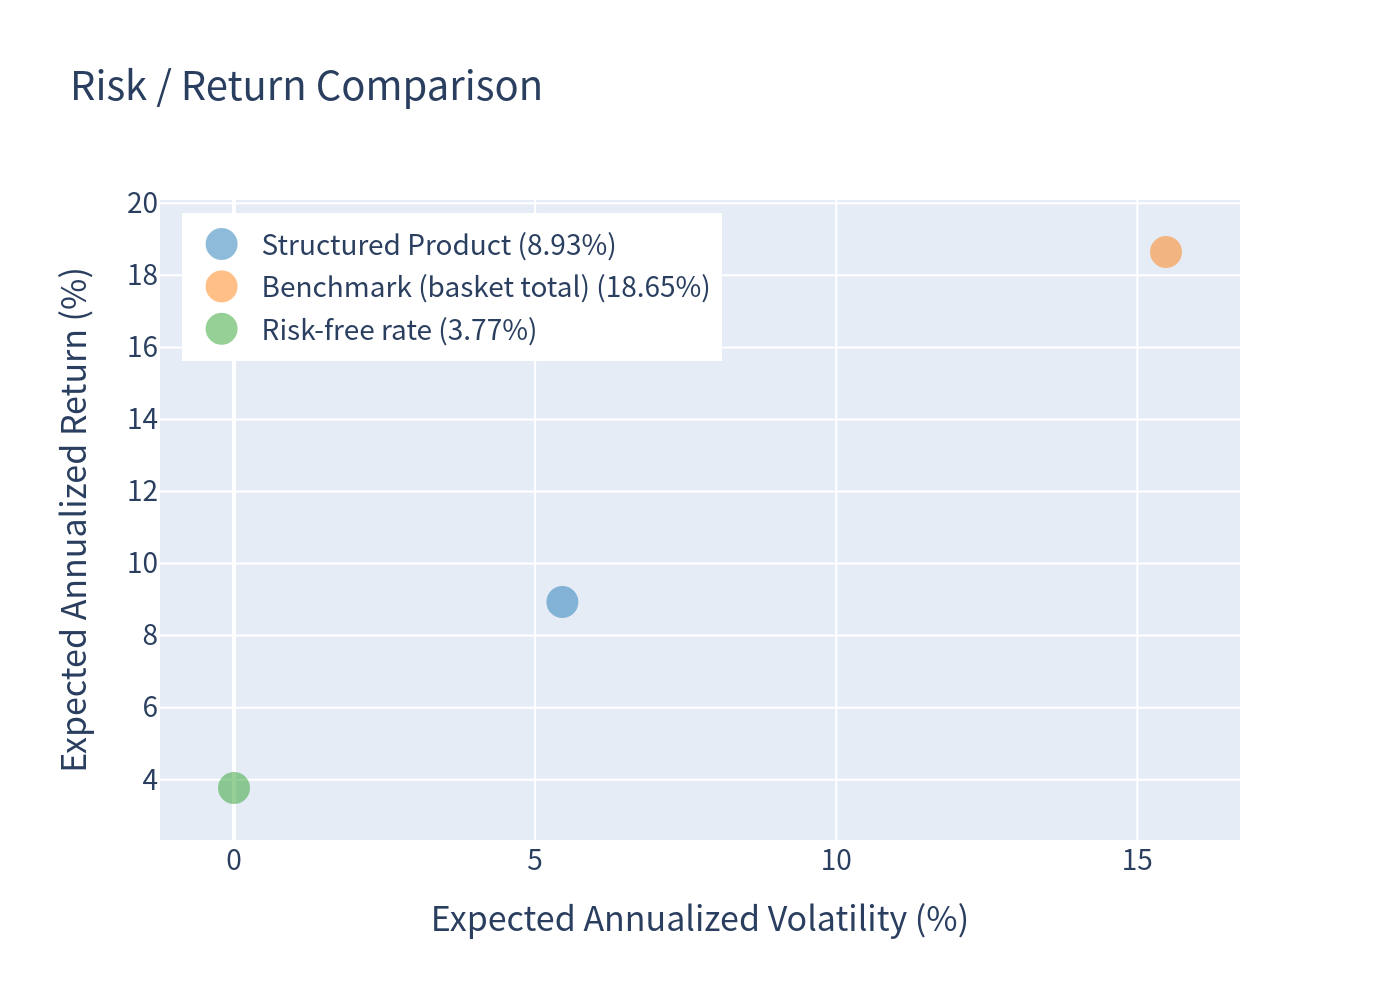
| Expected annualized return | 8.93% | 18.65% |
| Expected annualized volatility | 5.45% | 15.48% |
| Probability of loss | 4.90% | 9.34% |
| 99% VaR (1-year, annualized) | −17.30% | −12.52% |
| Expected total return (over realized holding period) | 7.16% | 9.97% |
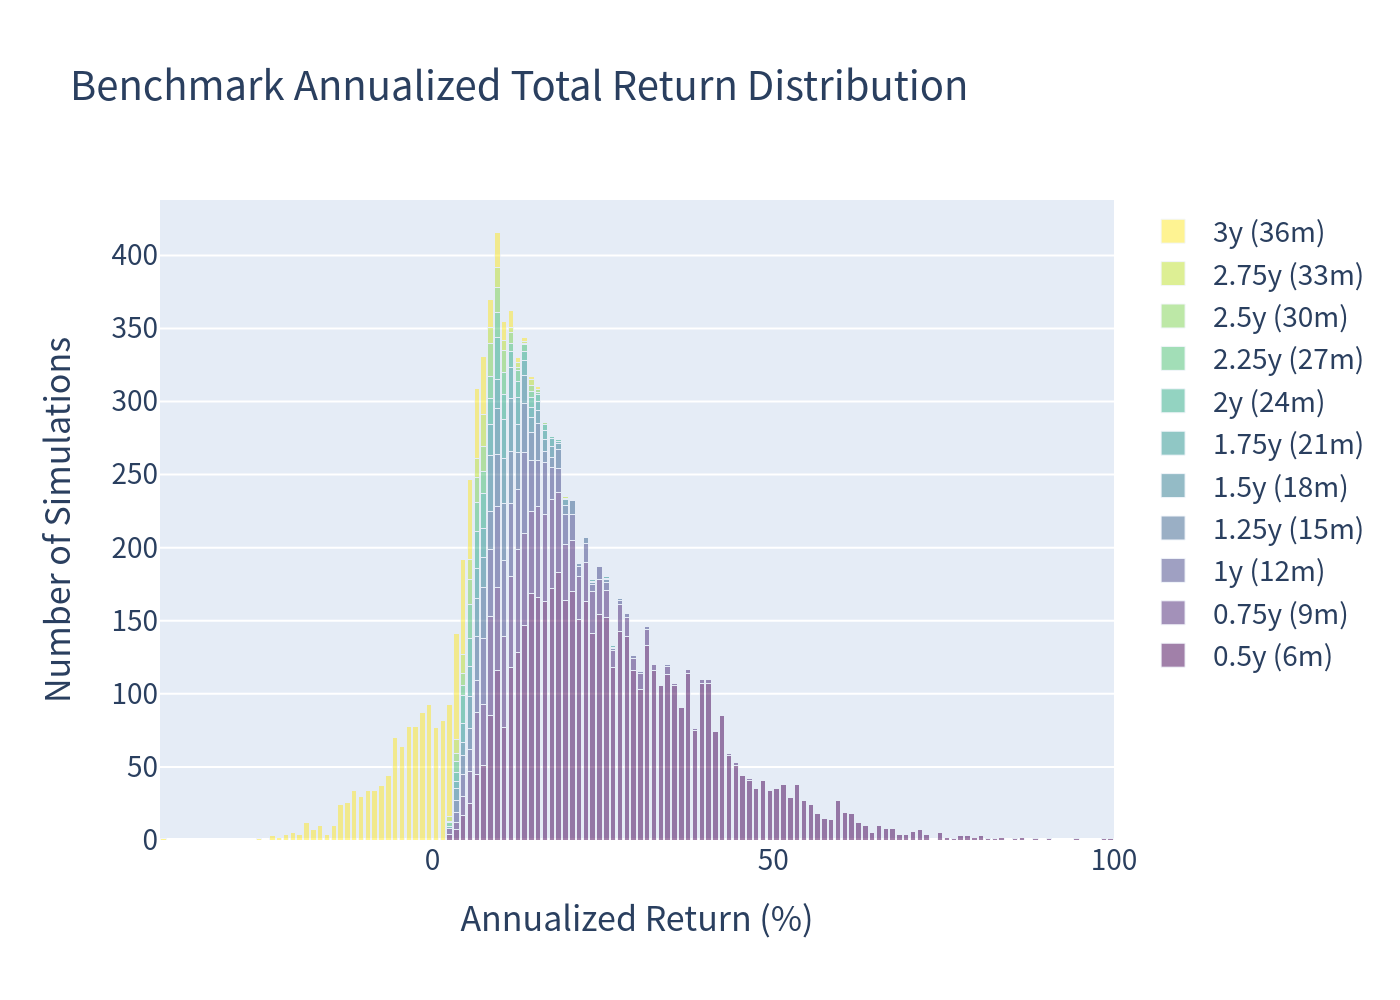
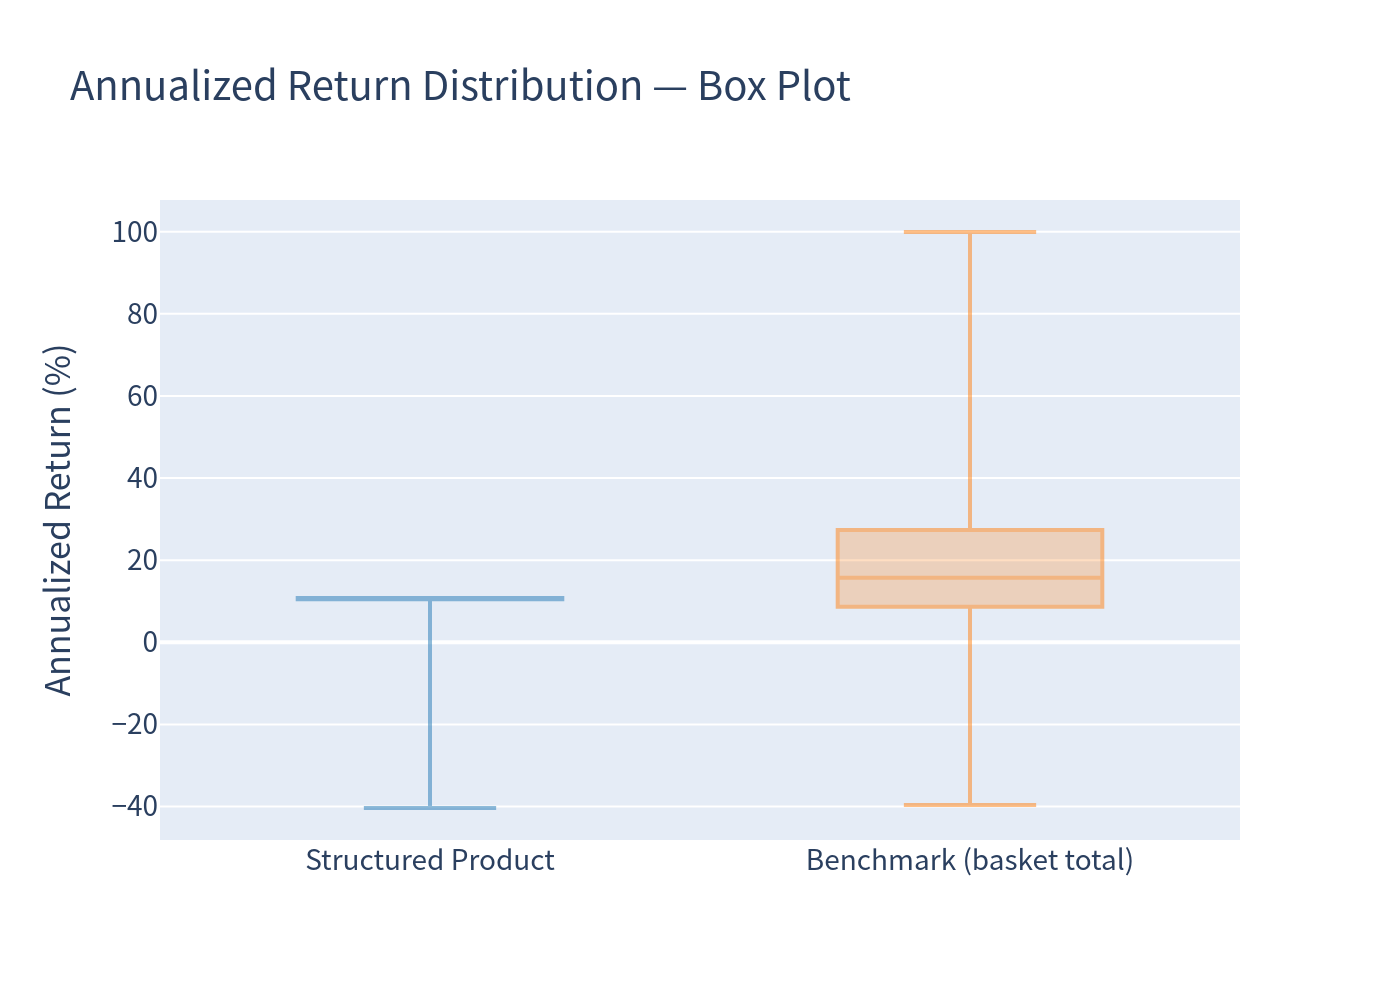
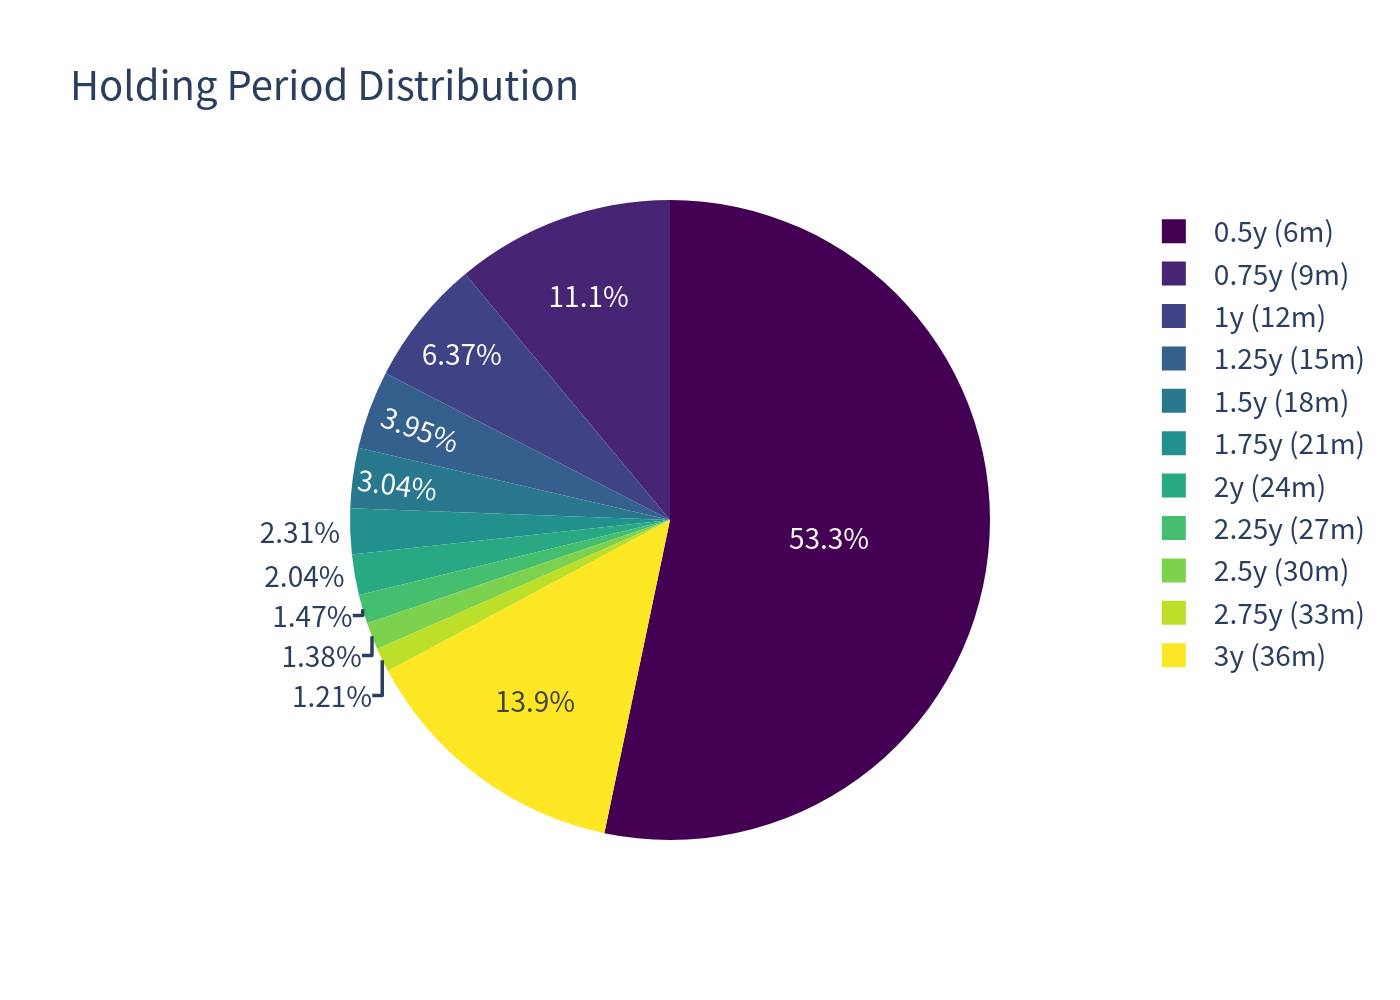
Note on annualized figures. The expected holding period is short (~1.1 years) and 64.3% of paths roll off in under 12 months (mostly via autocall in rising markets). Annualized figures — especially for the basket — can therefore look extreme, because positive short-horizon returns are scaled linearly. The basket's 18.65% mean annualized return is inflated by a handful of very short, very strong rallies; its expected total return over the same horizon (9.97%) is the fairer apples-to-apples comparator. On a total-return basis the capped, worst-of note trails the basket but with materially lower volatility.
Charts
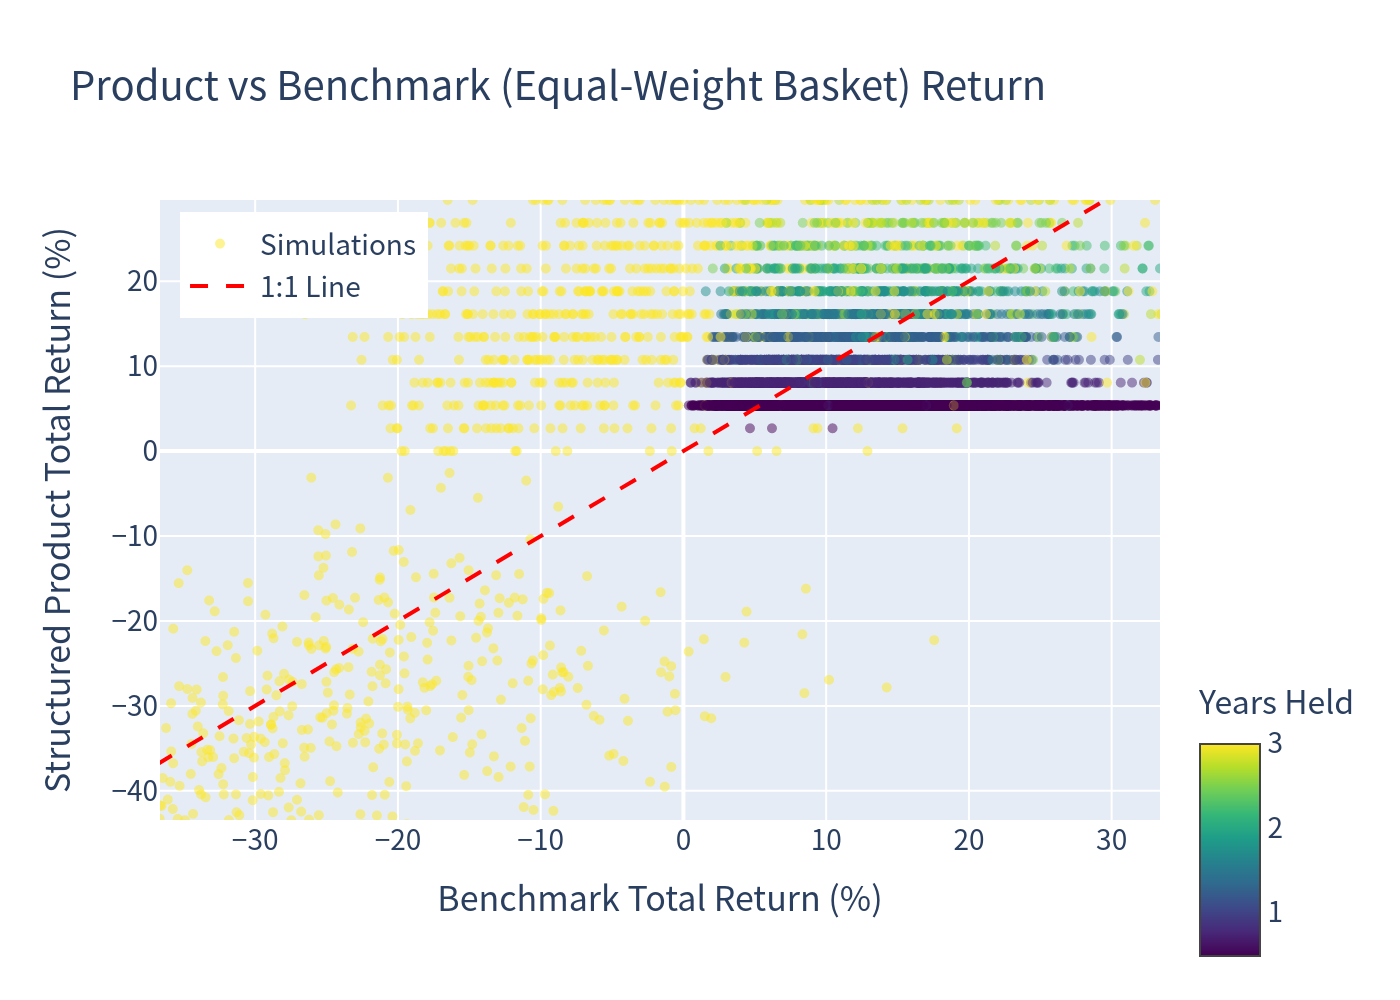
Simulation Outcomes — Product vs Benchmark
Each point is one simulation; color shows years held; the dashed line is the 1:1 reference.
Benchmark (Basket) Annualized Return Distribution
Structured Product Annualized Return Distribution
Note the sharp spike at the coupon rate (~10.75%) from early redemptions, and the loss tail below zero.
Risk / Return Comparison
Annualized Return — Box Plot
Scenario Probabilities
Holding Period & Coupon Count Distributions
Investment Commentary
Potential merits
- Attractive headline income. A ~10.75% p.a. coupon is far above the ~3.77% risk-free rate, and 92.81% of simulated paths outperform cash.
- Frequent, quick early redemption. The 100% all-of autocall triggers early in 86.11% of paths, locking in the coupon and returning principal within ~6–15 months in most cases.
- Some downside cushion. The 70% downside threshold limits principal loss in moderate drawdowns, and the 80% coupon barrier allows the coupon to be missed without an immediate capital loss.
Risks and drawbacks
- Capped upside / structural underperformance in rallies. Because participation is capped and the note autocalls early in strong markets, it concedes substantial upside versus simply holding the indices — compare the box plot.
- Worst-of exposure. Losses are driven by the single weakest index, so a lone laggard can cause a loss even if the other two rise.
- Contingent, memory-less coupons. A dip below 80% on an observation date forfeits that quarter's coupon permanently.
- Meaningful tail risk. The 99% VaR of −17.30% and a −40.37% worst-case annualized outcome show that in a severe, broad sell-off the 1:1 downside can be painful.
- Issuer credit risk. Repayment depends on Morgan Stanley / MSFL.