
8.00% p.a. Multi Barrier Reverse Convertible on Nestlé, Novartis, Sika
Simulation-based evaluation | CHF | worst-of | 59% continuous barrier | issuer-callable | ISIN CH1607585481
1. Headline simulation results
| Metric | Structured product |
|---|---|
| Expected annualized return | 4.56% |
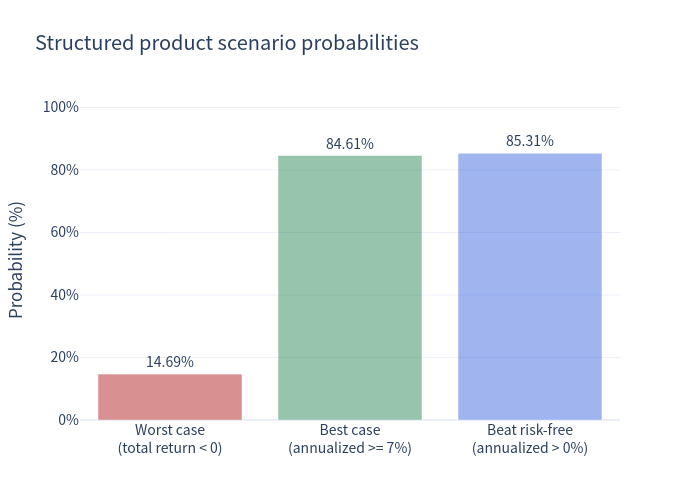
| Probability of negative return (annualized < 0) | 14.69% |
| 99% confidence VaR (1 year) | −25.28% |
| Expected annualized volatility | 8.25% |
| Expected total return over the realized holding period | 6.61% |
| Expected holding period | 19.3 months (1.61 years) |
| Probability of a positive annualized return | 85.31% |
| Probability of a capital-preserved outcome (par redemption, annualized return ≥ 7%) | 84.61% |
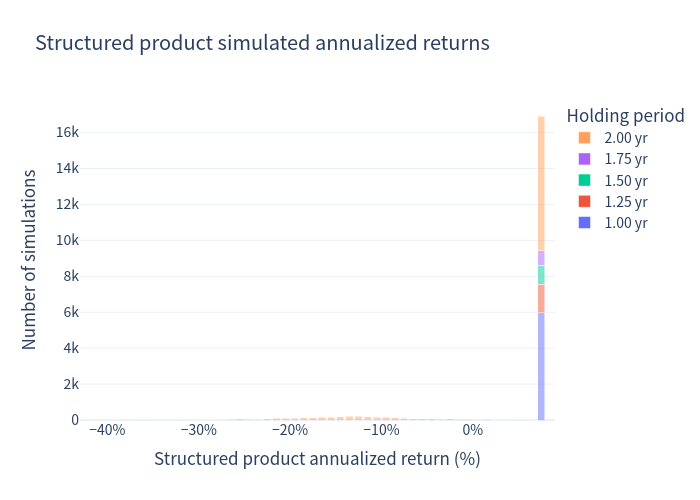
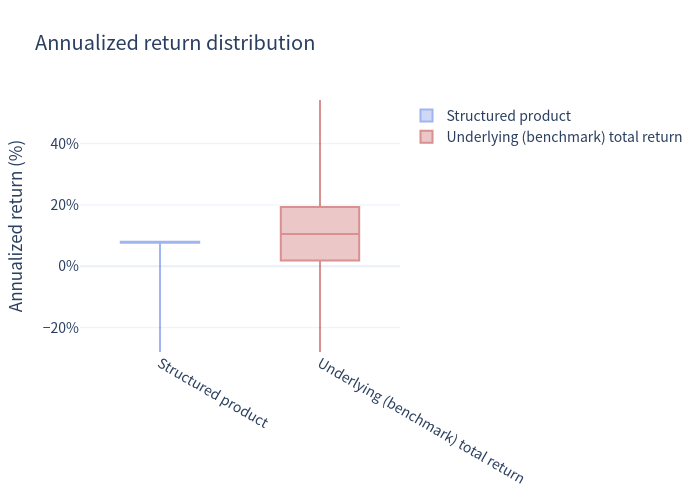
The product is very likely to deliver close to its 8.00% p.a. coupon (median simulated annualized return 7.70%), but it carries a fat left tail: in roughly 1 year in 6 the worst-of basket breaches the barrier and the investor takes a capital loss. Because upside is capped while downside is not fully shielded once the barrier breaks, the product's 1%-tail loss (−25.28%) is worse than that of simply holding the underlying basket (−14.52%).
2. How the product works (plain language)
- The investor buys a note at 100% (CHF 1,000) and receives a fixed 8.00% p.a. coupon (CHF 20 per quarter), paid regardless of how the shares perform.
- Three Swiss blue chips — Nestlé, Novartis and Sika — make up a worst-of basket: the payoff focuses on whichever share falls the most.
- Conditional protection: as long as none of the three shares ever trades at or below 59% of its starting level (monitored continuously over the whole 2-year life), the investor gets par (100%) back at maturity no matter how far the shares fell.
- If the barrier is breached (any one share touches ≤ 59% at any moment), the protection disappears and the investor is exposed to the worst-performing share: at maturity they receive that share's value (capped at par 100%: if the worst-of has recovered to ≥ 100% the investor simply gets par back), with no participation in any upside above the strike.
- Issuer call right: the issuer may redeem the note early on any of the quarterly call dates (from month 12). If called, the investor receives par plus the coupon for that period, and all future upside and coupons stop — this caps the maximum return at roughly the coupon rate.
Modelling note: the issuer's call is discretionary (no contractual trigger). It is modelled as exercised whenever the worst-of level is at or above 100% (strike) on a call date.
3. Key statistics — product vs. underlying
| Metric | Structured product | Underlying basket (total return) |
|---|---|---|
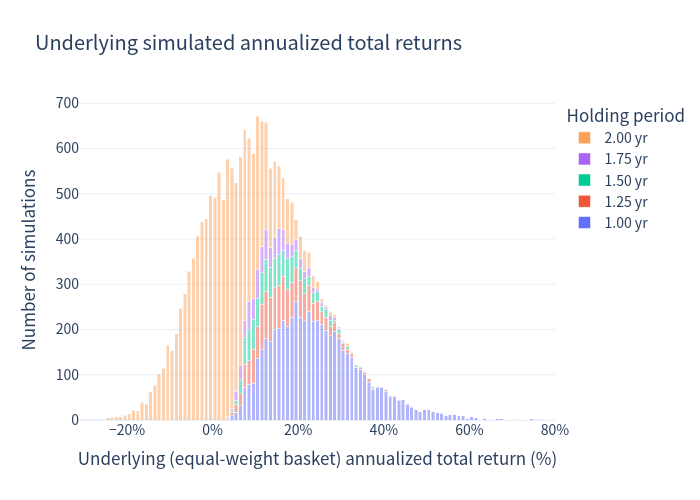
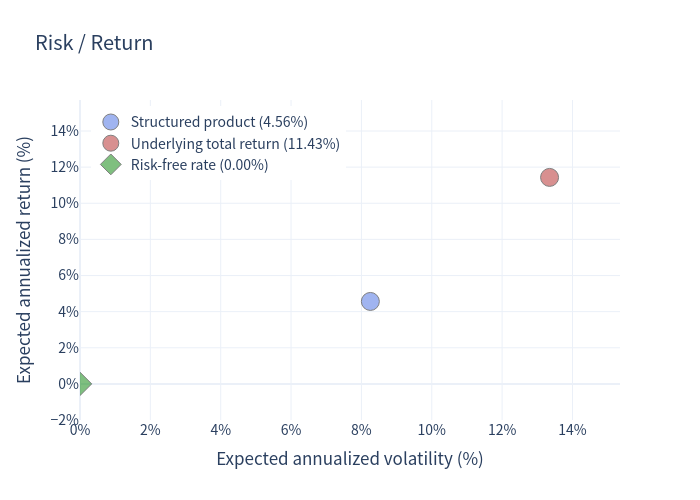
| Expected annualized return | 4.56% | 11.43% |
| Expected annualized volatility | 8.25% | 13.35% |
| Probability of loss (annualized < 0) | 14.69% | 20.16% |
| 99% confidence VaR (1 year) | −25.28% | −14.52% |
Benchmark = equally-weighted basket of Nestlé, Novartis and Sika, including their average dividend yield (~3.04%). The worst-of of the three names, for reference, has an expected annualized return of −3.12% and volatility of 13.68%.
4. Charts
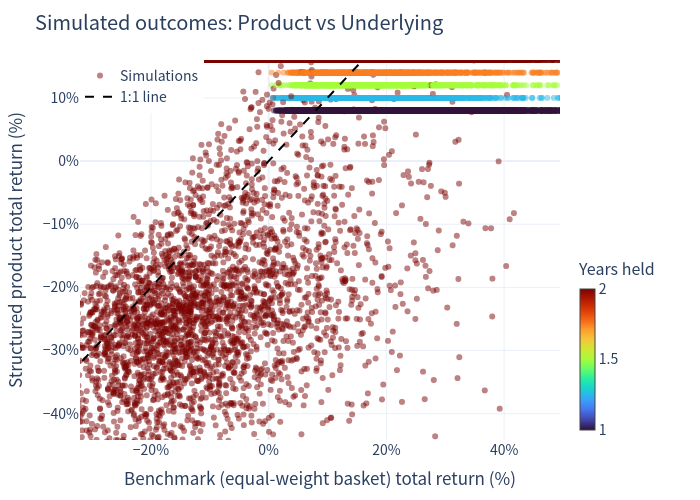
Simulated outcomes — product vs. underlying
Scatter plot, colour = years held.
Underlying basket — simulated annualized total returns
1% bins, stacked by holding period.
Structured product — simulated annualized returns
1% bins, stacked by holding period.
Risk / return map
Annualized return distribution
Scenario probabilities for the structured product
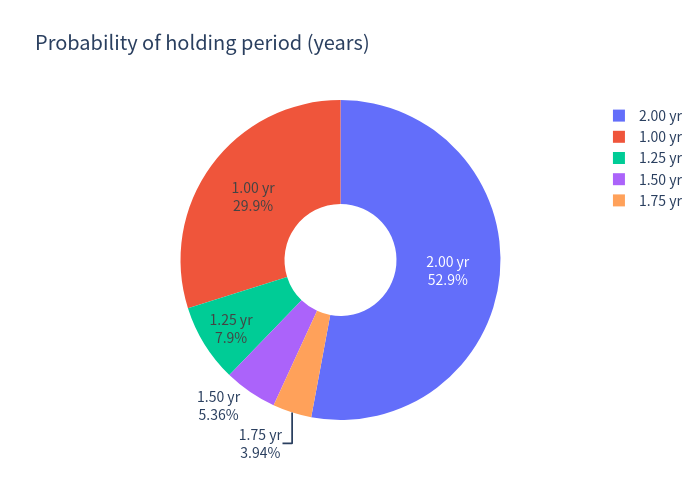
Probability of holding period (years)
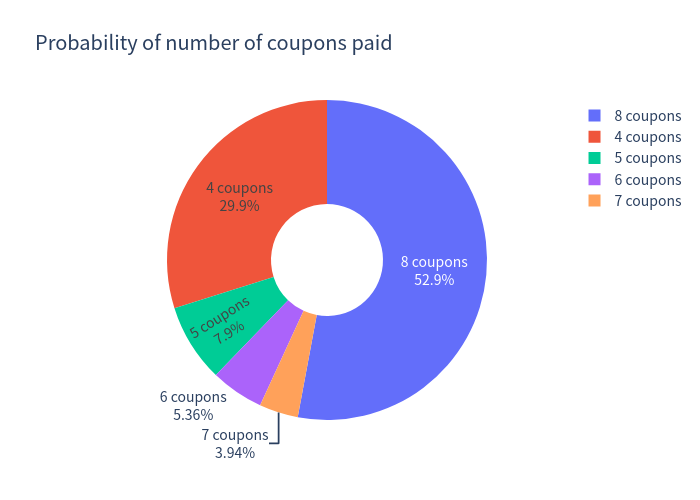
Probability of number of coupons paid
5. Hold-period and coupon behaviour
- Early redemption probability: 47.07% — of which 29.88% at the first call date (month 12). The issuer's ability to call strips most of the upside whenever the basket rallies.
- Expected number of coupons paid: 6.42 of 8. 52.93% of paths run to maturity (2.00 years).
- Because the issuer calls early mostly in up-markets, a large share of simulations deliver a total return of exactly 8.00%–16.00% (i.e., 8% p.a.).
6. Investment commentary
Points in favour
- High, unconditional coupon: the 8.00% p.a. is paid regardless of underlying performance, materially above the near-zero CHF risk-free rate.
- Substantial conditional protection: the 59% barrier means the investor is repaid at par unless a share falls more than 41%; ~84% of simulated paths avoid any capital loss.
- Lower volatility and lower probability of loss than a direct investment in the basket (8.25% vs 13.35% vol; 14.69% vs 20.16% loss probability).
- Diversification within a worst-of: three defensive, high-quality Swiss large caps (pharma/consumer, healthcare, specialty chemicals).
Points to weigh
- Upside is fully capped and the issuer call right truncates it further: even in a strong equity market the investor earns roughly the coupon, not the equity upside (expected return 4.56% vs 11.43% for the basket).
- Worse tail risk than the underlying: the 99% VaR of −25.28% is more severe than the −14.52% of the basket, because a barrier breach concentrates the loss in the worst-of while the coupon caps the upside.
- Worst-of mechanics bite in precisely the scenario that hurts most: only one of the three names needs to breach 59% for protection to vanish.
- Issuer credit exposure (Leonteq, Fitch BBB-), though the product is TCM-collateralised.
Note: the coupon is contractual and unconditional (paid on every scheduled date); the 84.61% figure above refers to a capital-preserved, “full-value” outcome (par redemption and/or early call with coupon intact), not to the coupon itself.
Figures are simulated (monthly steps, 20,000 paths, GJR-GARCH with fat tails) and shown to two decimal places; percentages are annualized unless stated otherwise.